Call Girls Ludhiana Just Call 98765-12871 Top Class Call Girl Service Available
Earnings Release 4Q08
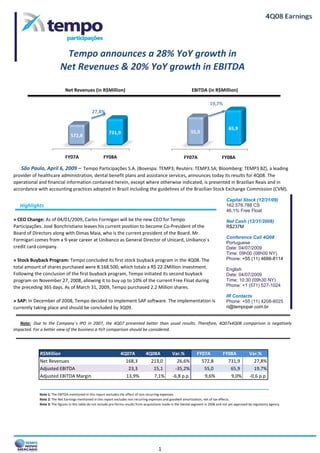
1. Tempo announces a 28% YoY growth in
Net Revenues & 20% YoY growth in EBITDA
Net Revenues (in R$Million) EBITDA (in R$Million)
19,7%
27,8%
65,9
55,0
731,9
572,8
FY07A FY08A FY07A FY08A
São Paulo, April 6, 2009 – Tempo Participações S.A. (Bovespa: TEMP3; Reuters: TEMP3.SA; Bloomberg: TEMP3 BZ), a leading
provider of healthcare administration, dental benefit plans and assistance services, announces today its results for 4Q08. The
operational and financial information contained herein, except where otherwise indicated, is presented in Brazilian Reais and in
accordance with accounting practices adopted in Brazil including the guidelines of the Brazilian Stock Exchange Commission (CVM).
Capital Stock (12/31/09)
Highlights 162.576.788 CS
46,1% Free Float
» CEO Change: As of 04/01/2009, Carlos Formigari will be the new CEO for Tempo Net Cash (12/31/2008)
Participações. José Bonchristiano leaves his current position to become Co-President of the R$237M
Board of Directors along with Dimas Maia, who is the current president of the Board. Mr.
Conference Call 4Q08
Formigari comes from a 9-year career at Unibanco as General Director of Unicard, Unibanco´s
Portuguese
credit card company. Date: 04/07/2009
Time: 09h00 (08h00 NY)
Phone: +55 (11) 4688-8114
» Stock Buyback Program: Tempo concluded its first stock buyback program in the 4Q08. The
total amount of shares purchased were 8.168.500, which totals a R$ 22.2Million investment. English
Following the conclusion of the first buyback program, Tempo initiated its second buyback Date: 04/07/2009
Time: 10:30 (09h30 NY)
program on November 27, 2008, allowing it to buy up to 10% of the current Free Float during
Phone: +1 (571) 527-1024
the preceding 365 days. As of March 31, 2009, Tempo purchased 2.2 Million shares.
IR Contacts
» SAP: In December of 2008, Tempo decided to implement SAP software. The implementation is Phone: +55 (11) 4208-8025
ri@tempopar.com.br
currently taking place and should be concluded by 3Q09.
Note: Due to the Company´s IPO in 2007, the 4Q07 presented better than usual results. Therefore, 4Q07x4Q08 comparison is negatively
impacted. For a better view of the business a YoY comparison should be considered.
4Q07A 4Q08A Var.% FY07A FY08A Var.%
R$Million
Net Revenues 168,3 213,0 26,6% 572,8 731,9 27,8%
Adjusted EBITDA 23,3 15,1 -35,2% 55,0 65,9 19,7%
Adjusted EBITDA Margin 13,9% 7,1% -6,8 p.p. 9,6% 9,0% -0,6 p.p. -0,6 p.p.
Note 1: The EBITDA mentioned in this report excludes the effect of non recurring expenses.
Note 2: The Net Earnings mentioned in this report excludes non recurring expenses and goodwill amortization, net of tax effects.
Note 3: The figures in this table do not include pro-forma results from acquisitions made in the Dental segment in 2008 and not yet approved by regulatory agency.
1
2. About TEMPO
» Tempo Participações S.A. is a leading provider of healthcare administration services, dental benefit plans and specialized assistance
services. Within the group, each business manages a fragmented network of more than 60,000 specialized service providers with
nationwide coverage. The Company benefits from cross-selling opportunities in its client base, which is comprised of: leading
insurance companies, HMOs, government entities and private corporations. Tempo benefits from economies of scale by using a
uniform operating platform and proprietary IT systems to manage its contact center, service provider network, and auditing/
processing. The illustration below details the process:
» Tempo has a low risk business model (frequency risk only) with predictable and recurring revenue and strong operational leverage.
In addition, the Company enjoys major entry barriers, low level of fixed assets and strong cash flow generation (Asset Light).
2
3. COMMENTS BY TEMPO´S MANAGEMENT
Coming from a year when the Company was created, four acquisitions and a record-time setting IPO,
2008 presented yet another challenging year for Tempo to continue persuing leadership in each
business segment.
In 2008 it was no different. Tempo continued to pursue efficient M&A activities while having solid
organic growth. Tempo acquired five companies and established a joint-venture. Most of the 2008
acquisitions propelled Tempo´s dental segment to become part of the major players in Brazil and the
fastatest growing dental company coming from 120k lives in January of 2007 and finishing the year
2008 with 833 thousand. As cause and effect pans out, these events also brought new challenges to
Tempo with integration and restructuring of the newly acquired companies and previous investments
from 2007.
With the global economic crisis that started during the second half of 2008, Tempo was forced to make
adjustments and deal with difficulties not foreseen in its forecast. The Company managed to keep
modest organic growth in its business segments due its unique business model that it less sensitive
than most, within its respective business segments, during such turbulent scenarios. Furthermore, it
gave the Company an opportunity to start focusing more attentively on internal efficiencies and less on
market consolidation. On October of 2008, the Board of Directors approved the first stock buyback
program. Given the economic mood and Tempo´s long tradition of acquisitions, the stock buyback
program was, and still is, an attractive alternative that ultimately adds value to our shareholders. With
the goal to promote internal efficiencies, in December of 2008, Tempo decided to implement SAP as its
ERP. The program will encompass all business segments and the heart of the company – back office, by
consolidating all acquired companies into a solid platform.
Due to acquisitions in 2008 and changes in Brazilian Corporate Law (“Corporate Law”) somehow
equivalent to IFRS accounting rules (Law 6,404/76, as amended by Law 11,638/07 and Executive
Decree 449/08), Tempo took measures to improve its accounting processes and to comply with the
new law. Our financial statements are in accordance with generally accepted accounting standards in
Brazil, pursuant to Corporate Law and the rules of the Brazilian Securities and Exchange Commission
(CVM). As explained throughout this release, the changes in reporting are non-recurring events which
do not reflect losses in sales and/or productivity during 4Q08.
Barueri, April 6, 2009
Investor Relations
3
4. Operational Performance
SUMMARY OF TEMPO´S RESULTS BY SEGMENT
4Q07A 4Q08A Var.%
R$Million
Tempo
Health Dental Assistance Tempo Health Dental Assistance Tempo
26,6%
102,8 5,6 59,9 168,3 122,6 24,7 65,7 213,0
Net Revenues
25,2%
82,2 3,1 34,0 119,3 94,9 12,2 42,1 149,3
Cost of Rendered Services
-35,2%
13,7 3,6 6,1 23,3 6,2 3,9 5,0 15,1
Adjusted EBITDA
-6,8 p.p.
13,3% 64,7% 10,1% 13,9% 5,1% 15,6% 7,7% 7,1%
Adjusted EBITDA Margin
Note: Values do not include Pro-Forma
40,6% 16,3% 43,1%
FY/07A FY/08A
R$Million Var.%
Tempo
Health Dental Assistance Tempo Health Dental Assistance Tempo
321,3 21,6 229,9 572,8 429,5 56,7 245,8 731,9 27,8%
Net Revenues
257,9 11,4 124,4 393,7 334,9 27,6 146,4 508,8 29,3%
Cost of Rendered Services
22,5 5,7 26,8 55,0 26,8 10,7 28,4 65,9 19,7%
Adjusted EBITDA
7,0% 26,4% 11,7% 9,6% 6,2% 18,9% 11,6% 9,0% -0,6 p.p.
Adjusted EBITDA Margin
Note: Values do not include Pro-Forma
HEALTH SEGMENT
-54,4%
4Q07A 4Q08A FY07A FY08A
R$Million Var.% Var.%
Beneficiaries (in Millions) 1,30 1,38 1,30 1,38
6,2% 6,2%
Net Revenues 102,8 122,6 321,3 429,5
19,3% 33,7%
Cost of Rendered Services 82,2 94,9 257,9 334,9
15,5% 29,9%
Selling, General & Administrative Expenses 6,9 21,4 41,0 67,8
208,5% 65,5%
Adjusted EBITDA 13,7 6,2 22,5 26,8
-54,4% 19,1%
Adjusted EBITDA Margin 13,3% 5,1% 7,0% 6,2% - 0,8 p.p.
- 8,2 p.p.
Note: Cost of rendered services represents medical cost passed through to Tempo’s clients along with HomeCare costs.
Note: Due to the Company´s IPO in 2007, the 4Q07 presented better than usual results. Therefore, 4Q07x4Q08 comparison is negatively
impacted. For a better view of the business a YoY comparison should be considered.
Highlights
» New Clients & Renewal: Gama Saúde continues to be a major player in the TPA services for the public sector. Two new clients
joined Tempo´s Health Segment: Tribunal Superior do Trabalho and Infraero, which are both public entities. Also, Tempo renewed its
contract with SABESP for four more years, through a public bid;
» Beneficiaries: The number of lives increased by 6,2% YoY;
» Net Revenues: Posted a 33,7% YoY increase with strong influence from the HomeCare division.
4
5. Operational Performance
(In Millions)
Beneficiaries - Lives Covered
» In the past 12 months, Gama Saúde experienced a 6,2% growth in number of
lives covered. This growth was fueled by the capture of new clients as well as a
6,2%
modest growth in existing client base.
» These numbers do not include beneficiaries covered under the HomeCare
division. 1,38
33,8% 2006 2007
2004 2005 2008 1,30
CAGR
0,43 0,73 1,06 1,30 1,38
33,8%
4Q07A 4Q08A
1,38
1,30
1,06
0,73
0,43
2004 2005 2006 2007 2008
(In R$Million)
Net Revenues
4Q07 4Q08 FY07 FY08
» In the Health Segment, Renenues are calculated by combining: 1.) Gama Saúde´s HomeCare 0,0 0,0 0,0 0,0
fees for TPA services; 2.) Gama Saúde´s Pass-Through; 3.) Revenues from Gama Saúde 0,0 19,3%0,0 0,0 0,0
HomeCare service.
122,6
» Net Revenues presented a strong growth of 33,7% YoY and a 19,3% growth
QoQ. The Health Segment showed consistent client retention and also a 102,8
conservative growth in its client base. The consolidation of HomeCare division has
also been a strong driver for the Health Segment in 2008 by contributing 16,4% of
the top-line growth. 4Q07 4Q08
33,7%
29,2%
CAGR
429,5
429,5
321,3
321,3
262,8
214,5
154,2
2004 2005 2006 2007 2008
2004 154,2 2005 214,5 262,8
2007 321,3 2008 429,5 FY07 FY08
2006
29,2%
Adjustments to Net Revenues (in R$Millions) 4T08 FY/08
Reported Net Revenues 117,0 423,9
NPV Adjustments* - 3,0
Retroactive Taxes Adjustment (5,0) 2,6
Adjusted Net Revenues 122,6 429,5
* Ajustments made reflecting Law 6,404/76, as amended by Law 11,638/07 and Executive Decree 449/08
5
6. Operational Performance
Cost of Rendered Services (In R$Million)
» Cost of Rendered Services include Pass-Through costs incurred in Gama Saúde´s PPO network and costs associated with
the HomeCare business. However, these costs incurred by Gama Saúde’s network of service providers cannot be
considered loss ratio (MLR) as the Company underwrites no medical risk. Fees are charged based on fixed price per life,
regardless of cost variances in medical expenses (which are passed on to clients).
» Overall, when comparing YoY, it should be noted that Tempo´s HomeCare unit was only acquired and running jointly
with the business segment starting October 2007.
15,5%
29,9%
94,9
334,9
82,2 257,9
FY07A FY08A
4Q07A 4Q08A
Adjustments to Costs of Rendered Services (R$Million) 4Q08 FY/08
Reported Costs of Rendered Services 92,7 332,7
NPV Ajustments to Costs of Rendered Services* 2,3 2,3
Adjusted Costs of Rendered Services 94,9 334,9
* Ajustments made reflecting Law 6,404/76, as amended by Law 11,638/07 and Executive Decree 449/08
Selling, General & Administrative Expenses (In R$Million)
15,8%
» Gama Saúde accumulated SG&A expenses of R$ 21,4Million for the
12,8%
4Q08 and a R$ 67,8Million for teh year. Due to a different business
model, the HomeCare division contributed with a higher SG&A ratio than
9,0%
Gama Saúde.
17,5%
SG&A Adjustments (in R$Million) 4Q08 FY/08
67,8
Reported SG&A 25,1 69,2
41,0
Integration & IPO Expenses - (0,9)
Shared Structure 5,0 8,1
Other Operating Results (8,7) (8,6)
FY07A FY08A
Adjusted SG&A 21,4 67,8
Margin (%)
17,5%
12,8% 9,0%
15,8%
21,4
6,9
4Q07A 4Q08A
Margin (%)
6
7. Operational Performance
Adjusted EBITDA (In R$Million)
» The adjusted EBITDA for the fiscal year of 2008 had a strong growth of
13,3%
19,1% YoY. However, on a QoQ analysis the Health segment showed a
5,1%
significant decline, mostly due to 4Q07 results that accumulate results from
other 2007 quarters (as per accrual accounting rules). The HomeCare
-54,4%
division sparked a new momentum for the segment, later complemented by
the acquisition of Staff Builders, which contributed to a strong YoY EBITDA
growth.
13,7
6,2
4Q07A 4Q08A
Adjusted EBITDA Margin
7,0%
6,2%
52,1%
CAGR
19,1%
26,8
22,5 26,8
22,5
8,9
7,3
5,0
FY07A FY08A
2004 2004 2005 2005 2006 2007 2007 20082008
2006
Adjusted EBITDA Margin
5,0 7,3 8,9 22,5 26,8
52,1%
7
8. Operational Performance
Reconciliation Between Net Profit & EBITDA
» The table below reconciles net earnings and EBITDA:
HEALTH SEGMENT 1T08 2T08 3T08 4T08 2008
Gross Revenues 98,6 101,8 114,9 122,7 437,9
Deductions (2,7) (2,8) (2,9) (5,6) (14,0)
Net Revenues 95,9 99,0 112,0 117,0 423,9
Costs of Rendered Services (73,5) (77,3) (89,2) (92,7) (332,7)
Net Profit 22,4 21,7 22,8 24,3 91,3
SG&A (13,9) (14,1) (16,1) (25,1) (69,2)
Depreciation & Amortization (1,6) (1,8) (0,6) 1,1 (3,0)
Financial Result (0,4) (0,2) (0,1) 0,2 (0,5)
Other Operating Results 0,0 (0,0) 0,1 (8,7) (8,6)
(17,5)
Income Tax & Social Contribution Expenses (2,8) (2,1) (3,7) (8,8)
(30,0)
Impairment - - - (30,0)
Net Income (Loss) 3,7 3,5 2,4 (47,1) (37,5)
Equity Income - - 1,4 4,3 5,7
Net Income (Loss) with Equity Income 3,7 3,5 3,8 (42,8) (31,8)
EBITDA
Net Income (Loss) with Equity Income 3,7 3,5 3,8 (42,8) (31,8)
Income Tax & Social Contribution Expenses 2,8 2,1 3,7 8,8 17,5
Other Operating Results (0,0) 0,0 (0,1) 8,7 8,6
Financial Result 0,4 0,2 0,1 (0,2) 0,5
Depreciation & Amortization 1,6 1,8 0,6 (1,1) 3,0
Equity Income - - (1,4) (4,3) (5,7)
- - - 30,0
Impairment 30,0
EBITDA 8,5 7,6 6,7 (0,8) 22,1
Non-Reoccuring Costs (1,9) 0,3 (0,7) 7,0 4,7
0,2 0,3 0,4 - 0,9
Integration & IPO Costs
(2,1) - (1,0) (5,0) (8,1)
Shared Structure Adjustments
- - - 3,0 3,0
PVA Ajustments to Gross Revenues
- - - (2,3) (2,3)
PVA Ajustments to Costs of Rendered Services
(0,0) 0,0 (0,1) 8,7 8,6
Other Non Operating Results
- - - 2,6 2,6
Tax Adjustments
Adjusted EBITDA 6,6 8,0 6,0 6,2 26,8
8
9. Operational Performance
NOTE: In order to better present Tempo's operation in the Dental Segment, all figures in this section consolidates the acquisitions
made in 2008 since its acquisition dates rather than its ANS approval, when applicable. The table below indicates the reconciliation
between the Dental Segment reported results and Pro-Forma results.
Summary of Adjustments:
1. Fleming: 5 months Pro Forma in 2008 (Acquired in 05/2008 and approved by ANS in 10/2008);
2. OralTech: 4 months Pro Forma in 2008 (Acquired in 11/2007 and approved by ANS in 05/2008);
3. Prevdonto: 3 months Pro Forma in 2008 (Acquired in 06/2008 and approved by ANS in 10/2008);
4. Odonto Empresa: 3 months Pro Forma in 2008 (Acquired in 11/2007 and approved by ANS in 04/2008);
5. Presdental: 3 months Pro Forma in 2008 (Acquired in 09/2008 and pending ANS approval).
Reported Numbers Pro-Forma FY08
Dental Pro-Forma (R$MM) FY07 VAR (%)
in 2008 Adjustments Pro-Forma
284,9%
Net Revenue 83,1 21,6
56,7 26,4
242,8%
39,1 11,4
Cost of Rendered Services 27,6 11,5
-7,1 p.p.
44,2% 51,3%
Loss Ratio (%) 46,4% 41,7%
531,3%
28,4 4,5
Administrative Expenses 18,4 10,0
174,4%
Adjusted EBITDA 15,6 5,7
10,7 4,9
18,8% 26,4% -7,6 p.p.
Adjusted Margem EBITDA 18,9% 18,7%
Note: Due to the Company´s IPO in 2007, the 4Q07 presented better than usual results. Therefore, 4Q07x4Q08 comparison is negatively
impacted. For a better view of the business a YoY comparison should be considered.
Beneficiaries (In Millions)
» At the end of 2008, our Dental Segment had a strong growth of 75,4%
over the same period in 2007, surpassing 833 thousand lives. Dental
75,4%
Segment´s strongest growth came from Affinity channels, which also had a
positive influence on the overall loss ratio. The combination of efficient
acquisitions and solid organic growth boosted Tempo´s revenues, placing
Tempo among the leading Dental players in Brazil. 0,83
0,48
» In the midst of acquisitions and integration, the Dental Segment had a
solid organic growth of 32% in 2008.
4Q07A 4Q08A - Pro Forma
Profile of the Growth - Dental Segment
Growth Breakdown - Dental Segment
58%
42%
43%
32%
Growth Through Acquisitions Organic Growth
Acquisitions 2008 Organic Growth
9
10. Operational Performance
4Q08A - Pro FY08A - Pro
4Q07A Var.% FY07A Var.%
R$Million
Forma Forma
Beneficiaries (in Millions) 0,48 0,83 75,4% 0,48 0,83 75,4%
Net Revenues 5,6 25,8 362,7% 21,6 83,1 284,9%
Cost of Rendered Services 3,1 13,8 348,8% 11,4 39,1 242,8%
Loss Ratio (MLR %) 53,3% 51,2% -2,1p.p. 51,3% 44,2% -7,1p.p.
SG&A 0,7 8,6 1146,7% 4,5 28,4 531,3%
1,8 3,4 85,7% 5,7 15,6 174,4%
Adjusted EBITDA
Adjusted Margem EBITDA 32,4% 13,0% -19,4 p.p. 26,4% 18,8% -7,6 p.p.
12,4% 33,5% 20,8% 34,2%
Net Revenues (In R$Million)
» At the end of 4Q08, Net Revenues reached R$ 25,4 Million representing a
355,3% growth from the same period in 2007. Year on Year, this growth was
362,7%
expressed at 287,2% reaching R$ 83,6 Million for the fiscal year of 2008. This
growth was influenced by strong M&A activity and solid organic growth in number
25,8
of lives.
5,6
53,2%
CAGR 4Q07A 4Q08A - Pro Forma
### 2005 2006 2007 2008 Pro Forma
284,9%
15 18,1 20,5 21,4 83,1
83,1
###
83,1
21,4
20,5
18,1
15,1 21,6
FY07A FY08A - Pro Forma
2004 2005 2006 2007 2008 Pro
Forma
Adjustmentes to Net Revenues (R$Million) 4Q08 2008
Reported Net Revenues 21,9 53,9
NPV Ajustments* 0,8 0,8
Retroactive Tax Adjustments 2,0 2,0
Pro Forma Adjustments 1,0 26,4
Adjusted Net Revenues 25,8 83,1
* Adjustments made reflecting Law 6,404/76, as amended by Law 11,638/07 and Executive Decree 449/08
10
11. Operational Performance
Margin (%)
Costs of Services Rendered (In R$Million)
» Although the Dental segment went through a challenging year of acquisitions and integration, its Loss Ratio (MLR) showed
significant improvement QoQ and YoY with 6.0 p.p. and 4.9 p.p. decrease, respectively. A strong contributor was the Affinity
channels. The Dental segment now counts with seven strong Affinity partnerships such as: Ampla (Energy distributor in Rio de
Janeiro), Citi Credicard, Brasil Telecom (a major Brazilian telecommunications company) and Fininvest (Unibanco’s credit card
company). 51,3%
53,3% 44,2%
47,3%
13,8 39,1
Loss Ratio (%)
11,4
4Q07 4Q08 FY07 FY08
3,1
53,3% 47,3% 51,3% 44,2%
FY07A FY08A - Pro Forma
4Q07A 4Q08A - Pro Forma
Loss Ratio (%) Loss Ratio (%)
Adjustments to Costs of Services Rendered (R$Millions) 4Q08 FY/08
Reported Cost of Services Rendered 12,2 27,6
NPV Ajustments* 0,0 0,0
Pro Forma Adjustments 1,6 11,5
Adjusted Cost of Services Rendered 13,8 39,1
* Ajustments made reflecting Law 6,404/76, as amended by Law 11,638/07 and Executive Decree 449/08
Selling, General & Administrative Expenses (In R$Million)
» M&A and organic growth in Dental during 2008 were fueled by SME and Affinity accounts, which carry significantly lower broker´s
commissions. Additionally, key infrastructure investments were made to support the integration.
34,2%
33,5%
20,8%
12,4%
8,6 28,4
4,5
0,7
FY07A FY08A - Pro Forma
4Q07A 4Q08A - Pro Forma
Margin (%)
Margin (%)
Adjustments to SG&A (in R$Millions) 4Q08 FY/08
Reported SG&A 10,0 19,7
Non-Operating Results 0,4 0,4
Shared Structure (1,7) (1,7)
Pro Forma Adjustments 0,0 10,0
Adjusted SG&A 8,6 28,4
11
12. (In R$Million)
Adjusted EBITDA
32,4%
» EBITDA for the Dental Segment showed strong growth. On a QoQ 13,0%
comparison, EBITDA grew by 179,5% and reached R$ 5,0 Million. When 85,7%
comparing YoY, the company achieved an Adjusted EBITDA of R$18,3
Million, a 221,8% growth.Adjusted EBITDA Margin showed a slight
downturn, mainly due the strong M&A activities in the segment.
3,4
1,8
» Several factors positively impacted the result of the Segment, such as
Affinity channels and the reputable client base that came with the
acquisitions (noticeable in the case of Fleming and Prevdonto).
4Q07A 4Q08A - Pro
Forma
Adjusted Margem EBITDA
2004 2005 2006 2007 2008 Pro Forma
26,4%
2,4 3,7 4,760% 5,7 15,6 18,8%
60% CAGR
174,4%
15,6
15,6
5,7 5,7
4,7
3,7
2,4
FY07A FY08A - Pro Forma
2004 2005 2006 2007 2008 Pro
Forma
Adjusted Margem EBITDA
12
13. Operational Performance
Reconciliation Between Net Profit & EBITDA
» The table below reconciles net earnings and EBITDA:
ODONTO 1T08 2T08 3T08 4T08 2008
Gross Revenues 5,6 11,7 16,2 25,1 58,5
Deductions (0,2) (0,5) (0,8) (3,2) (4,7)
Net Revenues 5,4 11,2 15,4 21,9 53,9
Costs of Rendered Services (2,6) (5,8) (6,9) (12,2) (27,5)
Net Profit 2,7 5,4 8,5 9,7 26,3
SG&A (1,7) (3,4) (6,3) (10,0) (21,4)
(9,3)
Depreciation & Amortization (1,7) (3,3) (4,6) 0,3
Financial Result 0,1 0,9 1,2 0,7 2,8
0,4
Non Operating Results (0,1) (0,0) 0,1 0,4
Income Tax & Social Contribution Expenses (0,2) (0,5) (2,0) (6,2) (8,9)
(92,0)
Impairment - - - (92,0)
Net Income (Loss) (0,9) (0,9) (3,1) (97,1) (102,0)
(2,5)
Equity Income (0,4) (0,1) 1,0 (3,0)
(104,5)
Net Income (Loss) with Equity Income (1,2) (1,0) (2,1) (100,1)
EBITDA
Net Income (Loss) with Equity Income (1,2) (1,0) (2,1) (100,1) (104,5)
Income Tax & Social Contribution Expenses 0,2 0,5 2,0 6,2 8,9
Non Operating Results 0,1 0,0 (0,1) (0,4) (0,4)
Financial Result (0,1) (0,9) (1,2) (0,7) (2,8)
Depreciation & Amortization 1,7 3,3 4,6 (0,3) 9,3
Equity Income 0,4 0,1 (1,0) 3,0 2,5
Baixa por Impairment - - - 92,0 92,0
EBITDA 1,0 2,0 2,2 (0,3) 5,0
Non-Reoccuring Costs 0,3 0,5 0,9 4,1 5,7
0,1 - - - 0,1
Integration & IPO Costs
0,1 - - - 0,1
Aquisition Costs
- - - 0,8 0,8
NPVA - Gross Revenues
- - - (0,0) (0,0)
NPVA - Cost of Rendered Services
(0,2) 0,5 0,7 - 1,0
Technical Provisions
0,2 - 0,3 1,7 2,2
Shared Structure Adjustments
- - - 2,0 2,0
Taxes adjustments
0,1 0,0 (0,1) (0,4) (0,4)
Adjusted EBITDA
Adjusted EBITDA 1,3 2,6 3,0 3,9 10,7
13
14. Operational Performance
4Q07A 4Q08A Var.% FY07A FY08A Var.%
R$Million
20,9 20,9
Items (in Millions) 17,3 20,9% 17,3 20,9%
Adjusted Net Revenues 59,9 65,7 9,6% 229,9 245,8 6,9%
Adjusted Cost of Rendered Services 34,0 42,1 23,8% 124,4 146,4 17,6%
Loss Ratio (%) 50,4% 58,2% 7,8 p.p. 48,4% 53,5% 5,1 p.p.
Adjusted SG&A 23,2 18,5 -20,0% 90,6 71,0 -21,6%
6,1 5,0 -17,0% 26,8 28,4 5,8%
Adjusted EBITDA
Adjusted EBITDA Margin 10,1% 7,7% -2,5 p.p. 11,7% 11,6% -0,1 p.p.
38,7% 28,2% 39,4% 28,9%
Highlights
» New Clients & Renewals: Tempo had a relevant contract renewal with Tokio Marine for additional seven years. Moreover, two new
clients joined our base: Marítima and Confiança;
» Items: Number of Itens covered increase 20.9% YoY to 20.9 Million;
» Adjusted Net Revenues: QoQ had a solid performance with 9.6% growth and a moderate growth of 6.9% for YoY.
Items (In Million)
» At the end of 2008, the number of covered items in the Assistance
Segment amounted to 20.9 Million, representing a 20.9% growth over 20,9%
the same period in 2007.
20,9
9,6%
17,3
CAGR
4Q07A 4Q08A
20,9
2004 2005 2006 2007 2008
17,3
16,8 16,0
14,5 16,8 16,0 17,3 20,9
14,5
9,6%
2004 2005 2006 2007 2008
14
15. Operational Performance
Net Revenues (In R$Million)
» The Assistance Segment had a solid growth of 9.6% QoQ amouting
9,6%
R$65.7 Million. In 2008, Net Revenues grew by 6.9% to R$245.8
Million. Part of the growth is attributed to new clients such as Marítima
and Confiança.
65,7
59,9
13,0%
CAGR
2004 2005 2006 2007 2008
151,0 178,7 206,8 229,9 245,8 4Q07A 4Q08A
13,0%
6,9%
245,8
229,9
206,8
178,7
151,0 245,8
229,9
FY07A FY08A
2004 2005 2006 2007 2008
Adjustments to Net Revenues (R$Million) 4Q08 FY/08
Reported Net Revenues 58,1 238,2
NPV Ajustments* 1,8 1,8
CDN Adjustments** 6,5 6,5
Retroactive Tax Adjustments (0,7) (0,7)
Adjusted Net Revenues 65,7 245,8
* Ajustments made reflecting Law 6,404/76, as amended by Law 11,638/07 and Executive Decree 449/08
** Consists of costs incurred in USS as a result of services rendered to Consórcio Dia e Noite (Bradesco), which are eliminated in its
consolidated financials (in revenues and SG&A, thus not impacting the company’s results).
Costs of Services Rendered (In R$Million)
» Following the trend of 2008, Cost of Rendered Services rose by R$8.1 Million QoQ and R$22 Million YoY, partially due
to increasing frequency. In 2008, additionally, USS also offered services of greater complexity which contributed to a
higher Loss Ratio.
23,8%
17,6%
42,1 146,4
124,4
34,0
FY07A FY08A
4Q07A 4Q08A
15
16. Operational Performance
Adjustments to Costs of Rendered Services (R$Million) 4Q08 FY/08
Reported Costs of Rendered Services 43,9 148,2
NPV Ajustments to Costs of Rendered Services* 1,6 1,6
Provisions for Termination of Bradesco´s Contract (3,4) (3,4)
Adjusted Costs of Rendered Services 42,1 146,4
* Ajustments made reflecting Law 6,404/76, as amended by Law 11,638/07 and Executive Decree 449/08
Assistance Segment - Loss Ratio (%)
58,2%
1Q07 2Q07 3Q07 4Q07 1st Qtr 2nd Qtr 3rd Qtr 4th Qtr
53,5%
52,1%
49,7% 45,9%
50,4% 47,1% 50,4% 52,1% 49,7% 53,5% 58,2%
50,4% 50,4%
47,1% 45,9%
1st Qtr 2nd Qtr 3rd Qtr 4th Qtr
2007 2008
Selling, General & Administrative Expenses (In R$Million)
» In 4Q08, USS continued to show significant decrease in SG&A of 20% and the YoY also showed a strong reduction of 22.6%
reduction, proving that USS is benefiting from economies of scale and synergies in shared structure.
39,4%
38,7%
28,9%
28,2%
-20,0%
-21,6%
90,6
23,2
18,5 71,0
4Q07A 4Q08A FY07A FY08A
Série1
Série1
Adjustments to SG&A (R$Million) 4Q08 FY/08
Reported SG&A 13,5 69,3
Other Operating Results 1,8 1,8
CDN Adjustments** (3,3) (6,6)
Non-Recurring Expenses 6,5 6,5
Adjusted SG&A 18,5 71,0
** Consists of costs incurred in USS as a result of services rendered to Consórcio Dia e Noite (Bradesco), which are
eliminated in its consolidated financials (in revenues and SG&A, thus not impacting the company’s results).
16
17. Operational Performance
EBITDA (In R$Million)
10,1%
» Adjusted EBITDA for the Assistance Segment for the 4Q08 was R$5.0
7,7%
Million. For the year, however, Adjusted EBITDA grew by 5.8% YoY
reaching a total of R$28.4 Million. -17,0%
» Overall, the Assistance Segment has been able to keep a consistent
growth along the years, showing a CAGR of 44.0%.
6,1
5,0
4Q07A 4Q08A
2004 2005 2006 44,0%2007 2008
Adjusted EBITDA Margin
6,6 19,2 24,0 CAGR 26,8 28,4
44,0% 11,7% 11,6%
5,8%
28,4
26,8
24,0
28,4
19,2 26,8
6,6
FY07A FY08A
2004 2005 2006 2007 2008
Adjusted EBITDA Margin
17
18. Operational Performance
Reconciliation Between Net Profit & EBITDA
» The table below reconciles net earnings and EBITDA:
ASSISTANCE SEGMENT 1T08 2T08 3T08 4T08 2008
265,2
Gross Revenues 66,3 65,5 69,4 64,1
271,8
66,3 65,5 69,4 70,7
Gross Revenues with CDN Adjustaments
(27,0)
Deductions (7,4) (6,6) (7,0) (6,0)
238,2
Net Revenues 58,8 58,8 62,4 58,1
244,7
58,8 58,8 62,4 64,7
Net Revenues with CDN Adjustaments
(148,2)
Costs of Rendered Services (34,5) (32,6) (37,1) (43,9)
90,0
Net Profit 24,3 26,3 25,3 14,2
SG&A (21,0) (17,8) (16,9) (13,5) (69,3)
(21,0) (17,8) (16,9) (20,1) (75,8)
SG&A with CDN Adjustaments
1,8
Other Operating Results - - 0,0 1,8
Depreciation & Amortization (0,5) (0,5) (1,1) (1,8) (3,9)
Financial Result 0,1 0,4 0,0 1,2 1,7
(7,6)
Income Tax & Social Contribution Expenses (1,0) (2,2) (3,0) (1,4)
Net Income (Loss) 1,9 6,1 4,4 0,5 12,9
(0,0)
Equity Income - - - (0,0)
Net Income (Loss) with Equity Income 1,9 6,1 4,4 0,5 12,9
EBITDA
Net Income (Loss) 1,9 6,1 4,4 0,5 12,9
Income Tax & Social Contribution Expenses 1,0 2,2 3,0 1,4 7,6
Financial Result (0,1) (0,4) (0,0) (1,2) (1,7)
Depreciation & Amortization 0,5 0,5 1,1 1,8 3,9
Equity Income - - - 0,0 0,0
Other Operating Results - - (0,0) (1,8) (1,8)
EBITDA 3,3 8,4 8,4 0,6 20,8
- - - - -
Non-Reoccuring Costs 2,3 0,1 0,9 4,4 7,6
Integration & IPO Costs 0,2 0,1 0,1 - 0,3
Aquisition Costs 0,4 0,0 - - 0,4
PVA Ajustments to Gross Revenues - - - 1,8 1,8
PVA Ajustments to Costs of Rendered Services - - - (1,6) (1,6)
Provisions for Termination of Bradesco´s Contract - - - 3,4 3,4
Shared Structure Adjustments 1,7 - 0,8 3,3 5,9
Other Non Operating Results - - (0,0) (1,8) (1,8)
- - - (0,7)
Tax Adjustments (0,7)
Adjusted EBITDA 5,5 8,5 9,4 5,0 28,4
18
19. Operational Performance
CAPEX - Investments
» Maintaining its Asset Light model, Tempo ended the year OF 2008 with CAPEX at R$7,9MM representing 11% of Adjusted EBITDA. For
4Q08, only R$ 530k was CAPEX.
Capex (R$ Million) FY/08
3,2
Software
2,4
IT Equipment
0,1
Buildings
0,2
Furniture & Equipment
1,9
Others
Total 7,9
» The graph below demonstrates CAPEX x EBITDA relationship at Tempo´s asset light model:
90 14,0%
12,0%
80 12,0%
10,6%
70 2005 2006 2007 2008
9,3%
10,0%
EBITDA8,3%
60 30,2 37,6 55,0 65,9
8,0%
CAPEX 2,5 4,0 5,1 7,9
50 EBITDA
% of EBITDA 8,3% 10,6% 9,3% 12,0%
40 CAPEX
6,0%
65,9
30 % of EBITDA
55,0 4,0%
20 37,6
30,2 7,9 2,0%
5,1
4,0
10 2,5
0 0,0%
2005 2006 2007 2008
Cash Position & Debt
» The company ended 4Q08 with a cash position at R$ 237 million. During 4Q08, Tempo had its first Stock Buyback Program that started
on October 20th, 2008, and ended on November 27th, 2008. The buyback was for up to 10% of the Free Float at that time. During this
period, Tempo invested R$ 22.2MM, purchasing 8.168.500 TEMP3 shares, which were cancelled following the termination of the
program.
19
20. Operational Performance
II - INCOME STATEMENT – Health Segment (in R$ thousands)
Health Segment R$k
Gross Revenue
70.088
Healthcare administration service expenses
279.428
Reimbursement of healthcare administration pass through expenses
88.409
Revenue from home and chronic assistance services
437.925
(13.996)
Deductions from gross service revenue
423.929
Net Service Revenue
(278.106)
Pass Through
(54.558)
Cost of home and chronic assitance services
91.265
Gross Profit
(69.208)
Selling, general and administrative
(2.978)
Depreciation and amortization
(3.275)
Goodwill Amortization
5.717
Equity Result
(488)
Financial result
(8.602)
Non-operating result
(30.034)
Impairment Deductions
(14.189)
Income and Social Contribution taxes
(31.792)
Net Income (Loss)
20
21. Operational Performance
III - INCOME STATEMENT – Dental Segment (in R$ thousands)
R$k
Dental Segment
Gross Revenue
58.539
Dental effective premiums
(109)
Changes in risk provisions
58.430
(4.682)
Deductions from gross service revenue
53.747
Net Service Revenue
(26.614)
Dental benefit plan indeifiable events
Changes in the provision for dental benefit (807)
plan claims incurred but not reported - PEONA
26.326
Gross Profit
(21.367)
Selling, general and administrative
(828)
Drepreciation and amortization
(8.476)
Goodwill Amortization
2.836
Financial result
(2.521)
Equity Income
Equity Result
432
Non-operating result
(8.902)
Income and Social Contribution taxes
(92.002)
Impairment Deductions
(104.500)
Net Income (loss)
21
22. Operational Performance
IV- INCOME STATEMENT – Assistance Segment (in R$ thousands)
Assistance Segment R$k
Gross Service Revenue
Assistance Services 259.009
Reinbursement of Assistance Services Expenses 6.233
265.242
Deductions from Gross Service Revenue (27.034)
238.208
Net Services Revenue
Assistance Service Expenses (148.173)
90.034
Gross Profit
Selling, general and Administrative Expenses (69.276)
Depreciation and Amortization (3.881)
Other Operational Revenues 1.830
Financial Result 1.735
Non operating Result -
Tax Benefit Amortization (8.706)
Defered Income and Social Contribution Taxes 1.138
Net Income (Loss) 12.875
22