1. 571216- BUSINESS RESEARCH METHODS
Research is finding out what you don't already know. No one knows everything, but
everybody knows something. However, to complicate matters, often what you know, or
think you know, is incorrect.
There are two basic purposes for research: to learn something, or to gather evidence. The
first, to learn something, is for your own benefit. It is almost impossible for a human to
stop learning. It may be the theory of relativity or the RBIs of your favorite ball player,
but you continue to learn. Research is organized learning, looking for specific things to
add to your store of knowledge. You may read SCIENTIFIC AMERICAN for the latest
research in quantum mechanics, or the sports section for last night's game results. Either
is research.
What you've learned is the source of the background information you use to communicate
with others. In any conversation you talk about the things you know, the things you've
learned. If you know nothing about the subject under discussion, you can n either
contribute nor understand it. (This fact does not, however, stop many people from joining
in on conversations, anyway.) When you write or speak formally, you share what you've
learned with others, backed with evidence to show that what you've lear ned is correct. If,
however, you haven't learned more than your audience already knows, there is nothing
for you to share. Thus you do research.
THREE TYPES OF RESEARCH
There are three types of research, pure, original, and secondary. Each type has the goal of
finding information and/or understanding something. The difference comes in the
strategy employed in achieving the objective.
Pure Research
Pure research is research done simply to find out something by examining anything. For
instance, in some pure scientific research scientists discover what properties various
materials possess. It is not for the sake of applying those properties to a nything in
particular, but simply to find out what properties there are. Pure mathematics is for the
sake of seeing what happens, not to solve a problem.
The fun of pure research is that you are not looking for anything in particular. Instead,
anything and everything you find may be joined with anything else just to see where that
combination would lead, if anywhere.
Let's take an example. I was reading a variety of books and magazines once. There were a
some science fiction novels, Jean Auel's THE CLAN OF THE CAVE BEAR, Carl
Sagan's BROCA'S BRAIN, several Isaac Asimov collections of science essays and two
of h is history books, ADVERTISING AGE and AD WEEK magazines, some programs
on PBS, a couple of advertising textbooks I was examining for adoption in my class, and
2. several other things I can't even remember now. This was pure research; I was reading
and watch ing television for the sake of reading and watching about things I didn't know.
Relating all of the disparate facts and opinions in all of these sources led me to my
opinions on stereotyping and pigeonholing as vital components of human thought, now a
major element in my media criticism and advertising psychology classes. When I started I
had no idea this pure research would lead where it did. I was just having fun.
Original Research
Original, or primary research is looking for information that nobody else has found.
Observing people's response to advertising, how prison sentences influence crime rates,
doing tests, observations, experiments, etc., are to discover something new.
Orginal research requires two things: 1) knowing what has already been discovered,
having a background on the subject; and 2) formulating a method to find out what you
want to know. To accomplish the first you indulge in secondary research (see bel ow).
For the second, you decide how best to find the information you need to arrive at a
conclusion. This method may be using focus groups, interviews, observations,
expeditions, experiments, surveys, etc.
For example, you can decide to find out what the governmental system of the Hittite
Empire was like on the basis of their communication system to determine how closely the
empire could be governed by a central bureaucracy. The method to do this orgi nal
research would probably require that you travel to the Middle East and examine such
things as roads, systems of writing, courier systems without horses, archeological
evidence, actual extent of Hittite influence (commercial, military, laws, language,
religion, etc.) and anything else you can think of and find any evidence for.
Secondary Research
Secondary research is finding out what others have discovered through original research
and trying to reconcile conflicting viewpoints or conclusions, find new relationships
between normally non-related research, and arrive at your own conclusion bas ed on
others' work. This is, of course, the usual course for college students.
An example from recent years was the relating of tectonic, geologic, biologic,
paleontologic, and astronomic research to each other. Relating facts from these
researches led to the conclusion that the mass extinctions of 65 million years ago,includi
ng the dinosaurs, was the result of an asteroid or comet striking the earth in the North
Atlantic at the site of Iceland. (For a full explanation see THE GREAT EXTINCTION by
Michael Allaby and James Lovelock.) Later research based on the above has found a
potential crater for the impact on the Yucatan Peninsula.
3. Secondary research should not be belittled simply because it is not original research.
Fresh insights and viewpoints, based on a wide variety of facts gleaned from original
research in many areas, has often been a source of new ideas. Even more, it has provided
a clearer understanding of what the evidence means without the influence of the original
researcher's prejudices and preconceptions.
DIRECTED AND NONDIRECTED RESEARCH
Research can be directed or non-directed. Non-directed research is finding out things for
the sheer fun of finding them out. Reading a newspaper or the entire Encyclopedia
Britannica, or asking several people how they feel about something is non-di rected
research. It has no specific purpose beyond increasing your store of knowledge about the
world (or everything in general). Watching television is non-directed research, as is
reading a magazine, science fiction, mysteries, historical fiction, or anything else.
Everything you don't think of yourself contains information you don't have, and is thus
research.
Directed research, on the other hand, is done with a specific purpose in mind. The
purpose could be to make a point, write a paper or speech, or simply know more about a
specific thing. It is directed since it deals with something specific, and som eone decides
what to try next. It simply doesn't have a specific outcome in mind. For example, directed
research in microelectronics is not trying to achieve a specific goal. It does, however,
deal specifically with microelectronics, be it the conducting properties of alloys and
compounds, electron etching, or dual bonding. It does not concern itself with
anthropology. There is also a researcher or project director who decides what is worth
pursuing and what is not.
Directed research is what you want to do when you are preparing a report. You have a
specific goal in mind, to communicate what you want your audience to know about your
topic. Thus, you direct your research toward finding what you can about your topic, not
to find out what there is to know about whatever you come across.
#
Research, pure, original or secondary, carries with it an inherent danger to those who are
close-minded or comfortable in their preconceptions and prejudices. In case you're
wondering, that includes everybody. However, there are people who, having arrived at a
conclusion by whatever means, reject anything that contradicts, or at least doesn't
support, their preconceptions and prejudices. Research has at its essence the shakeup of
what you already know (if you already know it, it isn't research, it 's self-congratulation
for perspicacity). Let's take a look at how this works.
Research may show that what you already know isn't correct. This is a hard thing for
many people to accept. You will, on occasion, come across a piece of evidence that
contradicts your a priori assumptions (those that you hold as self-evident, some thing is
simply because it is), and that is at best disconcerting and at worst traumatic. For
4. example, you may hold an a priori assumption "all men are created equal". You may then
find an article that states "it is a basic fact of life that all men are inherently unequal"
(people raised in the caste system in India would find that statement so true it wouldn't
need to be said). Which statement is correct? Think about it for a moment.
. . .
If you've actually thought about it, you should have come to the conclusion that both
statements, "all men are created equal," and "all men are unequal," are correct. They are
also both incorrect. They are also both meaningless noises as evidence. They are, by
nature, unprovable and thus not evidence.
What is evidence in this case? Your first step must lie in defining your terms.
What are "men"? Do you mean the male sex of the human species? Do you mean human
beings in general: male, female, regardless of age, race, economic or social position, all
socio-economic systems and governments?
What do you mean by "all"? All "men" (whatever that means) that are like you? That are
not like you? That are like anything at all? The word "all" connotes "without limit". You
put no limits on what are "men"? Are women "men"? Are children, whatever sex, "men"?
Are you discussing sociology, biology, politics, historicity, economics? In what context?
Are you discussing war, voting, pay rates, restrooms?
What do you mean by "created"? Born through biological processes? Through
technological procedures (test tube babies, cloning, genetic engineering)? By some
supernatural intervention with universal entropy? By government decree?
What do you mean by "equal"? Under the law? Under the sun? Under the divinity of your
choice? Equal to what? You? Others?
If you find these questions confusing, good. You're thinking about them.
If you find these questions irritating and/or ridiculous ("everyone know what "All men
are created equal" means!"), then you're being close-minded and will limit your research
to only what agrees with your own prejudices and will discount or totally ignore anything
that contradicts your own narrow ideas. (If you find the above sentence insulting, you
either have an over-developed sense of empathy or you prove my point.)
Let us assume that you define "All men are created equal" as "Every human being,
without exception, is born exactly the same as every other human being" ("all" as in
totality, "men" as human beings, "created" as born, "equal" as in 2 + 2 = 4). Is th at what
you mean by "All men are created equal"? All humans are born physically, biologically,
socially, economically, politically, geographically, intellectually, etc., the same? One
needs only enter a maternity ward to realize that such a case is ridiculous.
5. Let us change the definition slightly. "Every human being, without exception, is
spontaneously invented by God exactly the same as every other human being". The
question becomes, "Which God?" Yahveh, the Christian God, Allah, Zeus, Wodin,
Osiris, etc.? This definition also leaves the above questions intact.
Perhaps the word that needs defining is "equal". "Every human being, without exception,
is born evenly balanced with every other human being." Does this mean that for every
poor human there's a wealthy? For every fat human there's a thin? For eve ry tall human
there's a short? Is any of those what you mean by the phrase?
What has happened to the phrase "All men are created equal" as evidence to prove a point
you wish to make? The answer to this question is, "It's disappeared." The sentiment is
just that, a sentiment. Semantically, it's meaningless. Emotionally, it's extremely
effective. As evidence, it doesn't exist.
#
The research you do is designed to give you the ammunition you need to back up what
you have to say even with those that disagree with you and question what you say. That
ammunition is evidence that your opponent can, or has no choice except to agre e with.
You will, of course, have those that disagree with what you say; nobody agrees with
anybody on everything. Thus, if you make a point, you must back it up with evidence that
even those that disagree must accept. Such evidence must be what is termed o bjective;
that is, evidence that even those that disagree can discover for themselves. For example,
Galileo said that objects, regardless of their weight, fell at the same speed. Aristotle said
that heavy objects fell faster than light objects. Galileo did experiments that demonstrated
his ideas. Those that disagreed with him finally stopped arguing "common sense" and ran
the same experiments -- and demonstrated Galileo's ideas. Such objective evidence could
not be argued away and thus the evidence w as accepted.
The objectives of research
There are 5 general objectives that research - in general and more specifically about
processes - may attempt to achieve. They are
1. description
2. explanation
3. forecasting
4. control
5. modelling
These objectives are not completely independent from each other, for the explanation of a
phenomenon relies in part on its description, its forecast requires a detailed explanation,
and so on. But researchers may concentrate on one or the other aspect. Most important,
the objective pursued will affect the tools and techniques employed for the analyses.
6. The two most frequent objectives are description and explanation. Description is most
often an exploratory phase undertaken using graphical representations and statistical
measures that are not inferential, while explanation involves precise hypotheses to be
confronted and employs inferential statistical tests.
Modelling is the latest, broadest objective It requires that the descriptive and explanatory
phases brought sufficient information and knowledge about the system, so to build a
model that synthetically gathers the various variables in a coherent and parsimonious
way.
Control is an objective rarely set in psychological research (for it brings important ethical
considerations), and forecasting is just a little more frequent. We will not address these
two objectives in this work.
What Are The Characteristics Of The Research You Would Like To Have Funded
There are many transportation research programs, each with distinct focus and
characteristics. To strengthen your chances of success in being funded, this chapter is
intended to help you consider the characteristics of the research statement you would like
to see funded. Research characteristics are important for two reasons: 1) they help you
identify which research programs are the best fit for your research statement, and 2)
clearly addressing these characteristics in your research statement increases your chances
of selection. Important characteristics to consider when writing a research statement
include geographic relevance, transportation mode or topic, funding required, urgency,
type of research needed, and partnership and cost-sharing interests.
GEOGRAPHIC RELEVANCE
How widespread is the problem you are trying to address? Is it experienced in countries
around the world (i.e. intersection design questions or air quality issues)? Is it strictly a
problem in the United States (i.e. how to meet U.S. DOT planning requirements)? Is it
shared by a region or several organizations (i.e. deicing concerns or design in seismic
zones)? Or is it an even more specific problem that exists only in a small number of
locations (i.e. specific species or geology)?
Geographic relevance will affect the programs to which you submit your research
statement, and will also affect the details that need to be included in the statement.
National research programs, such as the National Cooperative Highway Research
Program, focus on research statements that address problems experienced in a majority of
the states. However, a research statement focused on a more localized problem while
explaining how the research product could benefit a national audience can be successful.
TRANSPORTATION MODE OR TOPIC
If your research focuses on a specific mode of transportation, your decision about the
funding source may be simplified, because many research programs focus on such
modes. If, on the other hand, your research need focuses on policy, administration, or
7. other non-modal transportation issues, the appropriate program may be less clear cut. In
this case, contacting potential research program staff may be necessary.
In addition, some research programs fund only certain topics. Some examples include the
Hazardous Materials Cooperative Research Program and the National Cooperative
Freight Research Program.
FUNDING REQUIRED
Research programs vary widely in the maximum amount of money provided for each
project. It is important to understand the funding-level guidelines and limitations of a
research program when considering a research statement submittal. Proposing a $400,000
project to a program that funds projects of $100,000 or less will not get your research
statement funded.
URGENCY
Research programs vary in their time frame for delivery. Finding a research program that
matches the urgency of your research statement is critical. In some programs, it may take
up to 3 years from the submission of a research statement to publish a research report.
Other programs address needs that can be met within 6 months.
TYPE OF RESEARCH NEEDED
The term research is used very broadly in this web page because the work conducted in
the interest of advancing the transportation profession cuts across a number of activities.
A more formal definition and classification of transportation research is provided in
Appendix A. Transportation research can be as fundamental as testing materials for
transportation infrastructure or as detailed as a statistical analysis of large data sets to
identify the public’s response to rising gas prices. Applied research exists somewhere in
the middle of the spectrum, using fundamental research to solve transportation problems.
PARTNERSHIP/OPPORTUNITIES FOR COST SHARING
Some programs require cost sharing or a local match. The selection of your project may
require that your research statement include information on where additional funding is
available. For other research programs, cost sharing may not be required but could
enhance the project’s chances for success.
Hypothesis Vs Theory
Hypothesis is an educated guess. A prediction about the relationship between two
or more variables.
A prediction as to what you expect to find.
Hypotheses are more specific than theories.
Theories have many different hypotheses.
Results of a single research study will not prove or disprove a theory.
8. ◦ If the hypotheses offered by the theory are confirmed, the theory is
supported (not proved).
◦ If lots of studies reveal that many of the hypotheses generated by the
theory are false, the theory must be reevaluated.
What makes a good theory
1. Falsifiability - The theory must make sufficiently precise predictions that we
can at least imagine evidence that would contradict the theory.
Examples: Frustration-aggression theory
Freud’s theory of repression.
Theory of psychic ability
If something is not falsifiable, it doesn’t mean it is wrong, simply that it has no
place in science.
2. Parsimony – simplicity
The best theory is the one that makes the fewest number of assumptions
All things being equal, the simplest theory is the best theory.
Also known as Ockham’s razor
The simplest of two or more competing theories is preferable and the unknown
should first be explained in terms of the known
E.g., theories of intelligence
Theories of UFO’s
Magic acts
Warning: simple theories are not always right.
3. Generativity - A good theory doesn’t just explain results that have been found,
but it also generates predictions that can be tested
Research is promoted by the offering of a good theory.
9. E.g., frustration-aggression – little evidence for the theory initially, but it
generated a lot.
4. Precision – the theory makes precise predictions.
Ambiguity is bad for a theory.
Predictions must have consistency: there cannot be internal contradictions.
5. Good track record – the theory holds up to research results. Studies have tested
the hypotheses and have provided support.
Research Design
Research design can be thought of as the structure of research -- it is the "glue" that holds
all of the elements in a research project together. We often describe a design using a
concise notation that enables us to summarize a complex design structure efficiently.
What are the "elements" that a design includes? They are:
• Observations or Measures
These are symbolized by an 'O' in design notation. An O can refer to a single measure
(e.g., a measure of body weight), a single instrument with multiple items (e.g., a 10-item
self-esteem scale), a complex multi-part instrument (e.g., a survey), or a whole battery of
tests or measures given out on one occasion. If you need to distinguish among specific
measures, you can use subscripts with the O, as in O1, O2, and so on.
• Treatments or Programs
These are symbolized with an 'X' in design notations. The X can refer to a simple
intervention (e.g., a one-time surgical technique) or to a complex hodgepodge program
(e.g., an employment training program). Usually, a no-treatment control or comparison
group has no symbol for the treatment (some researchers use X+ and X- to indicate the
treatment and control respectively). As with observations, you can use subscripts to
distinguish different programs or program variations.
• Groups
Each group in a design is given its own line in the design structure. if the design notation
has three lines, there are three groups in the design.
• Assignment to Group
Assignment to group is designated by a letter at the beginning of each line (i.e., group)
that describes how the group was assigned. The major types of assignment are:
10. • R = random
assignment
• N = nonequivalent
groups
• C = assignment by
cutoff
• Time
Time moves from left to
right. Elements that are
listed on the left occur
before elements that are
listed on the right.
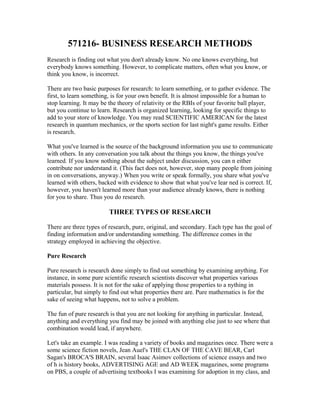
Design Notation
Examples
It's always easier to explain design notation through examples than it is to describe it in
words. The figure shows the design notation for a pretest-posttest (or before-after)
treatment versus comparison group randomized experimental design. Let's go through
each of the parts of the design. There are two lines in the notation, so you should realize
that the study has two groups. There are four Os in the notation, two on each line and two
for each group. When the Os are stacked vertically on top of each other it means they are
collected at the same time. In the notation you can see that we have two Os that are taken
before (i.e., to the left of) any treatment is given -- the pretest -- and two Os taken after
the treatment is given -- the posttest. The R at the beginning of each line signifies that the
two groups are randomly assigned (making it an experimental design). The design is a
treatment versus comparison group one because the top line (treatment group) has an X
while the bottom line (control group) does not. You should be able to see why many of
my students have called this type of notation the "tic-tac-toe" method of design notation
-- there are lots of Xs and Os! Sometimes we have to be more specific in describing the
Os or Xs than just using a single letter. In the second figure, we have the identical
research design with some subscripting of the Os. What does this mean? Because all of
the Os have a subscript of 1, there is some measure or set of measures that is collected for
both groups on both occasions. But the design also has two Os with a subscript of 2, both
taken at the posttest. This means that there was some measure or set of measures that
were collected only at the posttest.
With this simple set of rules for describing a research design in notational form, you can
concisely explain even complex design structures. And, using a notation helps to show
common design sub-structures across different designs that we might not recognize as
easily without the notation.
The Marketing Research Process
11. Once the need for marketing research has been established, most marketing research
projects involve these steps:
1. Define the problem
2. Determine research design
3. Identify data types and sources
4. Design data collection forms and questionnaires
5. Determine sample plan and size
6. Collect the data
7. Analyze and interpret the data
8. Prepare the research report
Research Design
Marketing research can classified in one of three categories:
• Exploratory research
• Descriptive research
• Causal research
These classifications are made according to the objective of the research. In some cases
the research will fall into one of these categories, but in other cases different phases of
the same research project will fall into different categories.
• Exploratory research has the goal of formulating problems more precisely,
clarifying concepts, gathering explanations, gaining insight, eliminating
impractical ideas, and forming hypotheses. Exploratory research can be
performed using a literature search, surveying certain people about their
experiences, focus groups, and case studies. When surveying people, exploratory
research studies would not try to acquire a representative sample, but rather, seek
to interview those who are knowledgeable and who might be able to provide
insight concerning the relationship among variables. Case studies can include
contrasting situations or benchmarking against an organization known for its
excellence. Exploratory research may develop hypotheses, but it does not seek to
test them. Exploratory research is characterized by its flexibility.
• Descriptive research is more rigid than exploratory research and seeks to describe
users of a product, determine the proportion of the population that uses a product,
or predict future demand for a product. As opposed to exploratory research,
descriptive research should define questions, people surveyed, and the method of
analysis prior to beginning data collection. In other words, the who, what, where,
when, why, and how aspects of the research should be defined. Such preparation
allows one the opportunity to make any required changes before the costly
process of data collection has begun.
There are two basic types of descriptive research: longitudinal studies and cross-
sectional studies. Longitudinal studies are time series analyses that make repeated
12. measurements of the same individuals, thus allowing one to monitor behavior
such as brand-switching. However, longitudinal studies are not necessarily
representative since many people may refuse to participate because of the
commitment required. Cross-sectional studies sample the population to make
measurements at a specific point in time. A special type of cross-sectional
analysis is a cohort analysis, which tracks an aggregate of individuals who
experience the same event within the same time interval over time. Cohort
analyses are useful for long-term forecasting of product demand.
• Causal research seeks to find cause and effect relationships between variables. It
accomplishes this goal through laboratory and field experiments.
Data Types and Sources
Secondary Data
Before going through the time and expense of collecting primary data, one should check
for secondary data that previously may have been collected for other purposes but that
can be used in the immediate study. Secondary data may be internal to the firm, such as
sales invoices and warranty cards, or may be external to the firm such as published data
or commercially available data. The government census is a valuable source of secondary
data.
Secondary data has the advantage of saving time and reducing data gathering costs. The
disadvantages are that the data may not fit the problem perfectly and that the accuracy
may be more difficult to verify for secondary data than for primary data.
Some secondary data is republished by organizations other than the original source.
Because errors can occur and important explanations may be missing in republished data,
one should obtain secondary data directly from its source. One also should consider who
the source is and whether the results may be biased.
There are several criteria that one should use to evaluate secondary data.
• Whether the data is useful in the research study.
• How current the data is and whether it applies to time period of interest.
• Errors and accuracy - whether the data is dependable and can be verified.
• Presence of bias in the data.
• Specifications and methodologies used, including data collection method,
response rate, quality and analysis of the data, sample size and sampling
technique, and questionnaire design.
• Objective of the original data collection.
13. • Nature of the data, including definition of variables, units of measure, categories
used, and relationships examined.
Primary Data
Often, secondary data must be supplemented by primary data originated specifically for
the study at hand. Some common types of primary data are:
• demographic and socioeconomic characteristics
• psychological and lifestyle characteristics
• attitudes and opinions
• awareness and knowledge - for example, brand awareness
• intentions - for example, purchase intentions. While useful, intentions are not a
reliable indication of actual future behavior.
• motivation - a person's motives are more stable than his/her behavior, so motive is
a better predictor of future behavior than is past behavior.
• behavior
Primary data can be obtained by communication or by observation. Communication
involves questioning respondents either verbally or in writing. This method is versatile,
since one needs only to ask for the information; however, the response may not be
accurate. Communication usually is quicker and cheaper than observation. Observation
involves the recording of actions and is performed by either a person or some mechanical
or electronic device. Observation is less versatile than communication since some
attributes of a person may not be readily observable, such as attitudes, awareness,
knowledge, intentions, and motivation. Observation also might take longer since
observers may have to wait for appropriate events to occur, though observation using
scanner data might be quicker and more cost effective. Observation typically is more
accurate than communication.
Personal interviews have an interviewer bias that mail-in questionnaires do not have. For
example, in a personal interview the respondent's perception of the interviewer may
affect the responses.
Questionnaire Design
The questionnaire is an important tool for gathering primary data. Poorly constructed
questions can result in large errors and invalidate the research data, so significant effort
should be put into the questionnaire design. The questionnaire should be tested
thoroughly prior to conducting the survey.
Measurement Scales
Attributes can be measured on nominal, ordinal, interval, and ratio scales:
14. • Nominal numbers are simply identifiers, with the only permissible mathematical
use being for counting. Example: social security numbers.
• Ordinal scales are used for ranking. The interval between the numbers conveys
no meaning. Median and mode calculations can be performed on ordinal numbers.
Example: class ranking
• Interval scales maintain an equal interval between numbers. These scales can be
used for ranking and for measuring the interval between two numbers. Since the
zero point is arbitrary, ratios cannot be taken between numbers on an interval
scale; however, mean, median, and mode are all valid. Example: temperature
scale
• Ratio scales are referenced to an absolute zero values, so ratios between numbers
on the scale are meaningful. In addition to mean, median, and mode, geometric
averages also are valid. Example: weight
Validity and Reliability
The validity of a test is the extent to which differences in scores reflect differences in the
measured characteristic. Predictive validity is a measure of the usefulness of a measuring
instrument as a predictor. Proof of predictive validity is determined by the correlation
between results and actual behavior. Construct validity is the extent to which a measuring
instrument measures what it intends to measure.
Reliability is the extent to which a measurement is repeatable with the same results. A
measurement may be reliable and not valid. However, if a measurement is valid, then it
also is reliable and if it is not reliable, then it cannot be valid. One way to show reliability
is to show stability by repeating the test with the same results.
Attitude Measurement
Many of the questions in a marketing research survey are designed to measure attitudes.
Attitudes are a person's general evaluation of something. Customer attitude is an
important factor for the following reasons:
• Attitude helps to explain how ready one is to do something.
• Attitudes do not change much over time.
• Attitudes produce consistency in behavior.
• Attitudes can be related to preferences.
Attitudes can be measured using the following procedures:
• Self-reporting - subjects are asked directly about their attitudes. Self-reporting is
the most common technique used to measure attitude.
15. • Observation of behavior - assuming that one's behavior is a result of one's
attitudes, attitudes can be inferred by observing behavior. For example, one's
attitude about an issue can be inferred by whether he/she signs a petition related to
it.
• Indirect techniques - use unstructured stimuli such as word association tests.
• Performance of objective tasks - assumes that one's performance depends on
attitude. For example, the subject can be asked to memorize the arguments of both
sides of an issue. He/she is more likely to do a better job on the arguments that
favor his/her stance.
• Physiological reactions - subject's response to a stimuli is measured using
electronic or mechanical means. While the intensity can be measured, it is
difficult to know if the attitude is positive or negative.
• Multiple measures - a mixture of techniques can be used to validate the findings,
especially worthwhile when self-reporting is used.
There are several types of attitude rating scales:
• Equal-appearing interval scaling - a set of statements are assembled. These
statements are selected according to their position on an interval scale of
favorableness. Statements are chosen that has a small degree of dispersion.
Respondents then are asked to indicate with which statements they agree.
• Likert method of summated ratings - a statement is made and the respondents
indicate their degree of agreement or disagreement on a five point scale (Strongly
Disagree, Disagree, Neither Agree Nor Disagree, Agree, Strongly Agree).
• Semantic differential scale - a scale is constructed using phrases describing
attributes of the product to anchor each end. For example, the left end may state,
"Hours are inconvenient" and the right end may state, "Hours are convenient".
The respondent then marks one of the seven blanks between the statements to
indicate his/her opinion about the attribute.
• Stapel Scale - similar to the semantic differential scale except that 1) points on the
scale are identified by numbers, 2) only one statement is used and if the
respondent disagrees a negative number should marked, and 3) there are 10
positions instead of seven. This scale does not require that bipolar adjectives be
developed and it can be administered by telephone.
• Q-sort technique - the respondent if forced to construct a normal distribution by
placing a specified number of cards in one of 11 stacks according to how
desirable he/she finds the characteristics written on the cards.
16. Sampling Plan
The sampling frame is the pool from which the interviewees are chosen. The telephone
book often is used as a sampling frame, but have some shortcomings. Telephone books
exclude those households that do not have telephones and those households with unlisted
numbers. Since a certain percentage of the numbers listed in a phone book are out of
service, there are many people who have just moved who are not sampled. Such sampling
biases can be overcome by using random digit dialing. Mall intercepts represent another
sampling frame, though there are many people who do not shop at malls and those who
shop more often will be over-represented unless their answers are weighted in inverse
proportion to their frequency of mall shopping.
In designing the research study, one should consider the potential errors. Two sources of
errors are random sampling error and non-sampling error. Sampling errors are those due
to the fact that there is a non-zero confidence interval of the results because of the sample
size being less than the population being studied. Non-sampling errors are those caused
by faulty coding, untruthful responses, respondent fatigue, etc.
There is a tradeoff between sample size and cost. The larger the sample size, the smaller
the sampling error but the higher the cost. After a certain point the smaller sampling error
cannot be justified by the additional cost.
While a larger sample size may reduce sampling error, it actually may increase the total
error. There are two reasons for this effect. First, a larger sample size may reduce the
ability to follow up on non-responses. Second, even if there is a sufficient number of
interviewers for follow-ups, a larger number of interviewers may result in a less uniform
interview process.
Data Collection
In addition to the intrinsic sampling error, the actual data collection process will
introduce additional errors. These errors are called non-sampling errors. Some non-
sampling errors may be intentional on the part of the interviewer, who may introduce a
bias by leading the respondent to provide a certain response. The interviewer also may
introduce unintentional errors, for example, due to not having a clear understanding of
the interview process or due to fatigue.
Respondents also may introduce errors. A respondent may introduce intentional errors by
lying or simply by not responding to a question. A respondent may introduce
unintentional errors by not understanding the question, guessing, not paying close
attention, and being fatigued or distracted.
Such non-sampling errors can be reduced through quality control techniques.
17. Data Preparation: Questionnaire Editing
In our continuing review of data preparation, we will now look further in to the topic
of questionnaire editing. Editing a questionnaire can greatly enhance both the number of
survey responses that a researcher may receive in a study as well as the quality of the
responses to individual questions.
It is important to limit the size of a study so that potential respondents do not
lose motivation to participate. But if we do a good job at limiting the length of a survey
to only the most necessary questions, then we must also make absolutely sure that we get
the absolute most from each of the questions. One of the best tools in fine tuning a
question comes from conducting a pre-test. Pre-tests involve having a limited number
of people answer survey questions and then studying the responses to make sure that
the results are what we might normally expect.
Potential flaws in questionnaires include ambiguous questions, double barreled
questions (asking for two pieces of information in one question), overlapping answers
and offering choices that are not inclusive of all possible answers. These problems should
be handled by the researcher before a questionnaire is ever fielded. But too often,
researchers do not take the time and effort to pre-test surveys.
Once a questionnaire has been carefully crafted and fielded for data collection, problems
can also arise from the respondent side. These potential problems include
illegible, incomplete, ambiguous and inconsistent answers. When this occurs, the
researcher is then faced with the problem of how to remedy such problems. Solutions can
include returning to field for further data collection, assigning missing values or
discarding some or all of the unsatisfactory answers. There is much debate regarding the
proper handling of unsatisfactory responses so it is well worthwhile for researchers to
invest time up front in order to field the best possible questionnaires.
Data Analysis - Preliminary Steps
Before analysis can be performed, raw data must be transformed into the right format.
First, it must be edited so that errors can be corrected or omitted. The data must then be
coded; this procedure converts the edited raw data into numbers or symbols. A codebook
is created to document how the data was coded. Finally, the data is tabulated to count the
number of samples falling into various categories. Simple tabulations count the
occurrences of each variable independently of the other variables. Cross tabulations, also
known as contingency tables or cross tabs, treats two or more variables simultaneously.
However, since the variables are in a two-dimensional table, cross tabbing more than two
variables is difficult to visualize since more than two dimensions would be required.
Cross tabulation can be performed for nominal and ordinal variables.
18. Cross tabulation is the most commonly utilized data analysis method in marketing
research. Many studies take the analysis no further than cross tabulation. This technique
divides the sample into sub-groups to show how the dependent variable varies from one
subgroup to another. A third variable can be introduced to uncover a relationship that
initially was not evident.
Conjoint Analysis
The conjoint analysis is a powerful technique for determining consumer preferences for
product attributes.
Hypothesis Testing
A basic fact about testing hypotheses is that a hypothesis may be rejected but that the
hypothesis never can be unconditionally accepted until all possible evidence is evaluated.
In the case of sampled data, the information set cannot be complete. So if a test using
such data does not reject a hypothesis, the conclusion is not necessarily that the
hypothesis should be accepted.
The null hypothesis in an experiment is the hypothesis that the independent variable has
no effect on the dependent variable. The null hypothesis is expressed as H0. This
hypothesis is assumed to be true unless proven otherwise. The alternative to the null
hypothesis is the hypothesis that the independent variable does have an effect on the
dependent variable. This hypothesis is known as the alternative, research, or experimental
hypothesis and is expressed as H1. This alternative hypothesis states that the relationship
observed between the variables cannot be explained by chance alone.
There are two types of errors in evaluating a hypotheses:
• Type I error: occurs when one rejects the null hypothesis and accepts the
alternative, when in fact the null hypothesis is true.
• Type II error: occurs when one accepts the null hypothesis when in fact the null
hypothesis is false.
Because their names are not very descriptive, these types of errors sometimes are
confused. Some people jokingly define a Type III error to occur when one confuses Type
I and Type II. To illustrate the difference, it is useful to consider a trial by jury in which
the null hypothesis is that the defendant is innocent. If the jury convicts a truly innocent
defendant, a Type I error has occurred. If, on the other hand, the jury declares a truly
guilty defendant to be innocent, a Type II error has occurred.
Hypothesis testing involves the following steps:
19. • Formulate the null and alternative hypotheses.
• Choose the appropriate test.
• Choose a level of significance (alpha) - determine the rejection region.
• Gather the data and calculate the test statistic.
• Determine the probability of the observed value of the test statistic under the null
hypothesis given the sampling distribution that applies to the chosen test.
• Compare the value of the test statistic to the rejection threshold.
• Based on the comparison, reject or do not reject the null hypothesis.
• Make the marketing research conclusion.
In order to analyze whether research results are statistically significant or simply by
chance, a test of statistical significance can be run.
Tests of Statistical Significance
The chi-square ( 2
) goodness-of-fit test is used to determine whether a set of
proportions have specified numerical values. It often is used to analyze bivariate cross-
tabulated data. Some examples of situations that are well-suited for this test are:
• A manufacturer of packaged products test markets a new product and wants to
know if sales of the new product will be in the same relative proportion of
package sizes as sales of existing products.
• A company's sales revenue comes from Product A (50%), Product B (30%), and
Product C (20%). The firm wants to know whether recent fluctuations in these
proportions are random or whether they represent a real shift in sales.
The chi-square test is performed by defining k categories and observing the number of
cases falling into each category. Knowing the expected number of cases falling in each
category, one can define chi-squared as:
2
= ( Oi - Ei )2
/ Ei
where
Oi = the number of observed cases in category i,
Ei = the number of expected cases in category i,
k = the number of categories,
thesummation runs from i = 1 to i = k.
Before calculating the chi-square value, one needs to determine the expected frequency
for each cell. This is done by dividing the number of samples by the number of cells in
the table.
To use the output of the chi-square function, one uses a chi-square table. To do so, one
20. needs to know the number of degrees of freedom (df). For chi-square applied to cross-
tabulated data, the number of degrees of freedom is equal to
( number of columns - 1 ) ( number of rows - 1 )
This is equal to the number of categories minus one. The conventional critical level of
0.05 normally is used. If the calculated output value from the function is greater than the
chi-square look-up table value, the null hypothesis is rejected.
ANOVA
Another test of significance is the Analysis of Variance (ANOVA) test. The primary
purpose of ANOVA is to test for differences between multiple means. Whereas the t-test
can be used to compare two means, ANOVA is needed to compare three or more means.
If multiple t-tests were applied, the probability of a TYPE I error (rejecting a true null
hypothesis) increases as the number of comparisons increases.
One-way ANOVA examines whether multiple means differ. The test is called an F-test.
ANOVA calculates the ratio of the variation between groups to the variation within
groups (the F ratio). While ANOVA was designed for comparing several means, it also
can be used to compare two means. Two-way ANOVA allows for a second independent
variable and addresses interaction.
To run a one-way ANOVA, use the following steps:
1. Identify the independent and dependent variables.
2. Describe the variation by breaking it into three parts - the total variation, the
portion that is within groups, and the portion that is between groups (or among
groups for more than two groups). The total variation (SStotal) is the sum of the
squares of the differences between each value and the grand mean of all the values
in all the groups. The in-group variation (SSwithin) is the sum of the squares of the
differences in each element's value and the group mean. The variation between
group means (SSbetween) is the total variation minus the in-group variation (SStotal -
SSwithin).
3. Measure the difference between each group's mean and the grand mean.
4. Perform a significance test on the differences.
5. Interpret the results.
This F-test assumes that the group variances are approximately equal and that the
observations are independent. It also assumes normally distributed data; however, since
this is a test on means the Central Limit Theorem holds as long as the sample size is not
too small.
ANOVA is efficient for analyzing data using relatively few observations and can be used
with categorical variables. Note that regression can perform a similar analysis to that of
ANOVA.
21. Discriminant Analysis
Analysis of the difference in means between groups provides information about
individual variables, it is not useful for determine their individual impacts when the
variables are used in combination. Since some variables will not be independent from one
another, one needs a test that can consider them simultaneously in order to take into
account their interrelationship. One such test is to construct a linear combination,
essentially a weighted sum of the variables. To determine which variables discriminate
between two or more naturally occurring groups, discriminant analysis is used.
Discriminant analysis can determine which variables are the best predictors of group
membership. It determines which groups differ with respect to the mean of a variable,
and then uses that variable to predict new cases of group membership. Essentially, the
discriminant function problem is a one-way ANOVA problem in that one can determine
whether multiple groups are significantly different from one another with respect to the
mean of a particular variable.
A discriminant analysis consists of the following steps:
1. Formulate the problem.
2. Determine the discriminant function coefficients that result in the highest ratio of
between-group variation to within-group variation.
3. Test the significance of the discriminant function.
4. Interpret the results.
5. Determine the validity of the analysis.
Discriminant analysis analyzes the dependency relationship, whereas factor analysis and
cluster analysis address the interdependency among variables.
Factor Analysis
Factor analysis is a very popular technique to analyze interdependence. Factor analysis
studies the entire set of interrelationships without defining variables to be dependent or
independent. Factor analysis combines variables to create a smaller set of factors.
Mathematically, a factor is a linear combination of variables. A factor is not directly
observable; it is inferred from the variables. The technique identifies underlying structure
among the variables, reducing the number of variables to a more manageable set. Factor
analysis groups variables according to their correlation.
The factor loading can be defined as the correlations between the factors and their
underlying variables. A factor loading matrix is a key output of the factor analysis. An
example matrix is shown below.
Factor 1 Factor 2 Factor 3
22. Variable 1
Variable 2
Variable 3
Column's Sum of Squares:
Each cell in the matrix represents correlation between the variable and the factor
associated with that cell. The square of this correlation represents the proportion of the
variation in the variable explained by the factor. The sum of the squares of the factor
loadings in each column is called an eigenvalue. An eigenvalue represents the amount of
variance in the original variables that is associated with that factor. The communality is
the amount of the variable variance explained by common factors.
A rule of thumb for deciding on the number of factors is that each included factor must
explain at least as much variance as does an average variable. In other words, only factors
for which the eigenvalue is greater than one are used. Other criteria for determining the
number of factors include the Scree plot criteria and the percentage of variance criteria.
To facilitate interpretation, the axis can be rotated. Rotation of the axis is equivalent to
forming linear combinations of the factors. A commonly used rotation strategy is the
varimax rotation. Varimax attempts to force the column entries to be either close to zero
or one.
Cluster Analysis
Market segmentation usually is based not on one factor but on multiple factors. Initially,
each variable represents its own cluster. The challenge is to find a way to combine
variables so that relatively homogenous clusters can be formed. Such clusters should be
internally homogenous and externally heterogeneous. Cluster analysis is one way to
accomplish this goal. Rather than being a statistical test, it is more of a collection of
algorithms for grouping objects, or in the case of marketing research, grouping people.
Cluster analysis is useful in the exploratory phase of research when there are no a-priori
hypotheses.
Cluster analysis steps:
1. Formulate the problem, collecting data and choosing the variables to analyze.
2. Choose a distance measure. The most common is the Euclidean distance. Other
possibilities include the squared Euclidean distance, city-block (Manhattan)
distance, Chebychev distance, power distance, and percent disagreement.
3. Choose a clustering procedure (linkage, nodal, or factor procedures).
23. 4. Determine the number of clusters. They should be well separated and ideally they
should be distinct enough to give them descriptive names such as professionals,
buffs, etc.
5. Profile the clusters.
6. Assess the validity of the clustering.
Marketing Research Report
The format of the marketing research report varies with the needs of the organization.
The report often contains the following sections:
• Authorization letter for the research
• Table of Contents
• List of illustrations
• Executive summary
• Research objectives
• Methodology
• Results
• Limitations
• Conclusions and recommendations
• Appendices containing copies of the questionnaires, etc.