Africa Agriculture Transformation Policy Drivers - 16th CAADP PP, 24 - 25 November 2020
•
0 gefällt mir•39 views

A presentation by Dr. Samuel Benin, Deputy Division Director, IFPRI Africa Regional Office, at the 16th Comprehensive Africa Agriculture Development Programme (CAADP) Partnership Platform (PP)
Empfohlen

Empfohlen
Weitere ähnliche Inhalte
Mehr von African Regional Strategic Analysis and Knowledge Support System (ReSAKSS)
Mehr von African Regional Strategic Analysis and Knowledge Support System (ReSAKSS) (20)
Kürzlich hochgeladen
Kürzlich hochgeladen (20)
Africa Agriculture Transformation Policy Drivers - 16th CAADP PP, 24 - 25 November 2020
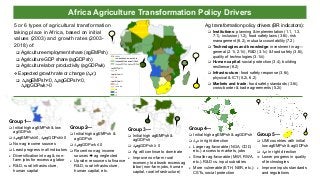
- 1. Africa Agriculture Transformation Policy Drivers 5 or 6 types of agricultural transformation taking place in Africa, based on initial values (2003) and growth rates (2003- 2018) of: Agriculture employment share (agEMPsh) Agriculture GDP share (agGDPsh) Agriculture labor productivity (agGDPwk) Expected growth rate or change (∆tx): ∆tagEMPsh<0, ∆tagGDPsh<0, ∆tagGDPwk>0 Ag transformation policy drivers (BR indicators): Institutions: planning & implementation (1.1, 1.3, 7.1), inclusion (1.2), food safety laws (3.6i), risk management (6.2), mutual accountability (7.2) Technologies and knowledge: investment in ag— general (2.1i, 2.1ii), R&D (3.1v) & food safety (3.6i), quality of technologies (3.1iii) Human capital: social protection (3.4), building resilience (6.2) Infrastructure: food safety response (3.6i), physical & ICT (5.2i, 6.2) Markets and trade: food safety standards (3.6i), cross-border & trade agreements (5.2i) Group 2— Initial high agEMPsh & agGDPsh ∆tagGDPwk ≤ 0 Recent non-ag income sources ag neglected Upside: resources to finance R&D, rural infrastructure, human capital, etc. Group 3— Initial high agEMPsh & agGDPsh ∆tagGDPsh ≥ 0 Ag will continue to dominate Improve non-farm rural economy to absorb excess ag labor (non-farm jobs, human capital, rural infrastructure) Group 4— Initial high agEMPsh & agGDPsh ∆tx in right direction Larger ag-favorable (NGA, COD, etc.): access to markets, jobs Smaller ag-favorable (MWI, RWA, etc.): R&D vs. input subsidies More vulnerable (ETH, NER, etc.): CSTs, social protection Group 5— UMI countries with initial low agEMPsh & agGDPsh ∆tx in right direction Lower progress in quality of technologies Improve inputs standards and regulations Group 1— Initial high agEMPsh & low agGDPsh ∆tagEMPsh≥0, ∆tagGDPsh≥0 Non-ag income sources Least progress in all indicators Diversification into ag & non- farm jobs for excess ag labor R&D, rural infrastructure, human capital Initial values Low agEMPsh, low agGDPsh High agEMPsh, low agGDPsh High agEMPsh, high agGDPsh ∆t agEMPsh (%) ≥0 ∆t agGDPsh (%) ≥0 ∆t agGDPwk (%) ≤-3 -3< x ≤0 ≥3 ≥3 ≥3