Johnson & Johnson (JNJ) Stock Expected to be Volatile
•
1 gefällt mir•350 views

Actionable trade ideas for stock market investors and traders seeking alpha by overlaying their portfolios with options, other derivatives, ETFs, and disciplined and applied Game Theory for hedge fund managers and other active fund managers worldwide. Ryan Renicker, CFA

Empfohlen
Weitere ähnliche Inhalte
Mehr von RYAN RENICKER
Mehr von RYAN RENICKER (20)
Kürzlich hochgeladen
Kürzlich hochgeladen (20)
Johnson & Johnson (JNJ) Stock Expected to be Volatile
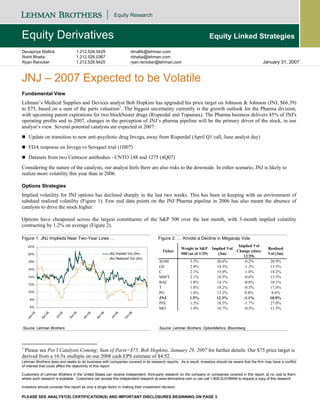
- 1. Equity Research Equity Derivatives Equity Linked Strategies Devapriya Mallick 1.212.526.5429 dmallik@lehman.com Rohit Bhatia 1.212.526.0367 rbhatia@lehman.com Ryan Renicker 1.212.526.9425 ryan.renicker@lehman.com January 31, 2007 JNJ – 2007 Expected to be Volatile Fundamental View Lehman’s Medical Supplies and Devices analyst Bob Hopkins has upgraded his price target on Johnson & Johnson (JNJ, $66.39) to $75, based on a sum of the parts valuation1. The biggest uncertainty currently is the growth outlook for the Pharma division, with upcoming patent expirations for two blockbuster drugs (Risperdal and Topamax). The Pharma business delivers 45% of JNJ's operating profits and in 2007, changes in the perception of JNJ’s pharma pipeline will be the primary driver of the stock, in our analyst’s view. Several potential catalysts are expected in 2007: Update on transition to new anti-psychotic drug Invega, away from Risperdal (April Q1 call, June analyst day) FDA response on Invega vs Seroquel trial (1H07) Datasets from two Centocor antibodies - CNTO 148 and 1275 (4Q07) Considering the nature of the catalysts, our analyst feels there are also risks to the downside. In either scenario, JNJ is likely to realize more volatility this year than in 2006. Options Strategies Implied volatility for JNJ options has declined sharply in the last two weeks. This has been in keeping with an environment of subdued realized volatility (Figure 1). Few real data points on the JNJ Pharma pipeline in 2006 has also meant the absence of catalysts to drive the stock higher. Options have cheapened across the largest constituents of the S&P 500 over the last month, with 3-month implied volatility contracting by 1.2% on average (Figure 2). Figure 1: JNJ Implieds Near Two-Year Lows … Figure 2: … Amidst a Decline in Megacap Vols 22% Implied Vol Weight in S&P Implied Vol Realized Ticker Change (since 20% JNJ Implied Vol (3m) 500 (as of 1/29) (3m) Vol (3m) 12/29) JNJ Realized Vol (3m) 18% XOM 3.3% 20.6% -0.2% 20.9% GE 2.9% 14.5% -1.3% 13.5% 16% C 2.1% 15.0% -1.0% 14.2% 14% MSFT 2.1% 18.5% -0.6% 13.5% 12% BAC 1.8% 14.1% -0.6% 10.1% T 1.8% 18.2% -0.5% 17.0% 10% PG 1.6% 13.2% 0.4% 8.6% 8% JNJ 1.5% 12.3% -1.1% 10.9% PFE 1.5% 18.5% -1.7% 27.0% 6% MO 1.4% 18.7% -0.3% 11.5% 5 5 6 6 5 6 05 06 r-0 -0 r-0 -0 l-0 l-0 n- n- ct ct Ju Ju Ap Ap Ja Ja O O Source: Lehman Brothers Source: Lehman Brothers, OptionMetrics, Bloomberg 1 Please see Pot’l Catalysts Coming; Sum of Parts=$75, Bob Hopkins, January 29, 2007 for further details. Our $75 price target is derived from a 16.5x multiple on our 2008 cash EPS estimate of $4.52. Lehman Brothers does and seeks to do business with companies covered in its research reports. As a result, investors should be aware that the firm may have a conflict of interest that could affect the objectivity of this report. Customers of Lehman Brothers in the United States can receive independent, third-party research on the company or companies covered in this report, at no cost to them, where such research is available. Customers can access this independent research at www.lehmanlive.com or can call 1-800-2LEHMAN to request a copy of this research. Investors should consider this report as only a single factor in making their investment decision. PLEASE SEE ANALYST(S) CERTIFICATION(S) AND IMPORTANT DISCLOSURES BEGINNING ON PAGE 3.
- 2. JNJ – 2007 Expected to be Volatile January 31, 2007 Due to its size, JNJ cannot be easily compared to most other pharmaceutical and health care equipment companies. Figure 3 shows the implied-realized spread for 3-month and 1-month vols for JNJ and other stocks used as comparables by our fundamental analyst. To screen for option liquidity, we only consider stocks with a total open interest of at least 50,000 contracts. Within this universe, JNJ has the lowest absolute level of implied volatility and among the narrowest spreads between implied and realized volatility. JNJ’s upward sloping term structure of implied volatility does not appear to be pricing in any major catalysts in the medium term. Options expiring in July appear slightly cheap relative to other maturities (Figure 4). We believe purchasing the Jul07 70 calls represents an efficient means of expressing a bullish fundamental view on JNJ. The $1.05 offer as of last night’s close represents about 1.6% of the underlying stock price. We believe the breakeven of 71.05 looks fairly low considering the potential upcoming catalysts. An alternative strategy for investors looking to benefit from price moves in either direction would be to purchase the Jul07 65-70 strangle for about $2.45 (~ 3.7% of the underlying price). Delta-hedging the strangle can be an attractive means of taking advantage of the cheap implied volatility, while benefiting as either leg moves closer to the money. Figure 3: JNJ Implied Realized Spread Relative to Peers Figure 4: July Options Relatively Cheap 3m 1m 3- 1- 15% Market Implied- Implied- Month Month Ticker Cap ($ GICS Industry Realized Realized Implied Implied MM) Vol Vol 14% Vol Vol Spread Spread STJ 15,132 Health Care Eq & Svcs 28.2% 1.7% 27.4% -5.2% ABT 81,512 Pharmaceuticals 16.0% 0.3% 15.4% 0.5% 13% JNJ 192,923 Pharmaceuticals 12.3% 1.4% 11.7% 0.8% SGP 36,946 Pharmaceuticals 19.5% 1.7% 18.1% 2.6% 12% MRK 97,456 Pharmaceuticals 19.6% 2.6% 19.5% 4.1% JNJ Term Structure PFE 188,265 Pharmaceuticals 18.5% -8.5% 20.1% 4.8% BMY 54,655 Pharmaceuticals 23.5% 7.8% 27.4% 4.8% 11% WYE 66,823 Pharmaceuticals 18.4% 2.1% 19.0% 5.0% PG 204,068 Household Products 13.2% 4.6% 14.4% 5.1% 10% MDT 61,229 Health Care Eq & Svcs 17.1% -3.9% 17.9% 5.6% CL 34,521 Household Products 14.7% 3.2% 15.2% 6.7% 07 08 7 08 08 8 09 07 07 -0 -0 p- n- n- b- - g- r- ov ec ar LLY 59,771 Pharmaceuticals 15.9% 3.1% 16.2% 7.8% Ja Ju Ap Fe Se Au M N D ZMH 19,963 Health Care Eq & Svcs 19.3% 4.6% 22.8% 8.8% BSX 27,181 Health Care Eq & Svcs 31.7% 7.7% 31.0% 9.2% BOL 2,910 Health Care Eq & Svcs 24.3% 7.4% 22.8% 12.4% Source: Lehman Brothers Source: Lehman Brothers 2
- 3. JNJ – 2007 Expected to be Volatile January 31, 2007 Analyst Certification: I, Devapriya Mallick, hereby certify (1) that the views expressed in this research email accurately reflect my personal views about any or all of the subject securities or issuers referred to in this email and (2) no part of my compensation was, is or will be directly or indirectly related to the specific recommendations or views expressed in this email. Important Disclosures Lehman Brothers does and seeks to do business with companies covered in its research reports. As a result, investors should be aware that the firm may have a conflict of interest that could affect the objectivity of this email communication. Customers of Lehman Brothers in the United States can receive independent, third-party research on the company or companies covered in this report, at no cost to them, where such research is available. Customers can access this independent research at www.lehmanlive.com or can call 1-800-2-LEHMAN to request a copy of this research. Investors should consider this communication as only a single factor in making their investment decision. The analysts responsible for preparing this report have received compensation based upon various factors including the Firm’s total revenues, a portion of which is generated by investment banking activities. Stock price and ratings history charts along with other important disclosures are available on our disclosure website at www.lehman.com/disclosures And may also be obtained by sending a written request to: LEHMAN BROTHERS CONTROL ROOM, 745 SEVENTH AVENUE, 19TH FLOOR NEW YORK, NY 10019 Mentioned Stocks Johnson & Johnson (JNJ - USD66.15) 1-Overweight / Positive J Risks Which May Impede the Achievement of the Price Target: Risks to the JNJ story include possible rotation back into large-cap pharma, delays and/or failure in the late-stage pharma pipeline. Disclosure Legend: J: Lehman Brothers Inc. or an affiliate trade(s) regularly in the shares of the subject company. Guide to Lehman Brothers Equity Research Rating System Our coverage analysts use a relative rating system in which they rate stocks as 1-Overweight, 2- Equal weight or 3-Underweight (see definitions below) relative to other companies covered by the analyst or a team of analysts that are deemed to be in the same industry sector (“the sector coverage universe”). To see a list of companies that comprise a particular sector coverage universe, please go to www.lehman.com/disclosures. In addition to the stock rating, we provide sector views which rate the outlook for the sector coverage universe as 1-Positive, 2-Neutral or 3-Negative (see definitions below). A rating system using terms such as buy, hold and sell is not the equivalent of our rating system. Investors should carefully read the entire research report including the definitions of all ratings and not infer its contents from ratings alone. Stock Rating 1-Overweight - The stock is expected to outperform the unweighted expected total return of the sector coverage universe over a 12-month investment horizon. 2-Equal weight - The stock is expected to perform in line with the unweighted expected total return of the sector coverage universe over a 12-month investment horizon. 3-Underweight - The stock is expected to underperform the unweighted expected total return of the sector coverage universe over a 12-month investment horizon. RS-Rating Suspended - The rating and target price have been suspended temporarily to comply with applicable regulations and/or firm policies in certain circumstances including when Lehman Brothers is acting in an advisory capacity on a merger or strategic transaction involving the company. 3
- 4. JNJ – 2007 Expected to be Volatile January 31, 2007 Sector View 1-Positive - sector coverage universe fundamentals are improving. 2-Neutral - sector coverage universe fundamentals are steady, neither improving nor deteriorating. 3-Negative - sector coverage universe fundamentals are deteriorating. Distribution of Ratings: Lehman Brothers Equity Research has 1996 companies under coverage. 43% have been assigned a 1-Overweight rating which, for purposes of mandatory disclosures, is classified as a Buy rating, 34% of companies with this rating are investment banking clients of the Firm. 41% have been assigned a 2-Equal weight rating which, for purposes of mandatory disclosures, is classified as a Hold rating, 6% of companies with this rating are investment banking clients of the Firm. 16% have been assigned a 3-Underweight rating which, for purposes of mandatory disclosures, is classified as a Sell rating, 63% of companies with this rating are investment banking clients of the Firm. This material has been prepared and/or issued by Lehman Brothers Inc., member SIPC, and/or one of its affiliates (“Lehman Brothers”) and has been approved by Lehman Brothers International (Europe), authorized and regulated by the Financial Services Authority, in connection with its distribution in the European Economic Area. This material is distributed in Japan by Lehman Brothers Japan Inc., and in Hong Kong by Lehman Brothers Asia Limited. This material is distributed in Australia by Lehman Brothers Australia Pty Limited, and in Singapore by Lehman Brothers Inc., Singapore Branch. (“LBIS”). Where this material is distributed by LBIS, please note that it is intended for general circulation only and the recommendations contained herein does not take into account the specific investment objectives, financial situation or particular needs of any particular person. An investor should consult his Lehman Brothers’ representative regarding the suitability of the product and take into account his specific investment objectives, financial situation or particular needs before he makes a commitment to purchase the investment product. This material is distributed in Korea by Lehman Brothers International (Europe) Seoul Branch. This document is for information purposes only and it should not be regarded as an offer to sell or as a solicitation of an offer to buy the securities or other instruments mentioned in it. No part of this document may be reproduced in any manner without the written permission of Lehman Brothers. With the exception of disclosures relating to Lehman Brothers, this research report is based on current public information that Lehman Brothers considers reliable, but we make no representation that it is accurate or complete, and it should not be relied on as such. In the case of any disclosure to the effect that Lehman Brothers Inc. or its affiliates beneficially own 1% or more of any class of common equity securities of the subject company, the computation of beneficial ownership of securities is based upon the methodology used to compute ownership under Section 13(d) of the United States' Securities Exchange Act of 1934. In the case of any disclosure to the effect that Lehman Brothers Inc. and/or its affiliates hold a short position of at least 1% of the outstanding share capital of a particular company, such disclosure relates solely to the ordinary share capital of the company. Accordingly, while such calculation represents Lehman Brothers’ holdings net of any long position in the ordinary share capital of the company, such calculation excludes any rights or obligations that Lehman Brothers may otherwise have, or which may accrue in the future, with respect to such ordinary share capital. Similarly such calculation does not include any shares held or owned by Lehman Brothers where such shares are held under a wider agreement or arrangement (be it with a client or a counterparty) concerning the shares of such company (e.g. prime broking and/or stock lending activity). Any such disclosure represents the position of Lehman Brothers as of the last business day of the calendar month preceding the date of this report. This material is provided with the understanding that Lehman Brothers is not acting in a fiduciary capacity. Opinions expressed herein reflect the opinion of Lehman Brothers and are subject to change without notice. The products mentioned in this document may not be eligible for sale in some states or countries, and they may not be suitable for all types of investors. If an investor has any doubts about product suitability, he should consult his Lehman Brothers representative. The value of and the income produced by products may fluctuate, so that an investor may get back less than he invested. Value and income may be adversely affected by exchange rates, interest rates, or other factors. Past performance is not necessarily indicative of future results. If a product is income producing, part of the capital invested may be used to pay that income. © 2007 Lehman Brothers. All rights reserved. Additional information is available on request. Please contact a Lehman Brothers entity in your home jurisdiction. Lehman Brothers policy for managing conflicts of interest in connection with investment research is available at www.lehman.com/researchconflictspolicy. Ratings, earnings per share forecasts and price targets contained in the Firm's equity research reports covering U.S. companies are available at www.lehman.com/disclosures.Complete disclosure information on companies covered by Lehman Brothers Equity Research is available at www.lehman.com/disclosures. 4