Weitere ähnliche Inhalte Ähnlich wie TREB Market Watch June 2012 Ähnlich wie TREB Market Watch June 2012 (18) Kürzlich hochgeladen (20) 1. For All TREB Member Inquiries:
(416) 443-8152
For All Media/Public Inquiries:
June 2012 (416) 443-8158
Economic Indicators Low-Rise Home Types Drive June Price Growth TorontoMLS Sales Activity1,7
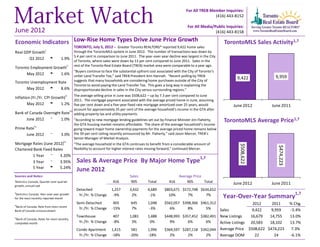
TORONTO, July 5, 2012 – Greater Toronto REALTORS® reported 9,422 home sales
Real GDP Growthi through the TorontoMLS system in June 2012. The number of transactions was down by
5.4 per cent in comparison to June 2011. The year-over-year decline was largest in the City
Q1 2012 t 1.9%
of Toronto, where sales were down by 13 per cent compared to June 2011. Sales in the
rest of the Toronto Real Estate Board (TREB) market area were comparable to a year ago.
Toronto Employment Growthi i
“Buyers continue to face the substantial upfront cost associated with the City of Toronto’s
May 2012 t 1.6% unfair Land Transfer Tax,” said TREB President Ann Hannah. “Recent polling by TREB
9,422 9,959
Toronto Unemployment Rate suggests that many households are considering home purchases outside of the City of
Toronto to avoid paying the Land Transfer Tax. This goes a long way in explaining the
May 2012 t 8.6% disproportionate decline in sales in the City versus surrounding regions.”
ii The average selling price in June was $508,622 – up by 7.3 per cent compared to June
Inflation (Yr./Yr. CPI Growth)
2011. The mortgage payment associated with the average priced home in June, assuming
May 2012 u 1.2% five per cent down and a five-year fixed rate mortgage amortized over 25 years, would June 2012 June 2011
iii
account for approximately 35 per cent of the average household’s income in the GTA after
Bank of Canada Overnight Rate adding property tax and utility payments.
June 2012 q 1.0% “According to new mortgage lending guidelines set out by Finance Minister Jim Flaherty, TorontoMLS Average Price1,7
iv
the GTA housing market remains affordable. The share of the average household’s income
Prime Rate going toward major home ownership payments for the average priced home remains below
June 2012 q 3.0% the 39 per cent ceiling recently announced by Mr. Flaherty,” said Jason Mercer, TREB’s
Senior Manager of Market Analysis.
iv
Mortgage Rates (June 2012) “The average household in the GTA continues to benefit from a considerable amount of
$508,622
$474,223
Chartered Bank Fixed Rates flexibility to account for higher interest rates moving forward,” continued Mercer.
1 Year q 3.20%
1,7
3 Year q 3.95% Sales & Average Price By Major Home Type
5 Year u 5.24%
June 2012
Sources and Notes: Sales Average Price
i
Statistics Canada, Quarter-over-quarter 416 905 Total 416 905 Total June 2012 June 2011
growth, annualized
Detached 1,257 3,432 4,689 $803,671 $572,748 $634,652
ii
Statistics Canada, Year-over-year growth 1,7
for the most recently reported month
Yr./Yr. % Change -9% 2% -1% 10% 7% 7% Year-Over-Year Summary
Semi-Detached 403 645 1,048 $562,057 $398,366 $461,312 2012 2011 % Chg.
iii
Bank of Canada, Rate from most recent
Yr./Yr. % Change -15% 7% -3% 6% 8% 5% Sales 9,422 9,959 -5.4%
Bank of Canada announcement
iv
Townhouse 407 1,081 1,488 $448,993 $357,452 $382,491 New Listings 16,679 14,755 13.0%
Bank of Canada, Rates for most recently
completed month Yr./Yr. % Change -8% 3% 0% 9% 6% 6% Active Listings 20,583 18,102 13.7%
Condo Apartment 1,415 581 1,996 $364,597 $287,118 $342,044 Average Price $508,622 $474,223 7.3%
Yr./Yr. % Change -18% -20% -18% 2% 2% 2% Average DOM 22 24 -6.1%
2. Toronto Real Estate Board
SALES BY PRICE RANGE AND HOUSE TYPE1,7 JUNE 2012
Price Range Detached Semi-Detached Att/Row/Twnhouse Condo Townhouse Condo Apt Link Co-op Apt Det Condo Co-ownership Apt Total
$0 to $99,999 2 0 2 3 15 0 0 0 2 24
$100,000 to $199,999 59 17 4 80 244 0 0 0 2 406
$200,000 to $299,999 309 49 107 228 671 46 2 1 4 1,417
$300,000 to $399,999 722 330 240 278 592 33 2 7 1 2,205
$400,000 to $499,999 904 378 220 93 259 43 2 2 1 1,902
$500,000 to $599,999 811 133 86 23 95 46 0 0 0 1,194
$600,000 to $699,999 631 61 46 21 53 6 0 0 0 818
$700,000 to $799,999 409 40 15 13 26 0 0 0 0 503
$800,000 to $899,999 237 16 9 2 13 0 0 0 0 277
$900,000 to $999,999 156 12 5 1 6 0 0 0 0 180
$1,000,000 to $1,249,999 164 6 7 3 11 0 1 0 0 192
$1,250,000 to $1,499,999 111 4 0 1 5 0 0 0 0 121
$1,500,000 to $1,749,999 63 2 1 0 4 0 0 0 0 70
$1,750,000 to $1,999,999 38 0 0 0 0 0 0 0 0 38
$2,000,000 + 73 0 0 0 2 0 0 0 0 75
Total Sales 4,689 1,048 742 746 1,996 174 7 10 10 9,422
Share of Total Sales 49.8% 11.1% 7.9% 7.9% 21.2% 1.8% 0.1% 0.1% 0.1% -
Average Price $634,652 $461,312 $430,316 $334,922 $342,044 $413,698 $463,286 $352,670 $227,730 $508,622
SALES BY PRICE RANGE AND HOUSE TYPE1,7 YEAR-TO-DATE, 2012
Price Range Detached Semi-Detached Att/Row/Twnhouse Condo Townhouse Condo Apt Link Co-op Apt Det Condo Co-ownership Apt Total
$0 to $99,999 19 1 4 10 135 0 3 0 5 177
$100,000 to $199,999 365 104 33 415 1,453 7 23 0 6 2,406
$200,000 to $299,999 1,767 369 687 1,306 3,725 230 17 8 23 8,132
$300,000 to $399,999 3,845 1,761 1,251 1,377 3,486 171 19 20 7 11,937
$400,000 to $499,999 4,692 1,873 1,106 459 1,448 215 8 7 5 9,813
$500,000 to $599,999 4,248 683 450 133 533 194 3 3 0 6,247
$600,000 to $699,999 3,147 337 224 80 263 56 1 4 0 4,112
$700,000 to $799,999 2,100 189 76 55 118 7 2 1 0 2,548
$800,000 to $899,999 1,386 108 50 21 75 0 0 0 0 1,640
$900,000 to $999,999 784 55 19 5 36 0 0 0 0 899
$1,000,000 to $1,249,999 986 47 20 11 67 2 2 1 0 1,136
$1,250,000 to $1,499,999 637 31 6 1 27 0 0 0 0 702
$1,500,000 to $1,749,999 346 10 6 1 21 0 0 0 0 384
$1,750,000 to $1,999,999 199 5 2 0 5 0 0 0 0 211
$2,000,000 + 415 2 1 1 15 0 0 0 0 434
Total Sales 24,936 5,575 3,935 3,875 11,407 882 78 44 46 50,778
Share of Total Sales 49.1% 11.0% 7.7% 7.6% 22.5% 1.7% 0.2% 0.1% 0.1% -
Average Price $635,993 $461,227 $424,531 $328,955 $338,924 $414,470 $308,095 $416,236 $255,730 $505,366
Page 3 July 2010
Market Watch, June 2012 2
3. Toronto Real Estate Board
ALL HOME TYPES, JUNE 2012
SUMMARY OF EXISTING HOME TRANSACTIONS
ALL TREB AREAS
Number of Sales Dollar Volume1 Average Price1 Median Price1 New Listings2 SNLR (Trend) 8 Active Listings3 Mos. Inv. (Trend)9 Avg. SP/LP 4 Avg. DOM5
TREB Total 9,422 $4,792,235,831 $508,622 $430,000 16,679 58.7% 20,583 2.2 99% 22
Halton Region 607 $341,854,833 $563,188 $478,000 995 61.1% 1,311 2.3 98% 23
Burlington 110 $51,172,400 $465,204 $405,750 158 60.2% 215 2.5 98% 23
Halton Hills 83 $37,918,600 $456,851 $445,000 134 70.3% 180 2.3 99% 19
Milton 188 $87,966,364 $467,906 $441,500 296 62.3% 322 1.6 99% 19
Oakville 226 $164,797,469 $729,192 $612,500 407 57.3% 594 2.6 97% 28
Peel Region 2,096 $940,997,073 $448,949 $410,000 3,832 58.2% 4,282 2.0 98% 21
Brampton 908 $371,177,615 $408,786 $388,250 1,682 57.0% 1,720 2.0 98% 21
Caledon 99 $55,587,450 $561,489 $523,500 145 55.9% 279 3.5 97% 37
Mississauga 1,089 $514,232,008 $472,206 $429,000 2,005 59.3% 2,283 2.0 98% 20
City of Toronto 3,520 $1,950,350,664 $554,077 $434,405 6,742 56.4% 8,537 2.3 99% 21
! TURN PAGE FOR CITY OF TORONTO
TABLES OR CLICK HERE:
York Region 1,763 $1,061,765,996 $602,250 $548,000 3,102 60.8% 3,674 2.0 99% 21
Aurora 108 $60,338,262 $558,688 $495,000 158 68.5% 168 1.7 99% 17
E. Gwillimbury 30 $17,851,900 $595,063 $462,500 52 62.7% 88 3.0 96% 42
Georgina 88 $27,103,750 $307,997 $281,500 119 66.2% 245 3.1 97% 40
King 26 $20,285,500 $780,212 $672,500 61 49.7% 140 5.8 96% 38
Markham 503 $322,229,832 $640,616 $584,000 940 59.1% 976 1.8 99% 18
Newmarket 181 $82,012,160 $453,106 $422,000 229 76.1% 203 1.2 99% 16
Richmond Hill 332 $214,111,113 $644,913 $589,000 677 58.5% 733 1.7 98% 20
Vaughan 414 $266,184,318 $642,957 $585,000 750 58.7% 906 2.0 98% 21
Whitchurch-Stouffville 81 $51,649,161 $637,644 $539,000 116 59.7% 215 2.9 97% 30
Durham Region 1,122 $386,985,425 $344,907 $321,059 1,623 62.6% 2,012 2.3 98% 23
Ajax 219 $81,852,899 $373,758 $358,500 284 66.0% 261 1.6 99% 18
Brock 26 $6,546,650 $251,794 $221,000 47 42.5% 139 8.3 96% 51
Clarington 172 $51,421,690 $298,963 $279,500 226 62.9% 325 2.4 98% 27
Oshawa 248 $62,641,876 $252,588 $242,450 394 63.1% 478 2.2 98% 22
Pickering 161 $66,007,000 $409,981 $373,000 251 60.7% 279 2.1 98% 21
Scugog 34 $12,582,800 $370,082 $345,500 49 53.6% 126 4.5 97% 46
Uxbridge 45 $24,116,223 $535,916 $490,000 67 54.1% 128 4.5 97% 36
Whitby 217 $81,816,287 $377,034 $355,500 305 65.9% 276 1.7 99% 16
Dufferin County 76 $28,347,650 $372,995 $342,000 96 67.1% 120 2.6 98% 42
Orangeville 76 $28,347,650 $372,995 $342,000 96 67.1% 120 2.6 98% 42
Simcoe County 238 $81,934,190 $344,261 $320,000 289 61.9% 647 3.7 98% 43
Adjala-Tosorontio 18 $7,947,500 $441,528 $421,000 34 50.8% 89 6.6 97% 66
Bradford West Gwillimbury 49 $19,856,400 $405,233 $397,000 69 74.5% 102 2.0 99% 26
Essa 44 $11,899,390 $270,441 $262,000 44 55.0% 113 4.9 98% 63
Innisfil 61 $20,694,200 $339,249 $314,000 71 52.5% 209 4.9 97% 39
New Tecumseth 66 $21,536,700 $326,314 $315,500 71 69.5% 134 3.1 97% 40
Page 3 July 2010
Market Watch, June 2012 3
4. Toronto Real Estate Board
ALL HOME TYPES, JUNE 2012
SUMMARY OF EXISTING HOME TRANSACTIONS
CITY OF TORONTO MUNICIPAL BREAKDOWN
1 1 1 2 8 3 4 5
Number of Sales Dollar Volume Average Price Median Price New Listings SNLR (Trend) Active Listings Mos. Inv. (Trend)9 Avg. SP/LP Avg. DOM
TREB Total 9,422 $4,792,235,831 $508,622 $430,000 16,679 58.7% 20,583 2.2 99% 22
City of Toronto Total 3,520 $1,950,350,664 $554,077 $434,405 6,742 56.4% 8,537 2.3 99% 21
Toronto West 958 $457,716,682 $477,784 $418,750 1,559 57.7% 2,089 2.5 100% 24
Toronto W01 59 $38,197,739 $647,419 $609,000 123 55.8% 157 2.2 102% 17
Toronto W02 93 $57,943,600 $623,049 $600,000 130 67.2% 104 1.3 103% 16
Toronto W03 99 $39,178,929 $395,747 $383,000 121 65.5% 101 1.8 100% 16
Toronto W04 94 $37,432,488 $398,218 $372,500 151 58.7% 210 2.6 98% 23
Toronto W05 126 $44,214,999 $350,913 $379,025 201 56.9% 301 3.0 98% 31
Toronto W06 136 $61,997,210 $455,862 $449,950 269 46.5% 436 3.4 99% 29
Toronto W07 35 $24,271,250 $693,464 $635,000 46 69.5% 35 1.4 102% 15
Toronto W08 187 $108,612,152 $580,814 $475,000 260 60.8% 372 2.3 98% 22
Toronto W09 46 $21,146,038 $459,696 $467,500 86 55.7% 135 2.8 97% 27
Toronto W10 83 $24,722,277 $297,859 $273,000 172 55.8% 238 2.9 98% 30
Toronto Central 1,519 $1,036,475,711 $682,341 $475,200 3,283 53.5% 4,496 2.4 99% 22
Toronto C01 406 $187,414,440 $461,612 $400,000 981 49.5% 1,427 2.9 99% 24
Toronto C02 89 $78,186,913 $878,505 $770,900 150 49.7% 263 3.2 100% 20
Toronto C03 52 $50,747,854 $975,920 $635,000 87 59.8% 112 2.2 99% 14
Toronto C04 102 $121,986,642 $1,195,947 $1,152,500 163 57.0% 210 2.1 99% 21
Toronto C06 28 $18,464,638 $659,451 $658,500 64 57.2% 82 2.2 99% 20
Toronto C07 110 $69,159,695 $628,725 $484,750 258 53.8% 352 2.2 99% 21
Toronto C08 138 $61,837,063 $448,095 $406,000 329 57.0% 458 2.2 99% 22
Toronto C09 28 $45,028,500 $1,608,161 $1,218,000 51 59.0% 66 2.4 97% 22
Toronto C10 71 $47,254,080 $665,550 $630,000 120 64.2% 127 1.5 103% 14
Toronto C11 34 $22,674,236 $666,889 $383,400 64 62.6% 86 1.9 98% 17
Toronto C12 55 $108,922,700 $1,980,413 $1,489,000 91 50.8% 162 3.5 96% 34
Toronto C13 94 $54,285,794 $577,508 $459,000 159 61.4% 157 1.8 101% 19
Toronto C14 171 $96,455,280 $564,066 $410,000 424 52.2% 559 2.1 99% 24
Toronto C15 141 $74,057,876 $525,233 $450,000 342 51.2% 435 2.3 98% 18
Toronto East 1,043 $456,158,271 $437,352 $420,000 1,900 60.6% 1,952 1.9 100% 19
Toronto E01 98 $58,074,270 $592,595 $570,500 156 62.3% 119 1.5 103% 13
Toronto E02 75 $45,940,671 $612,542 $539,900 134 63.0% 113 1.3 101% 13
Toronto E03 115 $61,500,212 $534,784 $516,700 209 61.7% 174 1.5 102% 14
Toronto E04 111 $39,861,300 $359,111 $394,000 220 60.8% 251 2.0 100% 21
Toronto E05 125 $53,727,268 $429,818 $410,000 204 67.8% 185 1.4 101% 16
Toronto E06 41 $20,093,548 $490,087 $437,000 73 58.0% 70 1.6 99% 20
Toronto E07 96 $35,418,034 $368,938 $336,500 187 58.3% 220 2.2 99% 26
Toronto E08 74 $27,598,468 $372,952 $373,750 111 59.7% 143 2.3 99% 24
Toronto E09 116 $38,517,279 $332,046 $335,500 263 55.8% 329 2.4 99% 27
Toronto E10 88 $38,812,537 $441,052 $429,250 134 63.1% 121 1.8 100% 15
Toronto E11 104 $36,614,684 $352,064 $344,900 209 58.0% 227 2.2 99% 22
Page 3 July 2010
Market Watch, June 2012 4
5. Toronto Real Estate Board
ALL HOME TYPES, YEAR-TO-DATE 2012
SUMMARY OF EXISTING HOME TRANSACTIONS
ALL TREB AREAS
Number of Sales Dollar Volume1 Average Price1 Median Price1 New Listings2 Avg. SP/LP 4 Avg. DOM5
TREB Total 50,778 $25,661,477,064 $505,366 $424,900 90,635 99% 23
Halton Region 3,274 $1,857,411,985 $567,322 $473,000 5,558 98% 23
Burlington 446 $214,539,532 $481,030 $411,000 777 98% 27
Halton Hills 519 $240,725,950 $463,826 $432,000 752 98% 27
Milton 1,001 $462,319,801 $461,858 $428,000 1,660 99% 17
Oakville 1,308 $939,826,702 $718,522 $608,500 2,369 97% 26
Peel Region 10,975 $4,829,281,576 $440,026 $399,900 19,589 98% 21
Brampton 4,715 $1,905,351,048 $404,104 $383,500 8,366 98% 21
Caledon 459 $258,323,166 $562,796 $483,000 865 97% 31
Mississauga 5,801 $2,665,607,362 $459,508 $411,000 10,358 98% 21
City of Toronto 19,302 $10,691,817,898 $553,923 $432,000 36,531 100% 22
! TURN PAGE FOR CITY OF TORONTO
TABLES OR CLICK HERE:
York Region 9,576 $5,699,752,107 $595,212 $540,000 16,800 99% 21
Aurora 549 $311,281,541 $566,997 $517,000 853 99% 19
E. Gwillimbury 180 $91,348,481 $507,492 $435,145 298 98% 31
Georgina 498 $156,900,900 $315,062 $292,500 800 98% 33
King 174 $142,054,754 $816,407 $709,000 328 95% 54
Markham 2,635 $1,601,565,320 $607,805 $557,000 4,683 100% 19
Newmarket 887 $397,378,503 $448,003 $425,000 1,244 100% 16
Richmond Hill 1,892 $1,264,173,192 $668,168 $605,000 3,533 99% 18
Vaughan 2,328 $1,469,593,991 $631,269 $580,000 4,264 99% 20
Whitchurch-Stouffville 433 $265,455,425 $613,061 $530,000 797 98% 30
Durham Region 6,065 $2,034,490,888 $335,448 $312,000 9,640 98% 26
Ajax 1,156 $427,555,011 $369,857 $355,000 1,721 99% 21
Brock 114 $30,287,640 $265,681 $235,000 265 96% 81
Clarington 999 $293,168,691 $293,462 $274,000 1,542 98% 29
Oshawa 1,431 $367,619,100 $256,897 $242,500 2,224 98% 26
Pickering 782 $309,062,368 $395,220 $368,250 1,344 99% 23
Scugog 165 $61,611,783 $373,405 $330,000 334 97% 43
Uxbridge 179 $87,091,761 $486,546 $445,000 353 97% 45
Whitby 1,239 $458,094,534 $369,729 $349,900 1,857 99% 20
Dufferin County 360 $124,084,440 $344,679 $320,000 506 98% 38
Orangeville 360 $124,084,440 $344,679 $320,000 506 98% 38
Simcoe County 1,226 $424,638,170 $346,361 $319,800 2,011 98% 45
Adjala-Tosorontio 83 $36,166,350 $435,739 $415,000 182 97% 78
Bradford West Gwillimbury 331 $136,048,858 $411,024 $383,000 448 98% 27
Essa 179 $52,712,566 $294,484 $260,000 324 98% 55
Innisfil 286 $90,128,848 $315,136 $296,500 568 97% 48
New Tecumseth 347 $109,581,548 $315,797 $290,000 489 98% 46
Page 3 July 2010
Market Watch, June 2012 5
6. Toronto Real Estate Board
ALL HOME TYPES, YEAR-TO-DATE 2012
SUMMARY OF EXISTING HOME TRANSACTIONS
CITY OF TORONTO MUNICIPAL BREAKDOWN
1 1 1 2 4 5
Number of Sales Dollar Volume Average Price Median Price New Listings Avg. SP/LP Avg. DOM
TREB Total 50,778 $25,661,477,064 $505,366 $424,900 90,635 99% 23
City of Toronto Total 19,302 $10,691,817,898 $553,923 $432,000 36,531 100% 22
Toronto West 5,029 $2,406,912,915 $478,607 $419,000 9,044 100% 24
Toronto W01 327 $202,745,143 $620,016 $567,000 691 104% 16
Toronto W02 532 $331,043,510 $622,262 $590,000 792 104% 14
Toronto W03 453 $176,896,351 $390,500 $380,000 649 100% 21
Toronto W04 473 $176,500,863 $373,152 $360,500 825 99% 27
Toronto W05 617 $213,139,790 $345,445 $367,500 1,132 98% 30
Toronto W06 688 $311,123,327 $452,214 $428,920 1,579 100% 29
Toronto W07 186 $129,262,943 $694,962 $640,000 267 102% 17
Toronto W08 958 $587,727,309 $613,494 $521,750 1,649 99% 23
Toronto W09 296 $126,272,450 $426,596 $455,500 540 99% 27
Toronto W10 499 $152,201,229 $305,012 $324,900 920 99% 25
Toronto Central 8,725 $5,850,141,969 $670,503 $465,000 18,081 100% 22
Toronto C01 2,233 $1,023,118,144 $458,181 $395,000 5,214 100% 25
Toronto C02 423 $425,435,501 $1,005,758 $814,000 913 100% 23
Toronto C03 328 $322,082,885 $981,960 $645,115 557 100% 19
Toronto C04 589 $659,143,238 $1,119,089 $1,037,000 1,049 101% 18
Toronto C06 197 $126,220,057 $640,711 $645,000 358 101% 20
Toronto C07 670 $401,766,679 $599,652 $484,750 1,400 100% 20
Toronto C08 854 $374,393,386 $438,400 $392,756 1,722 100% 23
Toronto C09 180 $238,965,956 $1,327,589 $928,250 328 98% 23
Toronto C10 403 $276,520,967 $686,156 $630,000 667 102% 15
Toronto C11 249 $164,655,400 $661,267 $360,000 408 101% 20
Toronto C12 260 $470,344,164 $1,809,016 $1,561,000 550 98% 28
Toronto C13 480 $285,582,084 $594,963 $457,000 821 102% 19
Toronto C14 972 $596,643,083 $613,830 $438,000 2,186 100% 22
Toronto C15 887 $485,270,425 $547,092 $425,000 1,908 101% 23
Toronto East 5,548 $2,434,763,014 $438,854 $416,050 9,406 101% 20
Toronto E01 521 $305,055,846 $585,520 $560,000 812 105% 13
Toronto E02 450 $298,570,446 $663,490 $597,250 745 102% 12
Toronto E03 604 $324,388,719 $537,067 $512,000 1,020 104% 14
Toronto E04 635 $223,922,321 $352,634 $379,000 1,096 100% 23
Toronto E05 573 $237,850,271 $415,096 $375,000 912 101% 18
Toronto E06 232 $116,314,693 $501,356 $425,500 432 101% 16
Toronto E07 542 $198,397,102 $366,046 $319,919 902 101% 26
Toronto E08 367 $144,998,683 $395,092 $385,000 638 99% 24
Toronto E09 681 $221,722,256 $325,583 $320,000 1,247 99% 25
Toronto E10 403 $181,878,337 $451,311 $432,500 614 100% 19
Toronto E11 540 $181,664,340 $336,415 $328,000 988 99% 22
Page 3 July 2010
Market Watch, June 2012 6
7. Toronto Real Estate Board
DETACHED HOUSES, JUNE 2012
Industrial Leasing
SUMMARY OF EXISTING HOME TRANSACTIONS
ALL TREB AREAS
Sales1 Dollar Volume1 Average Price1 Median Price1 New Listings2 Active Listings3 Avg. SP/LP 4 Avg. DOM5
TREB Total 4,689
- $2,975,883,848
- $634,652
- $542,000
- 8,006
- 9,814
- 99%
- 22
-
Halton Region 360 $249,772,382 $693,812 $573,250 647 947 98% 25
Burlington 53 $32,458,400 $612,423 $562,500 91 162 98% 23
Halton Hills 63 $31,756,200 $504,067 $479,000 107 157 99% 20
Milton 99 $55,275,189 $558,335 $539,900 186 223 99% 22
Oakville 145
- $130,282,593
- $898,501
- $715,000
- 263
- 405
- 97%
- 31
-
Peel Region 1,007 $573,335,824 $569,350 $528,000 1,909 2,168 98% 20
Brampton 492 $235,918,937 $479,510 $455,000 1,032 1,077 98% 20
Caledon 89 $51,689,050 $580,776 $533,000 124 261 97% 39
Mississauga 426
- $285,727,837
- $670,723
- $605,625
- 753
- 830
- 98%
- 17
-
City of Toronto 1,257 $1,010,214,296 $803,671 $615,000 2,084 2,112 100% 18
! TURN PAGE FOR CITY OF TORONTO
TABLES OR CLICK HERE:
- - - - - - - -
York Region 1,039 $749,329,507 $721,203 $668,500 1,879 2,385 98% 22
Aurora 66 $42,667,762 $646,481 $586,550 91 119 100% 16
E. Gwillimbury 26 $16,694,900 $642,112 $500,500 48 84 96% 47
Georgina 78 $24,450,350 $313,466 $296,500 109 236 97% 42
King 25 $19,930,500 $797,220 $680,000 57 128 96% 39
Markham 274 $222,039,031 $810,361 $730,000 481 463 99% 17
Newmarket 105 $54,828,710 $522,178 $495,100 144 147 99% 15
Richmond Hill 182 $147,543,488 $810,679 $737,400 433 482 98% 20
Vaughan 222 $177,330,305 $798,785 $720,500 421 530 98% 21
Whitchurch-Stouffville 61
- $43,844,461
- $718,762
- $590,000
- 95
- 196
- 97%
- 29
-
Durham Region 789 $303,818,139 $385,067 $362,000 1,172 1,539 98% 23
Ajax 146 $61,563,699 $421,669 $410,500 177 166 99% 17
Brock 24 $6,205,900 $258,579 $229,750 45 132 97% 51
Clarington 116 $38,771,300 $334,235 $313,250 159 248 98% 26
Oshawa 174 $48,427,351 $278,318 $277,000 289 339 98% 21
Pickering 95 $47,267,149 $497,549 $450,000 161 193 98% 22
Scugog 34 $12,582,800 $370,082 $345,500 49 126 97% 46
Uxbridge 44 $23,781,223 $540,482 $495,000 61 117 97% 36
Whitby 156
- $65,218,717
- $418,069
- $384,500
- 231
- 218
- 99%
- 15
-
Dufferin County 58 $23,854,200 $411,279 $363,750 72 86 98% 45
Orangeville 58
- $23,854,200
- $411,279
- $363,750
- 72
- 86
- 98%
- 45
-
Simcoe County 179 $65,559,500 $366,254 $330,000 243 577 97% 46
Adjala-Tosorontio 18 $7,947,500 $441,528 $421,000 34 89 97% 66
Bradford West Gwillimbury 30 $13,551,000 $451,700 $435,500 49 86 99% 29
Essa 28 $8,187,900 $292,425 $283,500 39 104 98% 69
Innisfil 55 $19,201,800 $349,124 $320,000 68 201 97% 41
New Tecumseth 48 $16,671,300 $347,319 $329,700 53 97 97% 42
Page 3 July 2010
Market Watch, June 2012 7
8. Toronto Real Estate Board
DETACHED HOUSES, JUNE 2012
Industrial Leasing
SUMMARY OF EXISTING HOME TRANSACTIONS
CITY OF TORONTO MUNICIPAL BREAKDOWN
Sales1 Dollar Volume1 Average Price1 Median Price1 New Listings2 Active Listings3 Avg. SP/LP 4 Avg. DOM5
TREB Total 4,689 $2,975,883,848 $634,652 $542,000 8,006 9,814 99% 22
City of Toronto Total 1,257 $1,010,214,296 $803,671 $615,000 2,084 2,112 100% 18
Toronto West 404 $257,090,988 $636,364 $550,000 605 587 100% 19
Toronto W01 19 $17,969,200 $945,747 $875,000 25 19 102% 15
Toronto W02 36 $29,124,700 $809,019 $745,000 52 39 103% 16
Toronto W03 53 $21,844,000 $412,151 $383,000 66 52 101% 18
Toronto W04 50 $25,222,300 $504,446 $453,750 76 97 99% 18
Toronto W05 24 $11,915,050 $496,460 $489,500 42 52 97% 36
Toronto W06 46 $24,696,759 $536,886 $493,500 64 64 102% 17
Toronto W07 30 $21,617,450 $720,582 $642,500 41 28 103% 14
Toronto W08 86 $75,414,452 $876,912 $710,000 111 121 98% 19
Toronto W09 25 $14,455,000 $578,200 $550,000 48 44 97% 17
Toronto W10 35 $14,832,077 $423,774 $420,000 80 71 99% 22
Toronto Central 380 $496,368,573 $1,306,233 $1,005,000 661 820 99% 19
Toronto C01 9 $8,237,000 $915,222 $865,000 11 10 108% 12
Toronto C02 18 $21,185,900 $1,176,994 $943,500 22 37 99% 27
Toronto C03 33 $39,295,923 $1,190,786 $775,000 53 68 99% 14
Toronto C04 74 $104,350,268 $1,410,139 $1,315,000 114 138 99% 22
Toronto C06 21 $16,323,138 $777,292 $703,000 37 35 99% 17
Toronto C07 42 $42,373,335 $1,008,889 $850,000 86 122 99% 20
Toronto C08 2 $1,756,000 $878,000 $878,000 6 4 105% 11
Toronto C09 14 $34,435,500 $2,459,679 $2,094,500 12 24 96% 22
Toronto C10 19 $20,408,400 $1,074,126 $891,000 26 19 106% 8
Toronto C11 12 $16,336,000 $1,361,333 $1,275,000 22 27 97% 16
Toronto C12 38 $94,315,000 $2,481,974 $1,980,000 59 110 96% 36
Toronto C13 35 $32,741,409 $935,469 $859,000 58 45 104% 13
Toronto C14 35 $39,524,500 $1,129,271 $970,000 78 106 99% 16
Toronto C15 28 $25,086,200 $895,936 $864,250 77 75 99% 14
Toronto East 473 $256,754,735 $542,822 $495,000 818 705 100% 15
Toronto E01 30 $20,391,213 $679,707 $661,100 43 27 102% 14
Toronto E02 19 $16,684,900 $878,153 $850,000 39 46 99% 15
Toronto E03 70 $42,263,065 $603,758 $566,393 124 104 102% 13
Toronto E04 59 $26,324,900 $446,185 $435,000 88 68 100% 18
Toronto E05 42 $26,338,980 $627,119 $587,500 71 49 102% 11
Toronto E06 34 $17,161,047 $504,737 $462,750 64 64 99% 22
Toronto E07 27 $15,261,388 $565,237 $528,000 56 56 100% 20
Toronto E08 37 $19,447,408 $525,606 $474,000 63 59 100% 14
Toronto E09 54 $22,733,249 $420,986 $415,000 93 88 100% 17
Toronto E10 62 $31,678,887 $510,950 $485,000 98 79 100% 13
Toronto E11 39 $18,469,698 $473,582 $476,000 79 65 98% 17
Page 3 July 2010
Market Watch, June 2012 8
9. Toronto Real Estate Board
SEMI-DETACHED HOUSES, JUNE 2012
Industrial Leasing
SUMMARY OF EXISTING HOME TRANSACTIONS
ALL TREB AREAS
Sales1 Dollar Volume1 Average Price1 Median Price1 New Listings2 Active Listings3 Avg. SP/LP 4 Avg. DOM5
TREB Total 1,048
- $483,455,189
- $461,312
- $428,500
- 1,609
- 1,236
- 100%
- 15
-
Halton Region 49 $20,683,150 $422,105 $418,000 69 55 99% 16
Burlington 7 $2,824,900 $403,557 $418,000 8 3 99% 14
Halton Hills 5 $1,906,500 $381,300 $383,000 8 3 100% 13
Milton 28 $11,580,450 $413,588 $415,500 39 37 99% 17
Oakville 9- $4,371,300
- $485,700
- $466,000
- 14
- 12
- 99%
- 14
-
Peel Region 376 $149,406,463 $397,358 $389,200 593 477 99% 16
Brampton 199 $73,286,387 $368,273 $360,000 321 277 99% 18
Caledon 4 $1,549,900 $387,475 $390,450 11 9 101% 10
Mississauga 173
- $74,570,176
- $431,041
- $436,800
- 261
- 191
- 100%
- 14
-
City of Toronto 403 $226,508,886 $562,057 $510,000 621 461 102% 13
! TURN PAGE FOR CITY OF TORONTO
TABLES OR CLICK HERE:
- - - - - - - -
York Region 144 $66,704,463 $463,225 $467,250 223 151 99% 15
Aurora 12 $5,076,800 $423,067 $414,950 17 7 100% 11
E. Gwillimbury - - - - - - - -
Georgina 2 $610,000 $305,000 $305,000 1 1 95% 17
King - - - - - - - -
Markham 35 $16,474,663 $470,705 $462,000 69 44 99% 13
Newmarket 23 $8,388,600 $364,722 $374,000 30 21 100% 16
Richmond Hill 16 $7,979,400 $498,713 $473,250 23 17 99% 18
Vaughan 49 $25,296,000 $516,245 $517,500 73 54 99% 18
Whitchurch-Stouffville 7- $2,879,000
- $411,286
- $405,000
- 10
- 7- 98%
- 12
-
Durham Region 62 $16,412,927 $264,725 $250,000 89 80 99% 16
Ajax 15 $4,937,350 $329,157 $334,000 23 16 100% 16
Brock - - - - - 1 - -
Clarington 2 $409,800 $204,900 $204,900 5 4 99% 16
Oshawa 29 $5,784,125 $199,453 $205,000 41 44 99% 19
Pickering 13 $4,501,152 $346,242 $350,000 17 13 100% 12
Scugog - - - - - - - -
Uxbridge - - - - - 1 - -
Whitby 3- $780,500
- $260,167
- $265,000
- 3- 1- 97%
- 16
-
Dufferin County 6 $1,431,900 $238,650 $250,500 9 6 99% 16
Orangeville 6
- $1,431,900
- $238,650
- $250,500
- 9
- 6
- 99%
- 16
-
Simcoe County 8 $2,307,400 $288,425 $266,950 5 6 98% 29
Adjala-Tosorontio - - - - - - - -
Bradford West Gwillimbury 5 $1,605,400 $321,080 $300,000 5 5 98% 19
Essa 1 $242,500 $242,500 $242,500 - - 100% 79
Innisfil - - - - - - - -
New Tecumseth 2 $459,500 $229,750 $229,750 - 1 96% 29
Page 3 July 2010
Market Watch, June 2012 9
10. Toronto Real Estate Board
SEMI-DETACHED HOUSES, JUNE 2012
Industrial Leasing
SUMMARY OF EXISTING HOME TRANSACTIONS
CITY OF TORONTO MUNICIPAL BREAKDOWN
Sales1 Dollar Volume1 Average Price1 Median Price1 New Listings2 Active Listings3 Avg. SP/LP 4 Avg. DOM5
TREB Total 1,048 $483,455,189 $461,312 $428,500 1,609 1,236 100% 15
City of Toronto Total 403 $226,508,886 $562,057 $510,000 621 461 102% 13
Toronto West 124 $60,652,767 $489,135 $440,450 169 158 102% 16
Toronto W01 13 $8,911,889 $685,530 $690,000 13 9 105% 11
Toronto W02 26 $15,507,600 $596,446 $595,500 34 22 106% 11
Toronto W03 32 $13,513,029 $422,282 $420,000 44 32 100% 12
Toronto W04 6 $2,574,100 $429,017 $435,000 9 12 100% 12
Toronto W05 41 $17,561,149 $428,321 $405,000 55 66 98% 20
Toronto W06 1 $497,000 $497,000 $497,000 9 11 102% 8
Toronto W07 - - - - - - - -
Toronto W08 - - - - - 1 - -
Toronto W09 3 $1,341,000 $447,000 $436,000 3 2 98% 50
Toronto W10 2 $747,000 $373,500 $373,500 2 3 98% 29
Toronto Central 124 $87,368,744 $704,587 $653,250 181 138 100% 14
Toronto C01 22 $16,898,205 $768,100 $800,000 37 25 100% 17
Toronto C02 23 $20,429,811 $888,253 $760,000 28 28 100% 15
Toronto C03 12 $7,307,000 $608,917 $469,000 17 12 101% 11
Toronto C04 4 $3,684,000 $921,000 $833,000 7 6 102% 10
Toronto C06 - - - - - - - -
Toronto C07 5 $2,683,500 $536,700 $540,000 7 10 102% 15
Toronto C08 3 $3,074,000 $1,024,667 $945,000 8 11 94% 34
Toronto C09 2 $2,067,000 $1,033,500 $1,033,500 4 5 96% 13
Toronto C10 14 $10,361,780 $740,127 $748,000 16 8 104% 8
Toronto C11 4 $2,658,750 $664,688 $665,125 7 2 100% 8
Toronto C12 2 $1,154,300 $577,150 $577,150 - - 101% 20
Toronto C13 7 $3,061,310 $437,330 $434,810 12 10 100% 20
Toronto C14 1 $662,000 $662,000 $662,000 2 1 120% 10
Toronto C15 25 $13,327,088 $533,084 $520,000 36 20 99% 12
Toronto East 155 $78,487,375 $506,370 $482,000 271 165 103% 10
Toronto E01 35 $20,668,057 $590,516 $571,000 67 39 105% 8
Toronto E02 37 $21,377,371 $577,767 $529,000 59 26 102% 9
Toronto E03 29 $15,340,247 $528,974 $516,700 54 25 103% 7
Toronto E04 11 $3,858,500 $350,773 $345,000 14 12 101% 14
Toronto E05 10 $4,433,600 $443,360 $443,150 13 9 101% 12
Toronto E06 4 $1,591,000 $397,750 $402,750 5 3 100% 13
Toronto E07 7 $2,929,800 $418,543 $409,000 19 19 102% 16
Toronto E08 - - - - - 1 - -
Toronto E09 2 $716,000 $358,000 $358,000 6 5 100% 14
Toronto E10 6 $2,102,400 $350,400 $345,500 8 5 100% 15
Toronto E11 14 $5,470,400 $390,743 $405,500 26 21 101% 14
Page 3 July 2010
Market Watch, June 2012 10
11. Toronto Real Estate Board
CONDOMINIUM TOWNHOUSES, JUNE 2012
Industrial Leasing
SUMMARY OF EXISTING HOME TRANSACTIONS
ALL TREB AREAS
Sales1 Dollar Volume1 Average Price1 Median Price1 New Listings2 Active Listings3 Avg. SP/LP 4 Avg. DOM5
TREB Total 746
- $249,851,738
- $334,922
- $319,950
- 1,171
- 1,316
- 99%
- 22
-
Halton Region 44 $13,400,000 $304,545 $292,000 65 61 99% 22
Burlington 17 $5,308,500 $312,265 $297,000 21 17 99% 28
Halton Hills 7 $1,660,900 $237,271 $219,000 9 7 99% 12
Milton 5 $1,238,900 $247,780 $252,000 3 1 100% 15
Oakville 15
- $5,191,700
- $346,113
- $340,000
- 32
- 36
- 100%
- 22
-
Peel Region 267 $83,442,814 $312,520 $310,800 420 431 98% 21
Brampton 64 $15,693,714 $245,214 $230,500 81 90 98% 27
Caledon - - - - 3 4 - -
Mississauga 203
- $67,749,100
- $333,739
- $329,000
- 336
- 337
- 99%
- 19
-
City of Toronto 265 $100,713,681 $380,052 $352,000 424 526 99% 21
! TURN PAGE FOR CITY OF TORONTO
TABLES OR CLICK HERE:
- - - - - - - -
York Region 85 $34,090,323 $401,063 $385,000 134 140 98% 25
Aurora 11 $5,107,000 $464,273 $330,000 10 12 93% 31
E. Gwillimbury - - - - - - - -
Georgina 1 $182,000 $182,000 $182,000 - 2 98% 45
King - - - - - - - -
Markham 40 $15,736,323 $393,408 $388,000 63 63 100% 19
Newmarket 7 $2,369,200 $338,457 $308,000 13 14 98% 21
Richmond Hill 16 $6,371,800 $398,238 $395,000 30 27 98% 22
Vaughan 9 $4,099,000 $455,444 $412,500 17 20 100% 21
Whitchurch-Stouffville 1- $225,000
- $225,000
- $225,000
- 1- 2- 100%
- 314
-
Durham Region 77 $16,613,670 $215,762 $219,500 116 147 98% 26
Ajax 13 $3,224,900 $248,069 $247,900 22 26 99% 18
Brock 1 $156,250 $156,250 $156,250 2 6 96% 23
Clarington 5 $1,023,000 $204,600 $162,000 8 12 97% 49
Oshawa 24 $4,048,700 $168,696 $162,000 34 53 98% 30
Pickering 21 $5,332,800 $253,943 $262,500 31 30 98% 17
Scugog - - - - - - - -
Uxbridge - - - - 2 6 - -
Whitby 13
- $2,828,020
- $217,540
- $213,000
- 17
- 14
- 98%
- 31
-
Dufferin County 6 $1,232,250 $205,375 $205,500 8 6 98% 22
Orangeville 6
- $1,232,250
- $205,375
- $205,500
- 8
- 6
- 98%
- 22
-
Simcoe County 2 $359,000 $179,500 $179,500 4 5 96% 47
Adjala-Tosorontio - - - - - - - -
Bradford West Gwillimbury - - - - 1 1 - -
Essa - - - - - - - -
Innisfil - - - - - - - -
New Tecumseth 2 $359,000 $179,500 $179,500 3 4 96% 47
Page 3 July 2010
Market Watch, June 2012 11
12. Toronto Real Estate Board
CONDOMINIUM TOWNHOUSES, JUNE 2012
Industrial Leasing
SUMMARY OF EXISTING HOME TRANSACTIONS
CITY OF TORONTO MUNICIPAL BREAKDOWN
Sales1 Dollar Volume1 Average Price1 Median Price1 New Listings2 Active Listings3 Avg. SP/LP 4 Avg. DOM5
TREB Total 746 $249,851,738 $334,922 $319,950 1,171 1,316 99% 22
City of Toronto Total 265 $100,713,681 $380,052 $352,000 424 526 99% 21
Toronto West 85 $28,661,550 $337,195 $299,000 101 123 99% 26
Toronto W01 9 $4,192,750 $465,861 $414,000 9 9 101% 15
Toronto W02 5 $2,029,000 $405,800 $398,000 9 4 101% 10
Toronto W03 4 $955,000 $238,750 $240,000 1 - 98% 13
Toronto W04 8 $2,304,500 $288,063 $272,000 13 14 97% 39
Toronto W05 25 $6,056,900 $242,276 $235,000 31 47 98% 35
Toronto W06 6 $2,634,800 $439,133 $439,900 6 8 99% 17
Toronto W07 1 $258,000 $258,000 $258,000 - 1 94% 47
Toronto W08 15 $6,772,400 $451,493 $401,000 13 10 100% 14
Toronto W09 4 $1,743,500 $435,875 $364,500 4 9 97% 30
Toronto W10 8 $1,714,700 $214,338 $229,250 15 21 96% 33
Toronto Central 93 $45,432,847 $488,525 $430,000 177 228 99% 18
Toronto C01 23 $10,549,559 $458,676 $421,100 39 49 101% 18
Toronto C02 4 $2,505,900 $626,475 $608,950 9 16 101% 6
Toronto C03 - - - - - 3 - -
Toronto C04 3 $1,745,000 $581,667 $635,000 2 1 96% 12
Toronto C06 - - - - - 2 - -
Toronto C07 8 $3,372,800 $421,600 $388,400 10 16 100% 14
Toronto C08 5 $2,724,400 $544,880 $636,500 17 20 100% 14
Toronto C09 - - - - 2 3 - -
Toronto C10 - - - - 6 8 - -
Toronto C11 2 $523,000 $261,500 $261,500 4 3 110% 7
Toronto C12 4 $3,066,000 $766,500 $706,500 9 19 95% 31
Toronto C13 4 $1,848,000 $462,000 $448,500 8 4 99% 10
Toronto C14 15 $8,335,200 $555,680 $478,000 26 32 99% 29
Toronto C15 25 $10,762,988 $430,520 $372,000 45 52 99% 16
Toronto East 87 $26,619,284 $305,969 $319,000 146 175 100% 21
Toronto E01 4 $1,760,900 $440,225 $431,950 7 5 101% 7
Toronto E02 4 $1,753,600 $438,400 $382,800 4 6 101% 10
Toronto E03 - - - - 3 5 - -
Toronto E04 15 $4,853,750 $323,583 $313,000 21 27 99% 16
Toronto E05 22 $7,002,188 $318,281 $328,444 41 34 101% 17
Toronto E06 - - - - - - - -
Toronto E07 8 $2,524,800 $315,600 $325,500 14 15 101% 16
Toronto E08 12 $3,534,060 $294,505 $319,500 10 16 99% 28
Toronto E09 5 $1,045,250 $209,050 $250,000 10 16 97% 48
Toronto E10 9 $1,868,650 $207,628 $218,900 8 12 99% 29
Toronto E11 8 $2,276,086 $284,511 $335,650 28 39 98% 22
Page 3 July 2010
Market Watch, June 2012 12