San Francisco Market Focus June 2013
•
0 gefällt mir•326 views

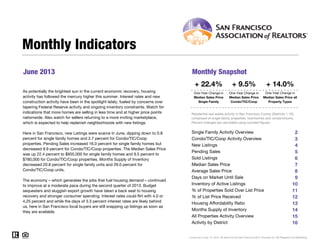
The document provides housing market statistics for San Francisco for the month of June 2013. It notes that median sales prices increased 22.4% for single family homes and 9.5% for condos from the previous year. New listings decreased slightly while pending sales increased 16% for single family and decreased 10% for condos. The housing market remains very strong despite low inventory and interest rates rising slightly from previous lows.

Empfohlen
Empfohlen
Weitere ähnliche Inhalte
Was ist angesagt?
Was ist angesagt? (20)
Andere mochten auch
Andere mochten auch (9)
Ähnlich wie San Francisco Market Focus June 2013
Ähnlich wie San Francisco Market Focus June 2013 (13)
Mehr von Ronny Budiutama
Mehr von Ronny Budiutama (20)
Kürzlich hochgeladen
Kürzlich hochgeladen (20)
San Francisco Market Focus June 2013
- 1. June 2013 Monthly Snapshot One-Year Change in One-Year Change in Median Sales Price Single Family Median Sales Price Condo/TIC/Coop 2 3 4 5 6 7 8 9 10 11 12 13 14 15 16 Monthly Indicators + 22.4% + 9.5% + 14.0% One-Year Change inAs potentially the brightest sun in the current economic recovery, housing activity has followed the mercury higher this summer. Interest rates and new construction activity have been in the spotlight lately, fueled by concerns over tapering Federal Reserve activity and ongoing inventory constraints. Watch for indications that more homes are selling in less time and at higher price points nationwide. Also watch for sellers returning to a more inviting marketplace, which is expected to help replenish neighborhoods with new listings. Here in San Francisco, new Listings were scarce in June, dipping down to 0.8 percent for single family homes and 2.7 percent for Condo/TIC/Coop properties. Pending Sales increased 16.0 percent for single family homes but decreased 9.9 percent for Condo/TIC/Coop properties. The Median Sales Price was up 22.4 percent to $955,000 for single family homes and 9.5 percent to $780,000 for Condo/TIC/Coop properties. Months Supply of Inventory decreased 20.8 percent for single family units and 29.0 percent for Condo/TIC/Coop units. The economy – which generates the jobs that fuel housing demand – continued to improve at a moderate pace during the second quarter of 2013. Budget sequesters and sluggish export growth have taken a back seat to housing recovery and stronger consumer spending. Interest rates could flirt with 4.0 or 4.25 percent and while the days of 3.3 percent interest rates are likely behind us, here in San Francisco local buyers are still snapping up listings as soon as they are available. Median Sales Price all Property Types Residential real estate activity in San Francisco County (Districts 1-10), comprised of single-family properties, townhomes and condominiums. Percent changes are calculated using rounded figures. Single Family Activity Overview Months Supply of Inventory Current as of July 12, 2013. All data from the San Francisco MLS. Powered by 10K Research and Marketing. Condo/TIC/Coop Activity Overview Inventory of Active Listings % of Properties Sold Over List Price % of List Price Received Housing Affordability Ratio All Properties Activity Overview New Listings Pending Sales Sold Listings Median Sales Price Average Sales Price Days on Market Until Sale Activity by District
- 2. Single Family Activity Overview Key metrics by report month and for year-to-date (YTD) starting from the first of the year. Key Metrics Historical Sparkbars 6-2012 6-2013 Percent Change YTD 2012 YTD 2013 Percent Change Current as of July 12, 2013. All data from the San Francisco MLS. Powered by 10K Research and Marketing. | Click for Cover Page | 2 Months Supply 2.4 1.9 - 20.8% -- -- -- Affordability Ratio 67 52 - 22.4% % of List Price Received 104.8% 112.6% + 7.4% 102.9% 72 76.4% + 44.7% + 7.5% 54 - 25.0% 110.6% % of Properties Sold Over List Price 64.6% 80.9% + 25.2% 52.8% Active Listings 517 411 - 20.5% -- Average Sales Price $1,159,940 $1,183,735 + 2.1% $1,049,217 Days on Market 59 34 - 42.4% 60 37 - 38.3% $1,280,699 -- -- Median Sales Price $780,000 $955,000 + 22.4% $730,000 Sold Listings 268 257 - 4.1% 1,260 New Listings 258 256 - 0.8% 1,573 Pending Sales 237 275 + 16.0% - 0.9%1,308 1,296 - 1.0%1,557 1,212 - 3.8% $915,000 + 25.3% + 22.1% 6-2010 6-2011 6-2012 6-2013 6-2010 6-2011 6-2012 6-2013 6-2010 6-2011 6-2012 6-2013 6-2010 6-2011 6-2012 6-2013 6-2010 6-2011 6-2012 6-2013 6-2010 6-2011 6-2012 6-2013 6-2010 6-2011 6-2012 6-2013 6-2010 6-2011 6-2012 6-2013 6-2010 6-2011 6-2012 6-2013 6-2010 6-2011 6-2012 6-2013 6-2010 6-2011 6-2012 6-2013
- 3. Condo/TIC/Coop Activity Overview Key metrics by report month and for year-to-date (YTD) starting from the first of the year. Key Metrics Historical Sparkbars 6-2012 6-2013 Percent Change YTD 2012 YTD 2013 Percent Change Current as of July 12, 2013. All data from the San Francisco MLS. Powered by 10K Research and Marketing. | Click for Cover Page | 3 Months Supply 3.1 2.2 - 29.0% -- -- -- Affordability Ratio 73 63 - 13.7% % of List Price Received 101.4% 107.1% + 5.6% 100.8% 77 63.3% + 55.9% + 4.4% 61 - 20.8% 105.2% % of Properties Sold Over List Price 48.2% 72.3% + 50.0% 40.6% Active Listings 723 585 - 19.1% -- Average Sales Price $824,158 $938,085 + 13.8% $772,352 Days on Market 57 39 - 31.6% 70 $807,000 + 19.6% + 21.7% 43 - 38.6% $940,269 -- -- Sold Listings 340 264 - 22.4% 1,542 1,573 + 2.0% Median Sales Price $712,500 $780,000 + 9.5% $675,000 + 4.1% Pending Sales 314 283 - 9.9% 1,610 1,643 + 2.0% New Listings 334 325 - 2.7% 1,992 2,073 6-2010 6-2011 6-2012 6-2013 6-2010 6-2011 6-2012 6-2013 6-2010 6-2011 6-2012 6-2013 6-2010 6-2011 6-2012 6-2013 6-2010 6-2011 6-2012 6-2013 6-2010 6-2011 6-2012 6-2013 6-2010 6-2011 6-2012 6-2013 6-2010 6-2011 6-2012 6-2013 6-2010 6-2011 6-2012 6-2013 6-2010 6-2011 6-2012 6-2013 6-2010 6-2011 6-2012 6-2013
- 4. New Listings New Listings Single Family Year-Over-Year Change Condo/TIC/ Coop Year-Over-Year Change Jul-2012 255 -22.3% 269 +0.7% Aug-2012 254 -11.8% 313 +6.1% Sep-2012 317 -20.2% 387 -5.6% Oct-2012 287 +11.2% 303 +26.8% Nov-2012 181 +22.3% 211 +36.1% Dec-2012 102 -12.8% 113 +1.8% Jan-2013 204 -17.7% 301 -1.0% Feb-2013 211 -17.9% 316 +2.9% Mar-2013 254 -12.1% 365 +11.3% Apr-2013 301 +14.9% 389 +13.1% May-2013 331 +27.8% 377 +0.5% Jun-2013 256 -0.8% 325 -2.7% 12-Month Avg 246 -5.0% 306 +5.8% Historical New Listings by Month Current as of July 12, 2013. All data from the San Francisco MLS. Powered by 10K Research and Marketing. | Click for Cover Page | 4 A count of the properties that have been newly listed on the market in a given month. 349 388 258 334 256 325 Single Family Condo/TIC/Coop June 0 100 200 300 400 500 600 700 1-2005 1-2006 1-2007 1-2008 1-2009 1-2010 1-2011 1-2012 1-2013 Single Family Condo/TIC/Coop 1,823 2,342 1,573 1,992 1,557 2,073 Single Family Condo/TIC/Coop Year to Date 2011 2012 2013 - 2.7%- 13.9%- 0.8%- 26.1% - 14.9%- 1.0%- 13.7% + 4.1% 2011 2012 2013 2011 2012 2013 2011 2012 2013 + 3.9% - 8.4% - 10.1%- 14.0%
- 5. Pending Sales Pending Sales Single Family Year-Over-Year Change Condo/TIC/ Coop Year-Over-Year Change Jul-2012 225 +10.8% 286 +27.1% Aug-2012 225 0.0% 289 +27.9% Sep-2012 185 -5.1% 218 +16.6% Oct-2012 287 +27.0% 276 +37.3% Nov-2012 250 +14.7% 270 +21.1% Dec-2012 170 -1.7% 202 +22.4% Jan-2013 159 -6.5% 174 +6.7% Feb-2013 149 -21.6% 218 -0.5% Mar-2013 206 -10.4% 303 +9.0% Apr-2013 241 +2.1% 308 -3.8% May-2013 266 +8.6% 357 +13.0% Jun-2013 275 +16.0% 283 -9.9% 12-Month Avg 220 +3.5% 265 +12.2% Historical Pending Sales by Month A count of the properties on which offers have been accepted in a given month. Current as of July 12, 2013. All data from the San Francisco MLS. Powered by 10K Research and Marketing. | Click for Cover Page | 5 248 239237 314 275 283 Single Family Condo/TIC/Coop June 0 100 200 300 400 1-2005 1-2006 1-2007 1-2008 1-2009 1-2010 1-2011 1-2012 1-2013 Single Family Condo/TIC/Coop 1,245 1,3491,308 1,610 1,296 1,643 Single Family Condo/TIC/Coop Year to Date 2011 2012 2013 - 9.9%+ 31.4%+ 16.0%- 4.4% + 19.3%- 0.9%+ 5.1% + 2.0% 2011 2012 2013 2011 2012 2013 2011 2012 2013 + 11.2% + 5.3% + 9.3%+ 3.0%
- 6. Sold Listings Sold Listings Single Family Year-Over-Year Change Condo/TIC/ Coop Year-Over-Year Change Jul-2012 216 +5.4% 276 +16.0% Aug-2012 241 +14.8% 322 +42.5% Sep-2012 179 -15.2% 228 +14.6% Oct-2012 255 +26.9% 275 +47.8% Nov-2012 271 +16.3% 269 +29.3% Dec-2012 208 -10.0% 249 +25.1% Jan-2013 160 +23.1% 155 -3.7% Feb-2013 129 -29.1% 196 +8.3% Mar-2013 206 -7.6% 282 +6.0% Apr-2013 218 -1.4% 303 +2.7% May-2013 242 +2.5% 373 +24.7% Jun-2013 257 -4.1% 264 -22.4% 12-Month Avg 215 +1.2% 266 +14.1% Historical Sold Listings by Month A count of the actual sales that closed in a given month. Current as of July 12, 2013. All data from the San Francisco MLS. Powered by 10K Research and Marketing. | Click for Cover Page | 6 265 238 268 340 257 264 Single Family Condo/TIC/Coop June 0 100 200 300 400 1-2005 1-2006 1-2007 1-2008 1-2009 1-2010 1-2011 1-2012 1-2013 Single Family Condo/TIC/Coop 1,184 1,311 1,260 1,542 1,212 1,573 Single Family Condo/TIC/Coop Year to Date 2011 2012 2013 - 22.4%+ 42.9%- 4.1%+ 1.1% + 17.6%- 3.8%+ 6.4% + 2.0% 2011 2012 2013 2011 2012 2013 2011 2012 2013 + 14.7% + 3.9% + 9.5%- 2.9%
- 7. Median Sales Price Median Sales Price Single Family Year-Over-Year Change Condo/TIC/ Coop Year-Over-Year Change Jul-2012 $759,000 +3.3% $690,000 +15.0% Aug-2012 $765,000 +9.9% $727,500 +16.4% Sep-2012 $725,000 +11.1% $776,000 +34.4% Oct-2012 $830,000 +11.7% $760,000 +17.9% Nov-2012 $810,000 +20.0% $775,000 +26.5% Dec-2012 $836,250 +37.1% $700,000 +12.0% Jan-2013 $746,500 +17.6% $765,000 +26.4% Feb-2013 $800,500 +26.1% $750,000 +15.6% Mar-2013 $920,000 +29.0% $822,500 +31.1% Apr-2013 $1,000,000 +31.6% $845,250 +19.9% May-2013 $1,030,000 +32.4% $830,000 +18.6% Jun-2013 $955,000 +22.4% $780,000 +9.5% 12-Month Avg* $850,000 +20.6% $775,000 +19.4% Historical Median Sales Price by Month Point at which half of the sales sold for more and half sold for less, not accounting for seller concessions, in a given month. * Median Sales Price for all properties from July 2012 through June 2013. This is not the average of the individual figures above. Current as of July 12, 2013. All data from the San Francisco MLS. Powered by 10K Research and Marketing. | Click for Cover Page | 7 $743,450 $637,500 $780,000 $712,500 $955,000 $780,000 Single Family Condo/TIC/Coop June $500,000 $600,000 $700,000 $800,000 $900,000 $1,000,000 $1,100,000 1-2005 1-2006 1-2007 1-2008 1-2009 1-2010 1-2011 1-2012 1-2013 Single Family Condo/TIC/Coop $698,000 $640,000 $730,000 $675,000 $915,000 $807,000 Single Family Condo/TIC/Coop Year to Date 2011 2012 2013 + 9.5%+ 11.8%+ 22.4%+ 4.9% + 5.5%+ 25.3%+ 4.6% + 19.6% 2011 2012 2013 2011 2012 2013 2011 2012 2013 - 7.1% - 7.3% - 1.5%- 6.3%
- 8. Average Sales Price Average Sales Price Single Family Year-Over-Year Change Condo/TIC/ Coop Year-Over-Year Change Jul-2012 $1,180,886 +15.3% $779,219 +14.6% Aug-2012 $989,681 +6.5% $806,332 +15.2% Sep-2012 $936,072 +9.6% $898,376 +34.9% Oct-2012 $1,296,224 +31.2% $888,741 +26.8% Nov-2012 $1,116,985 +1.8% $972,981 +24.1% Dec-2012 $1,388,972 +68.9% $857,948 +3.9% Jan-2013 $913,891 +15.8% $836,342 +17.6% Feb-2013 $1,166,453 +7.4% $873,813 +18.2% Mar-2013 $1,369,131 +44.8% $953,615 +29.0% Apr-2013 $1,376,069 +30.0% $975,623 +28.3% May-2013 $1,525,431 +35.3% $981,110 +21.5% Jun-2013 $1,183,735 +2.1% $938,085 +13.8% 12-Month Avg* $1,214,341 +21.4% $901,736 +20.1% Historical Average Sales Price by Month Average sales price for all closed sales, not accounting for seller concessions, in a given month. * Average Sales Price for all properties from July 2012 through June 2013. This is not the average of the individual figures above. Current as of July 12, 2013. All data from the San Francisco MLS. Powered by 10K Research and Marketing. | Click for Cover Page | 8 $931,963 $752,701 $1,159,940 $824,158 $1,183,735 $938,085 Single Family Condo/TIC/Coop June $600,000 $800,000 $1,000,000 $1,200,000 $1,400,000 $1,600,000 1-2005 1-2006 1-2007 1-2008 1-2009 1-2010 1-2011 1-2012 1-2013 Single Family Condo/TIC/Coop $944,024 $758,865 $1,049,217 $772,352 $1,280,699 $940,269 Single Family Condo/TIC/Coop Year to Date 2011 2012 2013 + 13.8%+ 9.5%+ 2.1%+ 24.5% + 1.8%+ 22.1%+ 11.1% + 21.7% 2011 2012 2013 2011 2012 2013 2011 2012 2013 - 14.4% - 6.8% + 2.9%+ 1.2%
- 9. Days on Market Until Sale Days on Market Single Family Year-Over-Year Change Condo/TIC/ Coop Year-Over-Year Change Jul-2012 47 -24.2% 59 -21.3% Aug-2012 49 -24.6% 54 -36.5% Sep-2012 46 -29.2% 52 -35.8% Oct-2012 45 -16.7% 55 -27.6% Nov-2012 42 -26.3% 51 -37.8% Dec-2012 48 -23.8% 62 -27.1% Jan-2013 47 -42.0% 64 -34.0% Feb-2013 41 -34.9% 49 -47.9% Mar-2013 38 -40.6% 42 -37.3% Apr-2013 35 -35.2% 41 -41.4% May-2013 31 -34.0% 36 -36.8% Jun-2013 34 -42.4% 39 -31.6% 12-Month Avg* 42 -30.7% 49 -34.0% Historical Days on Market Until Sale by Month Average number of days between when a property is listed and when an offer is accepted in a given month. * Days on Market for all properties from July 2012 through June 2013. This is not the average of the individual figures above. Current as of July 12, 2013. All data from the San Francisco MLS. Powered by 10K Research and Marketing. | Click for Cover Page | 9 59 75 59 57 34 39 Single Family Condo/TIC/Coop June 20 40 60 80 100 120 1-2005 1-2006 1-2007 1-2008 1-2009 1-2010 1-2011 1-2012 1-2013 Single Family Condo/TIC/Coop 66 79 60 70 37 43 Single Family Condo/TIC/Coop Year to Date 2011 2012 2013 - 31.6%- 24.0%- 42.4%0.0% - 11.4%- 38.3%- 9.1% - 38.6% 2011 2012 2013 2011 2012 2013 2011 2012 2013 0.0% + 15.8% + 6.8%+ 2.7%
- 10. Inventory of Active Listings Active Listings Single Family Year-Over-Year Change Condo/TIC/ Coop Year-Over-Year Change Jul-2012 503 -37.7% 672 -35.4% Aug-2012 499 -34.9% 632 -35.4% Sep-2012 593 -33.0% 753 -31.8% Oct-2012 540 -35.3% 716 -31.2% Nov-2012 438 -34.5% 603 -29.8% Dec-2012 311 -37.2% 410 -35.3% Jan-2013 330 -38.2% 490 -32.1% Feb-2013 372 -34.3% 563 -27.5% Mar-2013 396 -32.3% 595 -21.9% Apr-2013 432 -25.3% 632 -15.1% May-2013 462 -15.5% 602 -20.5% Jun-2013 411 -20.5% 585 -19.1% 12-Month Avg* 441 -32.1% 604 -28.5% Historical Inventory of Active Listings by Month The number of properties available for sale in active status at the end of a given month. * Active Listings for all properties from July 2012 through June 2013. This is not the average of the individual figures above. Current as of July 12, 2013. All data from the San Francisco MLS. Powered by 10K Research and Marketing. | Click for Cover Page | 10 777 1,153 517 723 411 585 Single Family Condo/TIC/Coop June 200 400 600 800 1,000 1,200 1,400 1,600 1-2005 1-2006 1-2007 1-2008 1-2009 1-2010 1-2011 1-2012 1-2013 Single Family Condo/TIC/Coop 2011 2012 2013 - 19.1%- 37.3%- 20.5%- 33.5% 2011 2012 2013 - 8.7% - 12.7%
- 11. % of Properties Sold Over List Price % of Properties Sold Over List Price Single Family Year-Over-Year Change Condo/TIC/ Coop Year-Over-Year Change Jul-2012 63.4% +75.6% 42.8% +67.2% Aug-2012 66.0% +73.2% 45.7% +88.1% Sep-2012 68.7% +64.7% 53.1% +164.2% Oct-2012 65.5% +51.3% 60.7% +156.1% Nov-2012 66.8% +38.9% 54.3% +91.2% Dec-2012 61.5% +65.3% 46.6% +97.5% Jan-2013 64.4% +104.4% 39.4% +62.8% Feb-2013 72.7% +78.6% 54.6% +70.6% Mar-2013 75.2% +62.1% 63.1% +52.4% Apr-2013 80.7% +31.2% 67.3% +77.1% May-2013 78.5% +34.2% 68.4% +43.1% Jun-2013 80.9% +25.2% 72.3% +50.0% 12-Month Avg 70.5% +50.9% 56.7% +70.3% Historical % of Properties Sold Over List Price by Month Percentage found when dividing the number of properties sold by properties sold over its original list price, not accounting for seller concessions. * % of Properties Sold Over List Price for all properties from July 2012 through June 2013. This is not the average of the individual figures above. Current as of July 12, 2013. All data from the San Francisco MLS. Powered by 10K Research and Marketing. | Click for Cover Page | 11 40.0% 21.8% 64.6% 48.2% 80.9% 72.3% Single Family Condo/TIC/Coop June 0.0% 20.0% 40.0% 60.0% 80.0% 100.0% 1-2005 1-2006 1-2007 1-2008 1-2009 1-2010 1-2011 1-2012 1-2013 Single Family Condo/TIC/Coop 38.2% 22.5% 52.8% 40.6% 76.4% 63.3% Single Family Condo/TIC/Coop Year to Date 2011 2012 2013 + 50.0%+ 121.1%+ 25.2%+ 61.5% + 80.4%+ 44.7%+ 38.2% + 55.9% 2011 2012 2013 2011 2012 2013 2011 2012 2013 - 15.3% - 21.6% - 8.5%- 26.8%
- 12. % of List Price Received % of List Price Received Single Family Year-Over-Year Change Condo/TIC/ Coop Year-Over-Year Change Jul-2012 105.5% +5.7% 101.6% +2.9% Aug-2012 105.8% +5.6% 102.0% +3.8% Sep-2012 106.9% +6.1% 102.2% +4.0% Oct-2012 105.2% +4.4% 103.6% +5.0% Nov-2012 106.5% +5.4% 102.5% +4.0% Dec-2012 104.7% +4.0% 101.7% +3.4% Jan-2013 106.2% +6.8% 101.2% +2.5% Feb-2013 108.4% +8.0% 103.8% +4.3% Mar-2013 110.0% +8.1% 104.9% +4.2% Apr-2013 112.0% +8.1% 105.7% +4.9% May-2013 111.7% +6.5% 106.0% +4.0% Jun-2013 112.6% +7.4% 107.1% +5.6% 12-Month Avg* 108.0% +6.2% 103.7% +4.0% Historical % of List Price Received by Month Percentage found when dividing a property’s sales price by its most recent list price, then taking the average for all properties sold in a given month, not accounting for seller concessions. * % of List Price Received for all properties from July 2012 through June 2013. This is not the average of the individual figures above. Current as of July 12, 2013. All data from the San Francisco MLS. Powered by 10K Research and Marketing. | Click for Cover Page | 12 100.0% 98.5% 104.8% 101.4% 112.6% 107.1% Single Family Condo/TIC/Coop June 99.7% 98.2% 102.9% 100.8% 110.6% 105.2% Single Family Condo/TIC/Coop Year to Date 95.0% 100.0% 105.0% 110.0% 115.0% 1-2005 1-2006 1-2007 1-2008 1-2009 1-2010 1-2011 1-2012 1-2013 Single Family Condo/TIC/Coop 2011 2012 2013 + 5.6%+ 2.9%+ 7.4%+ 4.8% 2011 2012 2013 - 0.6% - 0.7% 2011 2012 2013 + 4.4%+ 2.6%+ 7.5%+ 3.2% 2011 2012 2013 - 1.5% - 0.3%
- 13. Housing Affordability Ratio Affordability Ratio Single Family Year-Over-Year Change Condo/TIC/ Coop Year-Over-Year Change Jul-2012 70 +7.7% 77 -2.5% Aug-2012 69 -2.8% 73 -6.4% Sep-2012 74 -3.9% 70 -18.6% Oct-2012 65 -3.0% 71 -7.8% Nov-2012 67 -9.5% 70 -13.6% Dec-2012 66 -19.5% 78 -2.5% Jan-2013 73 -7.6% 72 -13.3% Feb-2013 67 -16.3% 71 -9.0% Mar-2013 59 -16.9% 65 -18.8% Apr-2013 55 -19.1% 65 -11.0% May-2013 51 -23.9% 63 -14.9% Jun-2013 52 -22.4% 63 -13.7% 12-Month Avg* 64 -28.0% 72 -19.7% Historical Housing Affordability Ratio by Month This index measures housing affordability for the region. An index of 120 means the median household income is 120% of what is necessary to qualify for the median-priced home under prevailing interest rates. A higher number means greater affordability. * Affordability Ratio for all properties from July 2012 through June 2013. This is not the average of the individual figures above. Current as of July 12, 2013. All data from the San Francisco MLS. Powered by 10K Research and Marketing. | Click for Cover Page | 13 65 75 67 73 52 63 Single Family Condo/TIC/Coop June 30 40 50 60 70 80 90 1-2005 1-2006 1-2007 1-2008 1-2009 1-2010 1-2011 1-2012 1-2013 Single Family Condo/TIC/Coop 2011 2012 2013 - 13.7%- 2.7%- 22.4%+ 3.1% 2011 2012 2013 + 14.0% + 13.6% 69 75 72 77 54 61 Single Family Condo/TIC/Coop Year to Date 2011 2012 2013 - 20.8%+ 2.7%- 25.0%+ 4.3% 2011 2012 2013 + 15.0% + 8.7%
- 14. Months Supply of Inventory Months Supply Single Family Year-Over-Year Change Condo/TIC/ Coop Year-Over-Year Change Jul-2012 2.3 -42.5% 2.8 -44.0% Aug-2012 2.3 -39.5% 2.6 -43.5% Sep-2012 2.8 -34.9% 3.0 -42.3% Oct-2012 2.5 -37.5% 2.8 -42.9% Nov-2012 2.0 -37.5% 2.3 -42.5% Dec-2012 1.4 -41.7% 1.6 -46.7% Jan-2013 1.5 -42.3% 1.9 -44.1% Feb-2013 1.7 -37.0% 2.1 -41.7% Mar-2013 1.8 -35.7% 2.2 -37.1% Apr-2013 2.0 -25.9% 2.4 -27.3% May-2013 2.1 -19.2% 2.2 -33.3% Jun-2013 1.9 -20.8% 2.2 -29.0% 12-Month Avg* 2.0 -35.0% 2.3 -40.0% Historical Months Supply of Inventory by Month The inventory of homes for sale at the end of a given month, divided by the average monthly pending sales from the last 12 months. * Months Supply for all properties from July 2012 through June 2013. This is not the average of the individual figures above. Current as of July 12, 2013. All data from the San Francisco MLS. Powered by 10K Research and Marketing. | Click for Cover Page | 14 3.9 5.6 2.4 3.1 1.9 2.2 Single Family Condo/TIC/Coop June 0.0 2.0 4.0 6.0 8.0 10.0 1-2005 1-2006 1-2007 1-2008 1-2009 1-2010 1-2011 1-2012 1-2013 Single Family Condo/TIC/Coop 2011 2012 2013 - 29.0%- 44.6%- 20.8%- 38.5% 2011 2012 2013 - 7.1% - 9.7%
- 15. All Properties Activity Overview Key metrics by report month and for year-to-date (YTD) starting from the first of the year. Key Metrics Historical Sparkbars 6-2012 6-2013 Percent Change YTD 2012 YTD 2013 Percent Change Current as of July 12, 2013. All data from the San Francisco MLS. Powered by 10K Research and Marketing. | Click for Cover Page | 15 Months Supply 2.8 2.1 - 25.0% -- -- -- Affordability Ratio 55 47 - 14.0% % of List Price Received 102.9% 109.8% + 6.7% 101.7% 59 69.0% + 49.7% + 5.7% 46 - 22.5% 107.5% % of Properties Sold Over List Price 55.4% 76.6% + 38.3% 46.1% Active Listings 1,240 996 - 19.7% -- Average Sales Price $972,167 $1,059,260 + 9.0% $896,798 Days on Market 58 37 - 36.2% 65 $849,000 + 21.3% + 21.4% 40 - 38.5% $1,088,351 -- -- Sold Listings 608 521 - 14.3% 2,802 2,785 - 0.6% Median Sales Price $755,000 $861,000 + 14.0% $700,000 + 1.8% Pending Sales 551 558 + 1.3% 2,918 2,939 + 0.7% New Listings 592 581 - 1.9% 3,565 3,630 6-2010 6-2011 6-2012 6-2013 6-2010 6-2011 6-2012 6-2013 6-2010 6-2011 6-2012 6-2013 6-2010 6-2011 6-2012 6-2013 6-2010 6-2011 6-2012 6-2013 6-2010 6-2011 6-2012 6-2013 6-2010 6-2011 6-2012 6-2013 6-2010 6-2011 6-2012 6-2013 6-2010 6-2011 6-2012 6-2013 6-2010 6-2011 6-2012 6-2013 6-2010 6-2011 6-2012 6-2013
- 16. Activity by District SF District 1: Northwest (Sea Cliff, Lake, Jordan Park / Laurel Heights, Outer Richmond, Central Richmond, Inner Richmond, Lone Mountain) SF District 2: Central West (Outer Sunset, Central Sunset, Inner Sunset, Outer Parkside, Parkside, Inner Parkside, Golden Gate Heights) SF District 3: Southwest (Pine Lake Park, Lake Shore, Merced Manor, Stonestown, Lakeside, Merced Heights, Ingleside, Ingleside Heights, Oceanview) SF District 4: Twin Peaks W (Forest Hill (& Ext), W Portal, St Francis Wd, Balboa Terr, Mt Dav Manor, Ingleside Terr, Monterey Hts, Wstwd Pk & H'lnds, Shrwd Fst, Miraloma Pk, Dmnd Hts, Mdtwn Terr) SF District 5: Central (Haight Ashbury, Cole Vly / Prnssus Hts, Clarndn Hts, Corona Hts, Twin Pks, Glen Pk, Noe Vly, Eureka Vly / Dolores Hts, Mission Dolores, Duboce Trngl, Buena Vista / Ashbury Hts) SF District 6: Central North (Lower Pacific Heights, Anza Vista, Western Addition, North Panhandle, Alamo Square, Hayes Valley) SF District 7: North (Marina, Cow Hollow, Presidio Heights, Pacific Heights) SF District 8: Northeast (North Waterfront, North Beach, Russian Hill, Telegraph Hill, Nob Hill, Financial District / Barbary Coast, Downtown, Van Ness / Civic Center, Tenderloin) SF District 9: Central East (Yerba Buena, South Beach, South of Market, Mission Bay, Inner Mission, Potrero Hill, Central Waterfront / Dogpatch, Bernal Heights) SF District 10: Southeast (Outer Mission, Mission Terr, Excelsior, Portola, Bayview, Silver Terr, Hunters Pt, Candlestick Pt, Bayview Hts, Little Hollywood, Visitation Vly, Crocker Amazon) 6-2012 6-2013 + / – 6-2012 6-2013 + / – 6-2012 6-2013 + / – 6-2012 6-2013 + / – 6-2012 6-2013 + / – Single Family 1 SF District 1 23 26 +13.0% 25 23 -8.0% $828,000 $1,330,000 +60.6% 47 45 -2.7% 2.3 2.1 -8.3% 2 SF District 2 29 45 +55.2% 43 46 +7.0% $745,000 $832,500 +11.7% 50 32 -35.6% 1.6 2.0 +28.6% 3 SF District 3 19 22 +15.8% 28 17 -39.3% $575,000 $802,000 +39.5% 78 38 -51.6% 1.7 2.3 +35.8% 4 SF District 4 29 24 -17.2% 52 34 -34.6% $840,000 $1,135,500 +35.2% 75 30 -60.6% 2.4 1.1 -53.5% 5 SF District 5 51 31 -39.2% 86 44 -48.8% $1,262,500 $1,530,000 +21.2% 31 29 -7.4% 2.3 1.3 -44.2% 6 SF District 6 9 3 -66.7% 40 2 -95.0% $1,425,000 $2,830,000 +98.6% 29 25 -14.3% 3.8 1.2 -68.3% 7 SF District 7 12 10 -16.7% 62 8 -87.1% $2,961,500 $2,950,000 -0.4% 60 31 -48.7% 4.0 2.1 -45.8% 8 SF District 8 3 2 -33.3% 60 4 -93.3% $4,945,000 $2,375,000 -52.0% 49 30 -39.8% 6.5 3.1 -52.4% 9 SF District 9 29 21 -27.6% 130 23 -82.3% $808,500 $1,115,000 +37.9% 62 33 -46.7% 2.8 1.5 -46.2% 10 SF District 10 54 72 +33.3% 61 56 -8.2% $450,000 $630,500 +40.1% 71 40 -44.0% 2.7 2.4 -12.7% Condo/TIC/Coop 1 SF District 1 17 23 +35.3% 21 11 -47.6% $792,000 $882,000 +11.4% 55 24 -55.6% 3.2 2.7 -17.1% 2 SF District 2 4 11 +175.0% 8 4 -50.0% $696,500 $545,000 -21.8% 32 98 +202.7% 4.3 3.6 -18.1% 3 SF District 3 2 4 +100.0% 3 1 -66.7% $265,000 $359,000 +35.5% 172 10 -94.2% 2.9 2.3 -21.0% 4 SF District 4 3 6 +100.0% 6 4 -33.3% $499,500 $685,000 +37.1% 106 44 -59.0% 2.9 2.0 -31.8% 5 SF District 5 44 43 -2.3% 50 47 -6.0% $757,500 $895,000 +18.2% 47 41 -11.5% 2.4 1.7 -30.2% 6 SF District 6 38 21 -44.7% 35 26 -25.7% $635,000 $720,500 +13.5% 73 39 -46.0% 3.1 1.6 -48.5% 7 SF District 7 46 31 -32.6% 42 31 -26.2% $1,080,000 $1,277,000 +18.2% 40 34 -14.7% 2.7 2.0 -25.7% 8 SF District 8 60 58 -3.3% 57 40 -29.8% $729,000 $722,450 -0.9% 39 37 -5.5% 3.2 2.8 -13.1% 9 SF District 9 109 124 +13.8% 108 93 -13.9% $700,000 $755,000 +7.9% 65 39 -39.8% 3.0 2.2 -26.3% 10 SF District 10 11 4 -63.6% 10 7 -30.0% $297,500 $528,000 +77.5% 87 48 -44.8% 6.8 3.0 -55.6% Key metrics by report month for the districts of San Fransisco. Current as of July 12, 2013. All data from the San Francisco MLS. Powered by 10K Research and Marketing. | Click for Cover Page | 16 Homes for Sale Sold Listings Median Sales Price Days on Market Months Supply