San francisco residential april10 april 12
•
0 gefällt mir•385 views

San Francisco Residential Market Report from April 2010 - April 2012

Empfohlen
Empfohlen
Weitere ähnliche Inhalte
Ähnlich wie San francisco residential april10 april 12
Ähnlich wie San francisco residential april10 april 12 (20)
Mehr von Ronny Budiutama
Mehr von Ronny Budiutama (20)
Kürzlich hochgeladen
Kürzlich hochgeladen (20)
San francisco residential april10 april 12
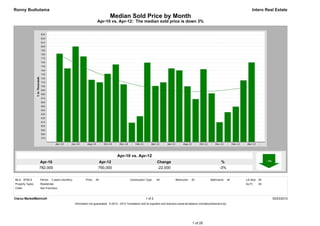
- 1. Ronny Budiutama Intero Real Estate Median Sold Price by Month Apr-10 vs. Apr-12: The median sold price is down 3% Apr-10 vs. Apr-12 Apr-10 Apr-12 Change % 782,000 760,000 -22,000 -3% MLS: SFMLS Period: 2 years (monthly) Price: All Construction Type: All Bedrooms: All Bathrooms: All Lot Size: All Property Types: Residential Sq Ft: All Cities: San Francisco Clarus MarketMetrics® 1 of 2 05/23/2012 Information not guaranteed. © 2012 - 2013 Terradatum and its suppliers and licensors (www.terradatum.com/about/licensors.td). 1 of 20
- 2. Ronny Budiutama Intero Real Estate Median Sold Price by Month Apr-10 vs. Apr-12: The median sold price is down 3% Time Period Median Price # Units Average DOM Apr-12 760,000 219 53 Mar-12 715,000 218 64 Feb-12 649,000 178 64 Jan-12 635,000 128 81 Dec-11 610,000 229 63 Nov-11 682,500 232 57 Oct-11 743,000 201 54 Sep-11 668,000 207 65 Aug-11 700,000 207 64 Jul-11 740,000 203 61 Jun-11 745,000 263 58 May-11 710,000 221 63 Apr-11 701,000 197 67 Mar-11 759,500 216 65 Feb-11 625,000 123 82 Jan-11 608,750 160 71 Dec-10 705,000 231 66 Nov-10 755,000 184 59 Oct-10 731,500 200 56 Sep-10 710,000 175 59 Aug-10 716,500 204 57 Jul-10 775,000 199 58 Jun-10 800,000 230 59 May-10 745,000 239 56 Apr-10 782,000 203 47 Clarus MarketMetrics® 2 of 2 05/23/2012 Information not guaranteed. © 2012 - 2013 Terradatum and its suppliers and licensors (www.terradatum.com/about/licensors.td). 2 of 20
- 3. Ronny Budiutama Intero Real Estate Median For Sale vs. Median Sold Apr-10 vs. Apr-12: The median price of for sale properties is down 2% and the median price of sold properties is down 3% Apr-10 vs. Apr-12 Apr-10 vs. Apr-12 Apr-10 Apr-12 Change % Apr-10 Apr-12 Change % 750,000 733,500 -16,500 -2% 782,000 760,000 -22,000 -3% MLS: SFMLS Period: 2 years (monthly) Price: All Construction Type: All Bedrooms: All Bathrooms: All Lot Size: All Property Types: Residential Sq Ft: All Cities: San Francisco Clarus MarketMetrics® 1 of 2 05/23/2012 Information not guaranteed. © 2012 - 2013 Terradatum and its suppliers and licensors (www.terradatum.com/about/licensors.td). 3 of 20
- 4. Ronny Budiutama Intero Real Estate Median For Sale vs. Median Sold Apr-10 vs. Apr-12: The median price of for sale properties is down 2% and the median price of sold properties is down 3% For Sale # Properties Sold # Properties Price Time Period Median For Sale Median Sold Difference Apr-12 733,500 652 760,000 219 26,500 Mar-12 719,900 701 715,000 218 -4,900 Feb-12 699,000 670 649,000 178 -50,000 Jan-12 649,475 622 635,000 128 -14,475 Dec-11 660,000 631 610,000 229 -50,000 Nov-11 678,000 825 682,500 232 4,500 Oct-11 668,000 1,007 743,000 201 75,000 Sep-11 673,995 1,051 668,000 207 -5,995 Aug-11 650,000 967 700,000 207 50,000 Jul-11 659,000 998 740,000 203 81,000 Jun-11 678,000 973 745,000 263 67,000 May-11 689,000 911 710,000 221 21,000 Apr-11 699,000 921 701,000 197 2,000 Mar-11 675,000 917 759,500 216 84,500 Feb-11 666,500 818 625,000 123 -41,500 Jan-11 649,000 760 608,750 160 -40,250 Dec-10 659,900 816 705,000 231 45,100 Nov-10 699,000 1,036 755,000 184 56,000 Oct-10 699,000 1,151 731,500 200 32,500 Sep-10 709,000 1,150 710,000 175 1,000 Aug-10 687,000 994 716,500 204 29,500 Jul-10 724,500 1,037 775,000 199 50,500 Jun-10 749,000 1,023 800,000 230 51,000 May-10 792,700 965 745,000 239 -47,700 Apr-10 750,000 1,015 782,000 203 32,000 Clarus MarketMetrics® 2 of 2 05/23/2012 Information not guaranteed. © 2012 - 2013 Terradatum and its suppliers and licensors (www.terradatum.com/about/licensors.td). 4 of 20
- 5. Ronny Budiutama Intero Real Estate Sold Properties by Month Apr-10 vs. Apr-12: The number of Sold properties is up 8% Apr-10 vs. Apr-12 Apr-10 Apr-12 Change % 203 219 16 +8% MLS: SFMLS Period: 2 years (monthly) Price: All Construction Type: All Bedrooms: All Bathrooms: All Lot Size: All Property Types: Residential Sq Ft: All Cities: San Francisco Clarus MarketMetrics® 1 of 2 05/23/2012 Information not guaranteed. © 2012 - 2013 Terradatum and its suppliers and licensors (www.terradatum.com/about/licensors.td). 5 of 20
- 6. Ronny Budiutama Intero Real Estate Sold Properties by Month Apr-10 vs. Apr-12: The number of Sold properties is up 8% Full Market Bank Properties Non-Bank Properties Time Period # Properties Median Price Average DOM # Properties % Bank Median Price # Properties % Non-Bank Median Price Apr-12 219 760,000 53 38 17.4 437,000 181 82.7 806,000 Mar-12 218 715,000 64 51 23.4 466,000 167 76.6 786,000 Feb-12 178 649,000 64 39 21.9 460,000 139 78.1 700,000 Jan-12 128 635,000 81 40 31.2 506,500 88 68.8 729,750 Dec-11 229 610,000 63 47 20.5 471,000 182 79.5 688,000 Nov-11 232 682,500 57 36 15.5 432,500 196 84.5 749,750 Oct-11 201 743,000 54 34 16.9 458,500 167 83.1 792,000 Sep-11 207 668,000 65 46 22.2 453,000 161 77.8 734,000 Aug-11 207 700,000 64 44 21.3 434,000 163 78.7 753,500 Jul-11 203 740,000 61 36 17.7 453,000 167 82.3 842,000 Jun-11 263 745,000 58 43 16.4 460,000 220 83.7 767,500 May-11 221 710,000 63 47 21.3 452,000 174 78.7 757,500 Apr-11 197 701,000 67 42 21.3 434,000 155 78.7 825,000 Mar-11 216 759,500 65 44 20.4 462,500 172 79.6 811,000 Feb-11 123 625,000 82 41 33.3 500,000 82 66.7 730,000 Jan-11 160 608,750 71 38 23.8 422,000 122 76.2 657,500 Dec-10 231 705,000 66 39 16.9 482,500 192 83.1 777,000 Nov-10 184 755,000 59 25 13.6 450,000 159 86.4 800,000 Oct-10 200 731,500 56 31 15.5 500,000 169 84.5 770,000 Sep-10 175 710,000 59 35 20.0 460,000 140 80.0 752,000 Aug-10 204 716,500 57 34 16.7 473,500 170 83.3 757,500 Jul-10 199 775,000 58 37 18.6 450,000 162 81.4 826,000 Jun-10 230 800,000 59 35 15.2 568,200 195 84.8 895,000 May-10 239 745,000 56 47 19.7 450,000 192 80.3 796,500 Apr-10 203 782,000 47 42 20.7 490,500 161 79.3 845,000 Clarus MarketMetrics® 2 of 2 05/23/2012 Information not guaranteed. © 2012 - 2013 Terradatum and its suppliers and licensors (www.terradatum.com/about/licensors.td). 6 of 20
- 7. Ronny Budiutama Intero Real Estate Under Contract Properties by Month Apr-10 vs. Apr-12: The number of Under Contract properties is down 11% Apr-10 vs. Apr-12 Apr-10 Apr-12 Change % 267 238 -29 -11% MLS: SFMLS Period: 2 years (monthly) Price: All Construction Type: All Bedrooms: All Bathrooms: All Lot Size: All Property Types: Residential Sq Ft: All Cities: San Francisco Clarus MarketMetrics® 1 of 2 05/23/2012 Information not guaranteed. © 2012 - 2013 Terradatum and its suppliers and licensors (www.terradatum.com/about/licensors.td). 7 of 20
- 8. Ronny Budiutama Intero Real Estate Under Contract Properties by Month Apr-10 vs. Apr-12: The number of Under Contract properties is down 11% Full Market Bank Properties Non-Bank Properties Time Period # Properties Median Price Average DOM # Properties % Bank Median Price # Properties % Non-Bank Median Price Apr-12 238 699,000 41 49 20.6 488,800 189 79.4 799,000 Mar-12 263 699,999 47 57 21.7 425,000 206 78.3 799,000 Feb-12 223 699,000 60 58 26.0 449,500 165 74.0 749,000 Jan-12 167 649,000 65 47 28.1 420,000 120 71.9 765,000 Dec-11 138 599,000 76 34 24.6 499,000 104 75.4 677,000 Nov-11 218 604,450 72 53 24.3 429,000 165 75.7 699,000 Oct-11 251 655,000 66 62 24.7 469,950 189 75.3 775,000 Sep-11 221 699,888 61 35 15.8 488,000 186 84.2 787,000 Aug-11 216 677,000 62 47 21.8 436,000 169 78.2 738,000 Jul-11 223 649,888 57 48 21.5 434,778 175 78.5 725,000 Jun-11 221 699,000 63 43 19.5 429,900 178 80.5 762,000 May-11 239 725,000 57 39 16.3 449,000 200 83.7 798,000 Apr-11 214 729,000 57 35 16.4 488,000 179 83.6 788,000 Mar-11 230 699,000 68 63 27.4 439,900 167 72.6 799,000 Feb-11 192 739,000 64 39 20.3 469,900 153 79.7 799,000 Jan-11 149 629,500 82 52 34.9 446,200 97 65.1 699,900 Dec-10 148 629,500 80 42 28.4 416,950 106 71.6 674,500 Nov-10 198 743,500 69 27 13.6 465,300 171 86.4 789,000 Oct-10 210 734,000 58 32 15.2 471,700 178 84.8 798,500 Sep-10 216 731,500 56 39 18.1 480,000 177 81.9 799,000 Aug-10 172 671,400 65 40 23.3 449,450 132 76.7 744,000 Jul-10 202 724,944 60 34 16.8 438,000 168 83.2 799,000 Jun-10 208 709,950 57 36 17.3 491,900 172 82.7 799,000 May-10 204 849,500 59 31 15.2 499,900 173 84.8 950,000 Apr-10 267 719,000 53 51 19.1 450,000 216 80.9 773,500 Clarus MarketMetrics® 2 of 2 05/23/2012 Information not guaranteed. © 2012 - 2013 Terradatum and its suppliers and licensors (www.terradatum.com/about/licensors.td). 8 of 20
- 9. Ronny Budiutama Intero Real Estate New Properties by Month Apr-10 vs. Apr-12: The number of New properties is down 36% Apr-10 vs. Apr-12 Apr-10 Apr-12 Change % 407 259 -148 -36% MLS: SFMLS Period: 2 years (monthly) Price: All Construction Type: All Bedrooms: All Bathrooms: All Lot Size: All Property Types: Residential Sq Ft: All Cities: San Francisco Clarus MarketMetrics® 1 of 2 05/23/2012 Information not guaranteed. © 2012 - 2013 Terradatum and its suppliers and licensors (www.terradatum.com/about/licensors.td). 9 of 20
- 10. Ronny Budiutama Intero Real Estate New Properties by Month Apr-10 vs. Apr-12: The number of New properties is down 36% Full Market Bank Properties Non-Bank Properties Time Period # Properties Median Price # Properties % Bank Median Price # Properties % Non-Bank Median Price Apr-12 259 725,000 46 17.8 493,900 213 82.2 810,000 Mar-12 295 725,000 48 16.3 422,000 247 83.7 819,000 Feb-12 258 749,000 51 19.8 424,900 207 80.2 830,000 Jan-12 247 675,000 60 24.3 410,000 187 75.7 794,888 Dec-11 121 559,900 46 38.0 474,950 75 62.0 639,000 Nov-11 151 678,000 39 25.8 459,999 112 74.2 749,500 Oct-11 260 678,500 52 20.0 402,375 208 80.0 727,500 Sep-11 397 729,000 74 18.6 452,000 323 81.4 798,000 Aug-11 288 649,000 58 20.1 468,900 230 79.9 717,500 Jul-11 330 692,000 62 18.8 492,450 268 81.2 738,500 Jun-11 349 698,000 78 22.4 430,550 271 77.7 775,000 May-11 279 699,000 65 23.3 430,000 214 76.7 761,500 Apr-11 293 779,000 43 14.7 475,000 250 85.3 849,500 Mar-11 345 699,000 75 21.7 439,900 270 78.3 798,500 Feb-11 287 690,000 72 25.1 450,550 215 74.9 799,000 Jan-11 274 686,500 69 25.2 467,500 205 74.8 750,000 Dec-10 103 560,000 46 44.7 494,450 57 55.3 695,000 Nov-10 198 656,944 64 32.3 414,800 134 67.7 797,000 Oct-10 320 699,500 44 13.8 467,450 276 86.2 768,500 Sep-10 458 799,000 63 13.8 460,900 395 86.2 849,000 Aug-10 277 650,000 54 19.5 444,750 223 80.5 699,000 Jul-10 316 699,000 63 19.9 479,400 253 80.1 749,000 Jun-10 337 699,000 55 16.3 474,500 282 83.7 799,000 May-10 306 749,000 57 18.6 459,000 249 81.4 829,000 Apr-10 407 750,000 78 19.2 451,950 329 80.8 849,000 Clarus MarketMetrics® 2 of 2 05/23/2012 Information not guaranteed. © 2012 - 2013 Terradatum and its suppliers and licensors (www.terradatum.com/about/licensors.td). 10 of 20
- 11. Ronny Budiutama Intero Real Estate For Sale Properties by Month Apr-10 vs. Apr-12: The number of For Sale properties is down 36% Apr-10 vs. Apr-12 Apr-10 Apr-12 Change % 1,015 652 -363 -36% MLS: SFMLS Period: 2 years (monthly) Price: All Construction Type: All Bedrooms: All Bathrooms: All Lot Size: All Property Types: Residential Sq Ft: All Cities: San Francisco Clarus MarketMetrics® 1 of 2 05/23/2012 Information not guaranteed. © 2012 - 2013 Terradatum and its suppliers and licensors (www.terradatum.com/about/licensors.td). 11 of 20
- 12. Ronny Budiutama Intero Real Estate For Sale Properties by Month Apr-10 vs. Apr-12: The number of For Sale properties is down 36% Full Market Bank Properties Non-Bank Properties Time Period # Properties Median Price Average DOM # Properties % Bank Median Price # Properties % Non-Bank Median Price Apr-12 652 733,500 64 131 20.1 465,000 521 79.9 845,000 Mar-12 701 719,900 66 154 22.0 442,000 547 78.0 814,250 Feb-12 670 699,000 77 181 27.0 450,000 489 73.0 799,000 Jan-12 622 649,475 89 189 30.4 449,950 433 69.6 750,000 Dec-11 631 660,000 106 183 29.0 469,900 448 71.0 749,000 Nov-11 825 678,000 92 210 25.4 452,500 615 74.5 750,000 Oct-11 1,007 668,000 80 255 25.3 455,000 752 74.7 749,000 Sep-11 1,051 673,995 74 260 24.7 467,700 791 75.3 759,000 Aug-11 967 650,000 80 255 26.4 459,000 712 73.6 749,000 Jul-11 998 659,000 76 266 26.6 449,900 732 73.3 754,500 Jun-11 973 678,000 76 263 27.0 435,000 710 73.0 785,500 May-11 911 689,000 76 231 25.4 448,888 680 74.6 799,000 Apr-11 921 699,000 73 221 24.0 449,950 700 76.0 799,000 Mar-11 917 675,000 73 257 28.0 449,000 660 72.0 795,000 Feb-11 818 666,500 79 237 29.0 458,000 581 71.0 795,000 Jan-11 760 649,000 93 233 30.7 449,950 527 69.3 770,000 Dec-10 816 659,900 104 230 28.2 437,450 586 71.8 779,000 Nov-10 1,036 699,000 86 233 22.5 439,900 803 77.5 789,000 Oct-10 1,151 699,000 73 215 18.7 450,000 936 81.3 779,000 Sep-10 1,150 709,000 68 229 19.9 460,900 921 80.1 789,000 Aug-10 994 687,000 77 235 23.6 459,000 759 76.4 750,000 Jul-10 1,037 724,500 73 233 22.5 469,965 804 77.5 799,000 Jun-10 1,023 749,000 69 225 22.0 469,965 798 78.0 828,500 May-10 965 792,700 65 215 22.3 476,000 750 77.7 879,000 Apr-10 1,015 750,000 60 233 23.0 468,000 782 77.0 862,000 Clarus MarketMetrics® 2 of 2 05/23/2012 Information not guaranteed. © 2012 - 2013 Terradatum and its suppliers and licensors (www.terradatum.com/about/licensors.td). 12 of 20
- 13. Ronny Budiutama Intero Real Estate Expired Properties by Month Apr-10 vs. Apr-12: The number of Expired properties is down 54% Apr-10 vs. Apr-12 Apr-10 Apr-12 Change % 89 41 -48 -54% MLS: SFMLS Period: 2 years (monthly) Price: All Construction Type: All Bedrooms: All Bathrooms: All Lot Size: All Property Types: Residential Sq Ft: All Cities: San Francisco Clarus MarketMetrics® 1 of 2 05/23/2012 Information not guaranteed. © 2012 - 2013 Terradatum and its suppliers and licensors (www.terradatum.com/about/licensors.td). 13 of 20
- 14. Ronny Budiutama Intero Real Estate Expired Properties by Month Apr-10 vs. Apr-12: The number of Expired properties is down 54% Full Market Bank Properties Non-Bank Properties Time Period # Properties Median Price Average DOM # Properties % Bank Median Price # Properties % Non-Bank Median Price Apr-12 41 699,000 81 10 24.4 493,000 31 75.6 788,000 Mar-12 45 675,000 87 12 26.7 462,500 33 73.3 729,000 Feb-12 41 649,000 116 17 41.5 484,950 24 58.5 899,500 Jan-12 43 599,000 118 12 27.9 444,500 31 72.1 749,000 Dec-11 118 772,500 114 20 16.9 489,000 98 83.0 849,500 Nov-11 97 679,000 97 20 20.6 454,500 77 79.4 764,000 Oct-11 82 629,250 101 22 26.8 449,500 60 73.2 723,000 Sep-11 83 669,000 105 22 26.5 402,500 61 73.5 738,000 Aug-11 97 770,000 92 22 22.7 449,419 75 77.3 799,950 Jul-11 96 699,475 92 21 21.9 435,000 75 78.1 786,000 Jun-11 84 769,000 109 16 19.1 404,500 68 81.0 849,500 May-11 48 784,000 108 7 14.6 434,900 41 85.4 850,000 Apr-11 75 685,000 114 20 26.7 425,000 55 73.3 788,000 Mar-11 59 670,000 108 16 27.1 524,500 43 72.9 729,000 Feb-11 54 622,000 116 16 29.6 479,500 38 70.4 799,000 Jan-11 80 699,000 119 16 20.0 409,500 64 80.0 779,000 Dec-10 182 799,000 115 24 13.2 421,000 158 86.8 843,500 Nov-10 125 738,000 108 22 17.6 488,500 103 82.4 789,000 Oct-10 103 695,000 95 14 13.6 446,000 89 86.4 729,000 Sep-10 103 749,000 107 19 18.4 569,000 84 81.5 750,000 Aug-10 130 799,000 101 29 22.3 479,900 101 77.7 899,000 Jul-10 118 848,500 89 18 15.2 468,700 100 84.8 897,500 Jun-10 94 788,750 99 19 20.2 468,000 75 79.8 879,000 May-10 75 749,000 78 14 18.7 443,000 61 81.3 895,000 Apr-10 89 749,000 87 24 27.0 490,000 65 73.0 850,000 Clarus MarketMetrics® 2 of 2 05/23/2012 Information not guaranteed. © 2012 - 2013 Terradatum and its suppliers and licensors (www.terradatum.com/about/licensors.td). 14 of 20
- 15. Ronny Budiutama Intero Real Estate Supply & Demand by Month Apr-10 vs. Apr-12: The number of for sale properties is down 36% and the number of sold properties is up 8% Apr-10 vs. Apr-12 Apr-10 vs. Apr-12 Apr-10 Apr-12 Change % Apr-10 Apr-12 Change % 1,015 652 -363 -36% 203 219 16 +8% MLS: SFMLS Period: 2 years (monthly) Price: All Construction Type: All Bedrooms: All Bathrooms: All Lot Size: All Property Types: Residential Sq Ft: All Cities: San Francisco Clarus MarketMetrics® 1 of 2 05/23/2012 Information not guaranteed. © 2012 - 2013 Terradatum and its suppliers and licensors (www.terradatum.com/about/licensors.td). 15 of 20
- 16. Ronny Budiutama Intero Real Estate Supply & Demand by Month Apr-10 vs. Apr-12: The number of for sale properties is down 36% and the number of sold properties is up 8% # Properties Average DOM # Properties Average DOM Time Period For Sale For Sale Sold Sold Apr-12 652 64 219 53 Mar-12 701 66 218 64 Feb-12 670 77 178 64 Jan-12 622 89 128 81 Dec-11 631 106 229 63 Nov-11 825 92 232 57 Oct-11 1,007 80 201 54 Sep-11 1,051 74 207 65 Aug-11 967 80 207 64 Jul-11 998 76 203 61 Jun-11 973 76 263 58 May-11 911 76 221 63 Apr-11 921 73 197 67 Mar-11 917 73 216 65 Feb-11 818 79 123 82 Jan-11 760 93 160 71 Dec-10 816 104 231 66 Nov-10 1,036 86 184 59 Oct-10 1,151 73 200 56 Sep-10 1,150 68 175 59 Aug-10 994 77 204 57 Jul-10 1,037 73 199 58 Jun-10 1,023 69 230 59 May-10 965 65 239 56 Apr-10 1,015 60 203 47 Clarus MarketMetrics® 2 of 2 05/23/2012 Information not guaranteed. © 2012 - 2013 Terradatum and its suppliers and licensors (www.terradatum.com/about/licensors.td). 16 of 20
- 17. Ronny Budiutama Intero Real Estate The Average Days on Market by Month Apr-10 vs. Apr-12: The average days on market is down 22% Apr-10 vs. Apr-12 Apr-10 Apr-12 Change % 53 41 -12 -22% MLS: SFMLS Period: 2 years (monthly) Price: All Construction Type: All Bedrooms: All Bathrooms: All Lot Size: All Property Types: Residential Sq Ft: All Cities: San Francisco Clarus MarketMetrics® 1 of 2 05/23/2012 Information not guaranteed. © 2012 - 2013 Terradatum and its suppliers and licensors (www.terradatum.com/about/licensors.td). 17 of 20
- 18. Ronny Budiutama Intero Real Estate The Average Days on Market by Month Apr-10 vs. Apr-12: The average days on market is down 22% Time Period Average DOM # UC Units Apr-12 41 238 Mar-12 47 263 Feb-12 60 223 Jan-12 65 167 Dec-11 76 138 Nov-11 72 218 Oct-11 66 251 Sep-11 61 221 Aug-11 62 216 Jul-11 57 223 Jun-11 63 221 May-11 57 239 Apr-11 57 214 Mar-11 68 230 Feb-11 64 192 Jan-11 82 149 Dec-10 80 148 Nov-10 69 198 Oct-10 58 210 Sep-10 56 216 Aug-10 65 172 Jul-10 60 202 Jun-10 57 208 May-10 59 204 Apr-10 53 267 Clarus MarketMetrics® 2 of 2 05/23/2012 Information not guaranteed. © 2012 - 2013 Terradatum and its suppliers and licensors (www.terradatum.com/about/licensors.td). 18 of 20
- 19. Ronny Budiutama Intero Real Estate Months Supply of Inventory Apr-10 vs. Apr-12: The average months supply of inventory is down 37% Apr-10 vs. Apr-12 Apr-10 Apr-12 Change % 2.5 1.6 -0.9 -37% MLS: SFMLS Period: 2 years (monthly) Price: All Construction Type: All Bedrooms: All Bathrooms: All Lot Size: All Property Types: Residential Sq Ft: All Cities: San Francisco Clarus MarketMetrics® 1 of 2 05/23/2012 Information not guaranteed. © 2012 - 2013 Terradatum and its suppliers and licensors (www.terradatum.com/about/licensors.td). 19 of 20
- 20. Ronny Budiutama Intero Real Estate Months Supply of Inventory Apr-10 vs. Apr-12: The average months supply of inventory is down 37% # Units For Sale # UC Units UC Average Time Period Last Day of Month During Month MSI DOM Apr-12 373 238 1.6 41 Mar-12 393 263 1.5 47 Feb-12 406 223 1.8 60 Jan-12 412 167 2.5 65 Dec-11 375 138 2.7 76 Nov-11 510 218 2.3 72 Oct-11 674 251 2.7 66 Sep-11 747 221 3.4 61 Aug-11 654 216 3.0 62 Jul-11 679 223 3.0 57 Jun-11 668 221 3.0 63 May-11 624 239 2.6 57 Apr-11 632 214 3.0 57 Mar-11 628 230 2.7 68 Feb-11 572 192 3.0 64 Jan-11 531 149 3.6 82 Dec-10 486 148 3.3 80 Nov-10 713 198 3.6 69 Oct-10 838 210 4.0 58 Sep-10 831 216 3.8 56 Aug-10 692 172 4.0 65 Jul-10 717 202 3.5 60 Jun-10 721 208 3.5 57 May-10 686 204 3.4 59 Apr-10 659 267 2.5 53 Clarus MarketMetrics® 2 of 2 05/23/2012 Information not guaranteed. © 2012 - 2013 Terradatum and its suppliers and licensors (www.terradatum.com/about/licensors.td). 20 of 20