SlideShare ist ein Scribd-Unternehmen logo
1 von 16
Downloaden Sie, um offline zu lesen
November 2022 Monthly Snapshot
One-Year Change in One-Year Change in
Median Sales Price Single
Family
Median Sales Price
Condo/TIC/Coop
2
3
4
5
6
7
8
9
10
11
12
13
14
15
16
Monthly Indicators
- 20.2% - 8.9% - 11.7%
One-Year Change in
Housing affordability continues to be a major roadblock for market participants,
with mortgage rates more than double compared to this time last year. Buyers
are delaying home purchases in hopes rates will drop, while many sellers are
holding off on listing their homes due to weakening buyer demand, unwilling to
trade in their current lower rates for significantly higher borrowing costs on their
next property. As a result, existing-home and pending home sales have
continued to slow as we move into winter.
New Listings were down 12.3 percent for single family homes and 41.9 percent
for Condo/TIC/Coop properties. Pending Sales decreased 31.7 percent for
single family homes and 49.2 percent for Condo/TIC/Coop properties.
The Median Sales Price was down 20.2 percent to $1,500,000 for single family
homes and 8.9 percent to $1,148,000 for Condo/TIC/Coop properties. Months
Supply of Inventory increased 21.4 percent for single family units and 6.9
percent for Condo/TIC/Coop units.
With home sales down, nationwide housing inventory was at 3.3 months’ supply
heading into November, up from 2.4 months from this time last year, according
to the National Association of REALTORS®. Although buyers have more
options to choose from, home prices remain high, and soaring borrowing costs
have caused monthly payments to increase significantly, with the average
homebuyer paying 77% more on their loan per month compared to the same
period a year ago, according to Realtor.com.
Median Sales Price
All Property Types
Residential real estate activity in San Francisco County (Districts 1-10)
composed of single-family properties, townhomes and condominiums. Percent
changes are calculated using rounded figures.
Single Family Activity Overview
Months Supply of Inventory
For questions or more information, contact
communications@sfrealtors.com.
Current as of December 11, 2022. All data from the San Francisco Association of REALTORS® MLS. Report © 2022 ShowingTime.
Condo/TIC/Coop Activity Overview
Inventory of Active Listings
% of Properties Sold Over List Price
% of List Price Received
Housing Affordability Ratio
All Properties Activity Overview
New Listings
Pending Sales
Sold Listings
Median Sales Price
Average Sales Price
Days on Market Until Sale
Activity by District
Single Family Activity Overview
Key metrics by report month and for year-to-date (YTD) starting from the first of the year.
Key Metrics Historical Sparkbars 11-2021 11-2022 Percent Change YTD 2021 YTD 2022 Percent Change
Current as of December 11, 2022. All data from the San Francisco Association of REALTORS® MLS. Report © 2022 ShowingTime. | 2
Months Supply 1.4 1.7 + 21.4% -- -- --
Affordability Ratio 30 27 - 10.0%
% of List Price Received 114.8% 104.9% - 8.6% 114.8%
31
78.8% 0.0%
+ 0.3%
22 - 29.0%
115.2%
% of Properties Sold Over List Price 79.5% 57.8% - 27.3% 78.8%
Active Listings 364 351 - 3.6% --
Avg. Sales Price $2,352,087 $1,900,681 - 19.2% $2,306,253
Days on Market 21 35 + 66.7% 23 23 0.0%
$2,232,183
-- --
Median Sales Price $1,880,000 $1,500,000 - 20.2% $1,810,000
Sold Listings 293 185 - 36.9% 2,835
New Listings 171 150 - 12.3% 3,377
Pending Sales 259 177 - 31.7% - 21.0%
2,897 2,290
- 9.5%
3,056
2,260 - 20.3%
$1,800,000 - 0.6%
- 3.2%
11-2019 11-2020 11-2021 11-2022
11-2019 11-2020 11-2021 11-2022
11-2019 11-2020 11-2021 11-2022
11-2019 11-2020 11-2021 11-2022
11-2019 11-2020 11-2021 11-2022
11-2019 11-2020 11-2021 11-2022
11-2019 11-2020 11-2021 11-2022
11-2019 11-2020 11-2021 11-2022
11-2019 11-2020 11-2021 11-2022
11-2019 11-2020 11-2021 11-2022
11-2019 11-2020 11-2021 11-2022
Condo/TIC/Coop Activity Overview
Key metrics by report month and for year-to-date (YTD) starting from the first of the year.
Key Metrics Historical Sparkbars 11-2021 11-2022 Percent Change YTD 2021 YTD 2022 Percent Change
Current as of December 11, 2022. All data from the San Francisco Association of REALTORS® MLS. Report © 2022 ShowingTime. | 3
Months Supply 2.9 3.1 + 6.9% -- -- --
Affordability Ratio 54 39 - 27.8%
% of List Price Received 104.6% 99.2% - 5.2% 103.9%
56
48.8% - 1.4%
- 0.1%
37 - 33.9%
103.8%
% of Properties Sold Over List Price 55.8% 30.5% - 45.3% 49.5%
Active Listings 1,093 824 - 24.6% --
Avg. Sales Price $1,538,838 $1,404,199 - 8.7% $1,384,331
Days on Market 41 51 + 24.4% 46
$1,200,000 - 0.4%
+ 0.2%
43 - 6.5%
$1,386,784
-- --
Sold Listings 425 203 - 52.2% 4,182 2,990 - 28.5%
Median Sales Price $1,260,000 $1,148,000 - 8.9% $1,205,000
- 10.2%
Pending Sales 360 183 - 49.2% 4,260 2,988 - 29.9%
New Listings 265 154 - 41.9% 5,494 4,934
11-2019 11-2020 11-2021 11-2022
11-2019 11-2020 11-2021 11-2022
11-2019 11-2020 11-2021 11-2022
11-2019 11-2020 11-2021 11-2022
11-2019 11-2020 11-2021 11-2022
11-2019 11-2020 11-2021 11-2022
11-2019 11-2020 11-2021 11-2022
11-2019 11-2020 11-2021 11-2022
11-2019 11-2020 11-2021 11-2022
11-2019 11-2020 11-2021 11-2022
11-2019 11-2020 11-2021 11-2022
New Listings
New Listings
Single
Family
Year-Over-Year
Change
Condo/TIC/
Coop
Year-Over-Year
Change
Dec-2021 83 -33.1% 147 -7.5%
Jan-2022 228 -9.9% 473 -12.1%
Feb-2022 288 +14.7% 535 +6.4%
Mar-2022 343 +5.9% 614 +13.7%
Apr-2022 329 -4.9% 542 +0.2%
May-2022 302 -15.2% 517 +1.4%
Jun-2022 322 -4.2% 448 -10.4%
Jul-2022 242 -20.9% 381 -16.8%
Aug-2022 239 -13.7% 308 -20.6%
Sep-2022 370 -12.7% 579 -19.8%
Oct-2022 243 -27.0% 383 -27.6%
Nov-2022 150 -12.3% 154 -41.9%
12-Month Avg 262 -10.3% 423 -10.1%
Historical New Listings by Month
Current as of December 11, 2022. All data from the San Francisco Association of REALTORS® MLS. Report © 2022 ShowingTime. | 4
A count of the properties that have been newly listed on the market in a given month.
241
269
171
265
150 154
Single Family Condo/TIC/Coop
November
0
200
400
600
800
1-2005 1-2006 1-2007 1-2008 1-2009 1-2010 1-2011 1-2012 1-2013 1-2014 1-2015 1-2016 1-2017 1-2018 1-2019 1-2020 1-2021 1-2022
Single Family Condo/TIC/Coop
3,205
5,098
3,377
5,494
3,056
4,934
Single Family Condo/TIC/Coop
Year to Date
2020 2021 2022
- 41.9%
- 1.5%
- 12.3%
- 29.0% + 7.8%
- 9.5%
+ 5.4% - 10.2%
2020 2021 2022 2020 2021 2022 2020 2021 2022
+ 39.3% + 11.1% + 33.5%
+ 70.3%
Pending Sales
Pending Sales
Single
Family
Year-Over-Year
Change
Condo/TIC/
Coop
Year-Over-Year
Change
Dec-2021 129 -35.8% 226 -26.4%
Jan-2022 145 -14.2% 251 -14.0%
Feb-2022 216 -4.4% 287 -24.7%
Mar-2022 288 -0.3% 436 -8.0%
Apr-2022 269 -5.9% 345 -28.1%
May-2022 249 -18.9% 332 -28.3%
Jun-2022 198 -27.7% 258 -33.5%
Jul-2022 183 -29.3% 222 -39.0%
Aug-2022 179 -20.8% 232 -26.6%
Sep-2022 188 -42.9% 215 -36.2%
Oct-2022 198 -27.5% 227 -44.0%
Nov-2022 177 -31.7% 183 -49.2%
12-Month Avg 202 -21.9% 268 -29.6%
Historical Pending Sales by Month
A count of the properties on which offers have been accepted in a given month.
Current as of December 11, 2022. All data from the San Francisco Association of REALTORS® MLS. Report © 2022 ShowingTime. | 5
306 300
259
360
177 183
Single Family Condo/TIC/Coop
November
0
100
200
300
400
500
600
1-2005 1-2006 1-2007 1-2008 1-2009 1-2010 1-2011 1-2012 1-2013 1-2014 1-2015 1-2016 1-2017 1-2018 1-2019 1-2020 1-2021 1-2022
Single Family Condo/TIC/Coop
2,313
2,542
2,897
4,260
2,290
2,988
Single Family Condo/TIC/Coop
Year to Date
2020 2021 2022
- 49.2%
+ 20.0%
- 31.7%
- 15.4% + 67.6%
- 21.0%
+ 25.2% - 29.9%
2020 2021 2022 2020 2021 2022 2020 2021 2022
+ 37.8% + 0.0% - 7.7%
+ 26.6%
Sold Listings
Sold Listings
Single
Family
Year-Over-Year
Change
Condo/TIC/
Coop
Year-Over-Year
Change
Dec-2021 216 -28.5% 325 -7.9%
Jan-2022 130 -19.3% 186 -31.1%
Feb-2022 159 -2.5% 250 -10.1%
Mar-2022 257 -5.2% 394 -13.8%
Apr-2022 257 -11.1% 380 -17.7%
May-2022 282 +6.0% 368 -17.1%
Jun-2022 249 -23.6% 309 -34.7%
Jul-2022 183 -28.2% 232 -37.1%
Aug-2022 189 -26.2% 236 -32.2%
Sep-2022 179 -26.9% 210 -28.1%
Oct-2022 190 -38.7% 222 -39.0%
Nov-2022 185 -36.9% 203 -52.2%
12-Month Avg 206 -21.1% 276 -26.9%
Historical Sold Listings by Month
A count of the actual sales that closed in a given month.
Current as of December 11, 2022. All data from the San Francisco Association of REALTORS® MLS. Report © 2022 ShowingTime. | 6
284
341
293
425
185
203
Single Family Condo/TIC/Coop
November
0
100
200
300
400
500
1-2005 1-2006 1-2007 1-2008 1-2009 1-2010 1-2011 1-2012 1-2013 1-2014 1-2015 1-2016 1-2017 1-2018 1-2019 1-2020 1-2021 1-2022
Single Family Condo/TIC/Coop
2,161
2,435
2,835
4,182
2,260
2,990
Single Family Condo/TIC/Coop
Year to Date
2020 2021 2022
- 52.2%
+ 24.6%
- 36.9%
+ 3.2% + 71.7%
- 20.3%
+ 31.2% - 28.5%
2020 2021 2022 2020 2021 2022 2020 2021 2022
+ 26.8% - 3.2% - 8.5%
+ 25.8%
Median Sales Price
Median Sales Price
Single
Family
Year-Over-Year
Change
Condo/TIC/
Coop
Year-Over-Year
Change
Dec-2021 $1,690,000 +9.0% $1,300,000 +18.2%
Jan-2022 $1,630,000 +3.5% $1,070,000 -0.2%
Feb-2022 $1,930,000 +17.0% $1,227,500 +2.6%
Mar-2022 $2,000,000 +15.9% $1,206,750 -1.2%
Apr-2022 $2,050,000 +13.9% $1,362,500 +13.5%
May-2022 $2,007,500 +6.4% $1,215,000 -1.1%
Jun-2022 $1,880,000 -3.1% $1,240,000 -0.8%
Jul-2022 $1,670,000 -9.7% $1,198,500 -1.0%
Aug-2022 $1,610,000 -12.9% $997,500 -13.3%
Sep-2022 $1,650,000 -5.7% $1,160,000 -3.3%
Oct-2022 $1,670,000 -7.5% $1,200,000 -3.8%
Nov-2022 $1,500,000 -20.2% $1,148,000 -8.9%
12-Month Avg* $1,800,000 0.0% $1,210,000 +0.8%
Historical Median Sales Price by Month
Point at which half of the sales sold for more and half sold for less, not accounting for seller concessions, in a given month.
* Median Sales Price for all properties from December 2021 through November 2022. This is not
the average of the individual figures above.
Current as of December 11, 2022. All data from the San Francisco Association of REALTORS® MLS. Report © 2022 ShowingTime. | 7
$1,637,500
$1,172,125
$1,880,000
$1,260,000
$1,500,000
$1,148,000
Single Family Condo/TIC/Coop
November
$500,000
$750,000
$1,000,000
$1,250,000
$1,500,000
$1,750,000
$2,000,000
$2,250,000
1-2005 1-2006 1-2007 1-2008 1-2009 1-2010 1-2011 1-2012 1-2013 1-2014 1-2015 1-2016 1-2017 1-2018 1-2019 1-2020 1-2021 1-2022
Single Family Condo/TIC/Coop
$1,620,000
$1,200,000
$1,810,000
$1,205,000
$1,800,000
$1,200,000
Single Family Condo/TIC/Coop
Year to Date
2020 2021 2022
- 8.9%
+ 7.5%
- 20.2%
+ 14.8% + 0.4%
- 0.6%
+ 11.7% - 0.4%
2020 2021 2022 2020 2021 2022 2020 2021 2022
+ 7.2% + 2.8% - 0.4%
+ 0.2%
Average Sales Price
Average Sales
Price
Single
Family
Year-Over-Year
Change
Condo/TIC/
Coop
Year-Over-Year
Change
Dec-2021 $2,365,749 +17.5% $1,488,734 +16.1%
Jan-2022 $1,971,756 +1.3% $1,311,263 +8.3%
Feb-2022 $2,417,245 +7.1% $1,398,389 +4.0%
Mar-2022 $2,534,210 +14.6% $1,411,860 +3.1%
Apr-2022 $2,515,877 +3.5% $1,464,116 +8.7%
May-2022 $2,411,895 -2.7% $1,403,132 +1.7%
Jun-2022 $2,355,940 -5.8% $1,366,119 -1.5%
Jul-2022 $2,061,331 -10.1% $1,471,068 +8.4%
Aug-2022 $1,950,088 -8.4% $1,175,621 -17.5%
Sep-2022 $1,886,008 -12.9% $1,343,336 +0.8%
Oct-2022 $2,128,399 -9.8% $1,423,422 -2.6%
Nov-2022 $1,900,681 -19.2% $1,404,199 -8.7%
12-Month Avg* $2,243,835 -1.5% $1,396,782 +1.5%
Historical Average Sales Price by Month
Average sales price for all closed sales, not accounting for seller concessions, in a given month.
* Avg. Sales Price for all properties from December 2021 through November 2022. This is not the
average of the individual figures above.
Current as of December 11, 2022. All data from the San Francisco Association of REALTORS® MLS. Report © 2022 ShowingTime. | 8
$2,035,750
$1,270,960
$2,352,087
$1,538,838
$1,900,681
$1,404,199
Single Family Condo/TIC/Coop
November
$500,000
$1,000,000
$1,500,000
$2,000,000
$2,500,000
$3,000,000
1-2005 1-2006 1-2007 1-2008 1-2009 1-2010 1-2011 1-2012 1-2013 1-2014 1-2015 1-2016 1-2017 1-2018 1-2019 1-2020 1-2021 1-2022
Single Family Condo/TIC/Coop
$2,003,109
$1,320,900
$2,306,253
$1,384,331
$2,232,183
$1,386,784
Single Family Condo/TIC/Coop
Year to Date
2020 2021 2022
- 8.7%
+ 21.1%
- 19.2%
+ 15.5% + 4.8%
- 3.2%
+ 15.1% + 0.2%
2020 2021 2022 2020 2021 2022 2020 2021 2022
+ 6.6% + 2.1% - 2.0%
- 3.1%
Days on Market Until Sale
Days on Market
Until Sale
Single
Family
Year-Over-Year
Change
Condo/TIC/
Coop
Year-Over-Year
Change
Dec-2021 31 -13.9% 47 -26.6%
Jan-2022 41 +2.5% 68 -9.3%
Feb-2022 22 -35.3% 36 -45.5%
Mar-2022 16 -38.5% 34 -29.2%
Apr-2022 16 -20.0% 32 -31.9%
May-2022 21 +5.0% 37 -5.1%
Jun-2022 17 -10.5% 39 +5.4%
Jul-2022 21 +10.5% 49 +16.7%
Aug-2022 26 +4.0% 50 +16.3%
Sep-2022 28 +21.7% 58 +45.0%
Oct-2022 28 +40.0% 42 +16.7%
Nov-2022 35 +66.7% 51 +24.4%
12-Month Avg* 24 -1.9% 43 -8.1%
Historical Days on Market Until Sale by Month
Average number of days between when a property is listed and when an offer is accepted in a given month.
* Days on Market for all properties from December 2021 through November 2022. This is not the
average of the individual figures above.
Current as of December 11, 2022. All data from the San Francisco Association of REALTORS® MLS. Report © 2022 ShowingTime. | 9
34
51
21
41
35
51
Single Family Condo/TIC/Coop
November
0
20
40
60
80
100
120
1-2005 1-2006 1-2007 1-2008 1-2009 1-2010 1-2011 1-2012 1-2013 1-2014 1-2015 1-2016 1-2017 1-2018 1-2019 1-2020 1-2021 1-2022
Single Family Condo/TIC/Coop
28
43
23
46
23
43
Single Family Condo/TIC/Coop
Year to Date
2020 2021 2022
+ 24.4%
- 19.6%
+ 66.7%
- 38.2% + 7.0%
0.0%
- 17.9% - 6.5%
2020 2021 2022 2020 2021 2022 2020 2021 2022
+ 36.0% + 3.7% + 13.2%
+ 50.0%
Inventory of Active Listings
Inventory of Active
Listings
Single
Family
Year-Over-Year
Change
Condo/TIC/
Coop
Year-Over-Year
Change
Dec-2021 206 -48.2% 677 -40.8%
Jan-2022 263 -34.6% 835 -33.0%
Feb-2022 302 -20.5% 994 -19.6%
Mar-2022 320 -12.6% 1,050 -8.6%
Apr-2022 339 -13.7% 1,111 -0.1%
May-2022 334 -17.5% 1,122 +4.8%
Jun-2022 380 -8.7% 1,100 +3.8%
Jul-2022 369 -13.2% 1,016 -4.2%
Aug-2022 352 -18.1% 888 -13.4%
Sep-2022 484 +2.1% 1,099 -15.6%
Oct-2022 468 -4.3% 1,084 -16.9%
Nov-2022 351 -3.6% 824 -24.6%
12-Month Avg* 347 -15.7% 983 -14.5%
Historical Inventory of Active Listings by Month
The number of properties available for sale in active status at the end of a given month.
* Active Listings for all properties from December 2021 through November 2022. This is not the
average of the individual figures above.
Current as of December 11, 2022. All data from the San Francisco Association of REALTORS® MLS. Report © 2022 ShowingTime. | 10
623
1,820
364
1,093
351
824
Single Family Condo/TIC/Coop
November
0
500
1,000
1,500
2,000
2,500
1-2005 1-2006 1-2007 1-2008 1-2009 1-2010 1-2011 1-2012 1-2013 1-2014 1-2015 1-2016 1-2017 1-2018 1-2019 1-2020 1-2021 1-2022
Single Family Condo/TIC/Coop
2020 2021 2022
- 24.6%
- 39.9%
- 3.6%
- 41.6%
2020 2021 2022
+ 40.0% + 138.2%
% of Properties Sold Over List Price
% of Properties
Sold Over List Price
Single
Family
Year-Over-Year
Change
Condo/TIC/
Coop
Year-Over-Year
Change
Dec-2021 78.7% +25.1% 46.5% +62.6%
Jan-2022 75.4% +30.4% 38.7% +76.7%
Feb-2022 86.8% +27.5% 58.4% +65.4%
Mar-2022 86.4% +17.1% 58.1% +35.4%
Apr-2022 88.7% +16.6% 62.9% +39.2%
May-2022 86.9% +9.0% 55.3% +3.6%
Jun-2022 86.3% +5.0% 57.3% +5.5%
Jul-2022 78.1% -6.5% 40.1% -27.9%
Aug-2022 75.7% -10.3% 37.3% -31.7%
Sep-2022 67.0% -20.7% 31.0% -43.1%
Oct-2022 64.2% -24.0% 37.8% -37.7%
Nov-2022 57.8% -27.3% 30.5% -45.3%
12-Month Avg 78.8% +1.9% 48.6% +1.5%
Historical % of Properties Sold Over List Price by Month
Percentage found when dividing the number of properties sold by properties sold over its original list price, not accounting for seller
concessions.
* % of Properties Sold Over List Price for all properties from December 2021 through November
2022. This is not the average of the individual figures above.
Current as of December 11, 2022. All data from the San Francisco Association of REALTORS® MLS. Report © 2022 ShowingTime. | 11
61.6%
32.8%
79.5%
55.8%
57.8%
30.5%
Single Family Condo/TIC/Coop
November
0.0%
20.0%
40.0%
60.0%
80.0%
100.0%
1-2005 1-2006 1-2007 1-2008 1-2009 1-2010 1-2011 1-2012 1-2013 1-2014 1-2015 1-2016 1-2017 1-2018 1-2019 1-2020 1-2021 1-2022
Single Family Condo/TIC/Coop
65.8%
42.1%
78.8%
49.5%
78.8%
48.8%
Single Family Condo/TIC/Coop
Year to Date
2020 2021 2022
- 45.3%
+ 70.1%
- 27.3%
+ 29.1% + 17.6%
0.0%
+ 19.8% - 1.4%
2020 2021 2022 2020 2021 2022 2020 2021 2022
- 20.2% - 15.0% - 29.7%
- 49.2%
% of List Price Received
% of List Price
Received
Single
Family
Year-Over-Year
Change
Condo/TIC/
Coop
Year-Over-Year
Change
Dec-2021 114.3% +7.8% 103.5% +4.2%
Jan-2022 117.4% +11.5% 101.1% +2.4%
Feb-2022 121.2% +10.5% 106.1% +5.4%
Mar-2022 121.9% +8.7% 106.4% +3.9%
Apr-2022 123.1% +8.2% 107.2% +3.4%
May-2022 119.6% +2.4% 105.9% +0.7%
Jun-2022 116.8% +0.5% 105.3% 0.0%
Jul-2022 110.9% -6.4% 101.5% -3.1%
Aug-2022 108.4% -6.6% 100.7% -3.5%
Sep-2022 108.5% -6.7% 100.6% -4.2%
Oct-2022 107.1% -8.5% 100.4% -4.8%
Nov-2022 104.9% -8.6% 99.2% -5.2%
12-Month Avg* 115.1% +1.0% 103.8% +0.3%
Historical % of List Price Received by Month
Percentage found when dividing a property’s sales price by its most recent list price, then taking the average for all properties sold in a given
month, not accounting for seller concessions.
* % of List Price Received for all properties from December 2021 through November 2022. This is
not the average of the individual figures above.
Current as of December 11, 2022. All data from the San Francisco Association of REALTORS® MLS. Report © 2022 ShowingTime. | 12
106.0%
100.2%
114.8%
104.6%
104.9%
99.2%
Single Family Condo/TIC/Coop
November
107.7%
101.4%
114.8%
103.9%
115.2%
103.8%
Single Family Condo/TIC/Coop
Year to Date
90.0%
100.0%
110.0%
120.0%
130.0%
1-2005 1-2006 1-2007 1-2008 1-2009 1-2010 1-2011 1-2012 1-2013 1-2014 1-2015 1-2016 1-2017 1-2018 1-2019 1-2020 1-2021 1-2022
Single Family Condo/TIC/Coop
2020 2021 2022
- 5.2%
+ 4.4%
- 8.6%
+ 8.3%
2020 2021 2022
- 5.3% - 4.7%
2020 2021 2022
- 0.1%
+ 2.5%
+ 0.3%
+ 6.6%
2020 2021 2022
- 4.4% - 3.9%
Housing Affordability Ratio
Housing
Affordability Ratio
Single
Family
Year-Over-Year
Change
Condo/TIC/
Coop
Year-Over-Year
Change
Dec-2021 32 -13.5% 49 -21.0%
Jan-2022 32 -11.1% 57 -9.5%
Feb-2022 27 -18.2% 49 -7.5%
Mar-2022 24 -25.0% 45 -13.5%
Apr-2022 21 -32.3% 37 -32.7%
May-2022 22 -26.7% 42 -22.2%
Jun-2022 23 -17.9% 40 -23.1%
Jul-2022 27 -10.0% 43 -20.4%
Aug-2022 28 -6.7% 51 -10.5%
Sep-2022 24 -25.0% 39 -29.1%
Oct-2022 23 -25.8% 37 -30.2%
Nov-2022 27 -10.0% 39 -27.8%
12-Month Avg* 26 -14.7% 44 -29.6%
Historical Housing Affordability Ratio by Month
This index measures housing affordability for the region. For example, an index of 120 means the median household income is 120% of what is
necessary to qualify for the median-priced home under prevailing interest rates. A higher number means greater affordability.
* Affordability Ratio for all properties from December 2021 through November 2022. This is not
the average of the individual figures above.
Current as of December 11, 2022. All data from the San Francisco Association of REALTORS® MLS. Report © 2022 ShowingTime. | 13
35
59
30
54
27
39
Single Family Condo/TIC/Coop
November
20
40
60
80
100
1-2005 1-2006 1-2007 1-2008 1-2009 1-2010 1-2011 1-2012 1-2013 1-2014 1-2015 1-2016 1-2017 1-2018 1-2019 1-2020 1-2021 1-2022
Single Family Condo/TIC/Coop
2020 2021 2022
- 27.8%
- 8.5%
- 10.0%
- 14.3%
2020 2021 2022
+ 2.9% + 13.5%
36
57
31
56
22
37
Single Family Condo/TIC/Coop
Year to Date
2020 2021 2022
- 33.9%
- 1.8%
- 29.0%
- 13.9%
2020 2021 2022
+ 9.1% + 11.8%
Months Supply of Inventory
Months Supply of
Inventory
Single
Family
Year-Over-Year
Change
Condo/TIC/
Coop
Year-Over-Year
Change
Dec-2021 0.8 -57.9% 1.8 -62.5%
Jan-2022 1.1 -42.1% 2.3 -54.0%
Feb-2022 1.2 -29.4% 2.7 -42.6%
Mar-2022 1.3 -18.8% 2.9 -27.5%
Apr-2022 1.4 -12.5% 3.2 -8.6%
May-2022 1.4 -12.5% 3.3 +6.5%
Jun-2022 1.6 0.0% 3.4 +13.3%
Jul-2022 1.6 0.0% 3.2 +10.3%
Aug-2022 1.6 0.0% 2.9 +3.6%
Sep-2022 2.3 +27.8% 3.7 +5.7%
Oct-2022 2.2 +15.8% 3.8 +8.6%
Nov-2022 1.7 +21.4% 3.1 +6.9%
12-Month Avg* 1.5 -10.2% 3.0 -16.9%
Historical Months Supply of Inventory by Month
The inventory of homes for sale at the end of a given month, divided by the average monthly pending sales from the last 12 months.
* Months Supply for all properties from December 2021 through November 2022. This is not the
average of the individual figures above.
Current as of December 11, 2022. All data from the San Francisco Association of REALTORS® MLS. Report © 2022 ShowingTime. | 14
3.1
8.1
1.4
2.9
1.7
3.1
Single Family Condo/TIC/Coop
November
0.0
2.0
4.0
6.0
8.0
10.0
12.0
1-2005 1-2006 1-2007 1-2008 1-2009 1-2010 1-2011 1-2012 1-2013 1-2014 1-2015 1-2016 1-2017 1-2018 1-2019 1-2020 1-2021 1-2022
Single Family Condo/TIC/Coop
2020 2021 2022
+ 6.9%
- 64.2%
+ 21.4%
- 54.8%
2020 2021 2022
+ 40.9% + 153.1%
All Properties Activity Overview
Key metrics by report month and for year-to-date (YTD) starting from the first of the year.
Key Metrics Historical Sparkbars 11-2021 11-2022 Percent Change YTD 2021 YTD 2022 Percent Change
Current as of December 11, 2022. All data from the San Francisco Association of REALTORS® MLS. Report © 2022 ShowingTime. | 15
Months Supply 2.3 2.5 + 8.7% -- -- --
Affordability Ratio 37 28 - 24.3%
% of List Price Received 108.8% 102.0% - 6.3% 108.2%
39
61.6% + 0.5%
+ 0.4%
26 - 33.3%
108.6%
% of Properties Sold Over List Price 65.7% 43.9% - 33.2% 61.3%
Active Listings 1,506 1,200 - 20.3% --
Avg. Sales Price $1,871,179 $1,635,051 - 12.6% $1,756,686
Days on Market 33 44 + 33.3% 37
$1,450,000 + 1.4%
- 0.6%
35 - 5.4%
$1,745,834
-- --
Sold Listings 723 392 - 45.8% 7,100 5,312 - 25.2%
Median Sales Price $1,505,000 $1,329,000 - 11.7% $1,430,000
- 10.2%
Pending Sales 624 369 - 40.9% 7,238 5,344 - 26.2%
New Listings 444 311 - 30.0% 9,013 8,090
11-2019 11-2020 11-2021 11-2022
11-2019 11-2020 11-2021 11-2022
11-2019 11-2020 11-2021 11-2022
11-2019 11-2020 11-2021 11-2022
11-2019 11-2020 11-2021 11-2022
11-2019 11-2020 11-2021 11-2022
11-2019 11-2020 11-2021 11-2022
11-2019 11-2020 11-2021 11-2022
11-2019 11-2020 11-2021 11-2022
11-2019 11-2020 11-2021 11-2022
11-2019 11-2020 11-2021 11-2022
Activity by District
SF District 1: Northwest (Sea Cliff, Lake, Jordan Park / Laurel Heights, Outer Richmond, Central Richmond, Inner Richmond, Lone Mountain)
SF District 2: Central West (Outer Sunset, Central Sunset, Inner Sunset, Outer Parkside, Parkside, Inner Parkside, Golden Gate Heights)
SF District 3: Southwest (Pine Lake Park, Lake Shore, Merced Manor, Stonestown, Lakeside, Merced Heights, Ingleside, Ingleside Heights, Oceanview)
SF District 4: Twin Peaks W (Forest Hill (& Ext), W Portal, St Francis Wd, Balboa Terr, Mt Dav Manor, Ingleside Terr, Monterey Hts, Wstwd Pk & H'lnds, Shrwd Fst, Miraloma Pk, Dmnd Hts, Mdtwn Terr)
SF District 5: Central (Haight Ashbury, Cole Vly / Prnssus Hts, Clarndn Hts, Corona Hts, Twin Pks, Glen Pk, Noe Vly, Eureka Vly / Dolores Hts, Mission Dolores, Duboce Trngl, Buena Vista / Ashbury Hts)
SF District 6: Central North (Lower Pacific Heights, Anza Vista, Western Addition, North Panhandle, Alamo Square, Hayes Valley)
SF District 7: North (Marina, Cow Hollow, Presidio Heights, Pacific Heights)
SF District 8: Northeast (North Waterfront, North Beach, Russian Hill, Telegraph Hill, Nob Hill, Financial District / Barbary Coast, Downtown, Van Ness / Civic Center, Tenderloin)
SF District 9: Central East (Yerba Buena, South Beach, South of Market, Mission Bay, Inner Mission, Potrero Hill, Central Waterfront / Dogpatch, Bernal Heights)
SF District 10: Southeast (Outer Mission, Mission Terr, Excelsior, Portola, Bayview, Silver Terr, Hunters Pt, Candlestick Pt, Bayview Hts, Little Hollywood, Visitation Vly, Crocker Amazon)
11-2021 11-2022 + / – 11-2021 11-2022 + / – 11-2021 11-2022 + / – 11-2021 11-2022 + / – 11-2021 11-2022 + / –
Single Family
1 SF District 1 23 32 +39.1% 36 19 -47.2% $3,025,000 $1,800,000 -40.5% 19 29 +52.6% 1.1 1.9 +72.7%
2 SF District 2 41 40 -2.4% 38 31 -18.4% $1,714,750 $1,450,000 -15.4% 17 21 +23.5% 0.9 1.0 +11.1%
3 SF District 3 25 22 -12.0% 18 11 -38.9% $1,552,500 $1,190,000 -23.3% 17 36 +111.8% 1.5 1.6 +6.7%
4 SF District 4 31 41 +32.3% 41 28 -31.7% $2,015,000 $1,785,000 -11.4% 20 28 +40.0% 0.8 1.5 +87.5%
5 SF District 5 47 44 -6.4% 47 24 -48.9% $2,750,000 $2,510,000 -8.7% 22 28 +27.3% 1.2 1.5 +25.0%
6 SF District 6 14 6 -57.1% 8 0 -100.0% $2,647,500 $0 -100.0% 10 0 -100.0% 2.9 1.7 -41.4%
7 SF District 7 45 34 -24.4% 18 6 -66.7% $4,762,500 $4,447,000 -6.6% 41 119 +190.2% 3.3 4.0 +21.2%
8 SF District 8 23 15 -34.8% 0 0 -- $0 $0 -- 0 0 -- 8.5 5.0 -41.2%
9 SF District 9 55 43 -21.8% 33 20 -39.4% $1,850,000 $1,544,250 -16.5% 21 30 +42.9% 1.9 2.0 +5.3%
10 SF District 10 60 74 +23.3% 54 46 -14.8% $1,174,500 $1,077,500 -8.3% 20 44 +120.0% 1.3 1.9 +46.2%
Condo/TIC/Coop
1 SF District 1 28 16 -42.9% 21 15 -28.6% $1,350,000 $1,355,000 +0.4% 30 37 +23.3% 1.5 1.1 -26.7%
2 SF District 2 14 16 +14.3% 5 3 -40.0% $760,000 $725,000 -4.6% 67 31 -53.7% 2.4 4.8 +100.0%
3 SF District 3 8 10 +25.0% 8 2 -75.0% $780,000 $798,500 +2.4% 35 63 +80.0% 1.9 3.2 +68.4%
4 SF District 4 15 10 -33.3% 5 3 -40.0% $780,000 $599,000 -23.2% 28 50 +78.6% 3.1 2.1 -32.3%
5 SF District 5 82 85 +3.7% 63 42 -33.3% $1,525,000 $1,399,000 -8.3% 28 31 +10.7% 1.4 1.8 +28.6%
6 SF District 6 95 57 -40.0% 48 33 -31.3% $1,138,500 $1,150,000 +1.0% 38 48 +26.3% 2.3 1.8 -21.7%
7 SF District 7 83 61 -26.5% 53 22 -58.5% $1,850,000 $1,689,584 -8.7% 36 52 +44.4% 2.0 2.3 +15.0%
8 SF District 8 242 172 -28.9% 73 31 -57.5% $1,270,000 $960,000 -24.4% 40 54 +35.0% 3.8 3.8 0.0%
9 SF District 9 482 372 -22.8% 137 49 -64.2% $1,100,000 $1,012,500 -8.0% 50 68 +36.0% 3.7 4.3 +16.2%
10 SF District 10 44 25 -43.2% 12 3 -75.0% $628,000 $549,000 -12.6% 73 124 +69.9% 5.1 3.6 -29.4%
Key metrics by report month for the districts of San Francisco.
Current as of December 11, 2022. All data from the San Francisco Association of REALTORS® MLS. Report © 2022 ShowingTime. | 16
Active Listings Sold Listings Median Sales Price Days on Market Months Supply

Weitere ähnliche Inhalte

Ähnlich wie San Francisco Market Report November 2022.pdf

San Francisco Market Report July 2022.pdf
San Francisco Market Report July 2022.pdfSan Francisco Market Report July 2022.pdf
San Francisco Market Report July 2022.pdfRonny Budiutama
 
San Francisco Market Report January 2022
San Francisco Market Report January 2022San Francisco Market Report January 2022
San Francisco Market Report January 2022Ronny Budiutama
 
San Francisco Market Report December 2021
San Francisco Market Report December 2021San Francisco Market Report December 2021
San Francisco Market Report December 2021Ronny Budiutama
 
San Francisco Market Report June 2022.pdf
San Francisco Market Report June 2022.pdfSan Francisco Market Report June 2022.pdf
San Francisco Market Report June 2022.pdfRonny Budiutama
 
San Francisco Market Report February 2023
San Francisco Market Report February 2023San Francisco Market Report February 2023
San Francisco Market Report February 2023Ronny Budiutama
 
San Francisco Market Report January 2023.pdf
San Francisco Market Report January 2023.pdfSan Francisco Market Report January 2023.pdf
San Francisco Market Report January 2023.pdfRonny Budiutama
 
San Francisco December 2023 Market Report
San Francisco December 2023 Market ReportSan Francisco December 2023 Market Report
San Francisco December 2023 Market ReportRonny Budiutama
 
San Francisco Market Report October 2021
San Francisco Market Report October 2021San Francisco Market Report October 2021
San Francisco Market Report October 2021Ronny Budiutama
 
October 2023 Report: San Francisco Real Estate Market Insights
October 2023 Report: San Francisco Real Estate Market InsightsOctober 2023 Report: San Francisco Real Estate Market Insights
October 2023 Report: San Francisco Real Estate Market InsightsRonny Budiutama
 
San Francisco May 2023 Market Report.pdf
San Francisco May 2023 Market Report.pdfSan Francisco May 2023 Market Report.pdf
San Francisco May 2023 Market Report.pdfRonny Budiutama
 
San Francisco Market Report November 2021
San Francisco Market Report November 2021San Francisco Market Report November 2021
San Francisco Market Report November 2021Ronny Budiutama
 
San Francisco November 2023 Market Report
San Francisco November 2023 Market ReportSan Francisco November 2023 Market Report
San Francisco November 2023 Market ReportRonny Budiutama
 
San Francisco June 2023 Market Report.pdf
San Francisco June 2023 Market Report.pdfSan Francisco June 2023 Market Report.pdf
San Francisco June 2023 Market Report.pdfRonny Budiutama
 
San Francisco market focus report December 2019
San Francisco market focus report December 2019San Francisco market focus report December 2019
San Francisco market focus report December 2019Ronny Budiutama
 
San Francisco Market Report August 2021
San Francisco Market Report August 2021San Francisco Market Report August 2021
San Francisco Market Report August 2021Ronny Budiutama
 
San Francisco January 2024 Market Report
San Francisco January 2024 Market ReportSan Francisco January 2024 Market Report
San Francisco January 2024 Market ReportRonny Budiutama
 
San Francisco Market Report For July 2021
San Francisco Market Report For July 2021San Francisco Market Report For July 2021
San Francisco Market Report For July 2021Ronny Budiutama
 
San Francisco Market Report September 2021
San Francisco Market Report September 2021San Francisco Market Report September 2021
San Francisco Market Report September 2021Ronny Budiutama
 
San Francisco Market Report March 2023.pdf
San Francisco Market Report March 2023.pdfSan Francisco Market Report March 2023.pdf
San Francisco Market Report March 2023.pdfRonny Budiutama
 
San Francisco Market Data October 2020
San Francisco Market Data October 2020San Francisco Market Data October 2020
San Francisco Market Data October 2020Ronny Budiutama
 

Ähnlich wie San Francisco Market Report November 2022.pdf (20)

San Francisco Market Report July 2022.pdf
San Francisco Market Report July 2022.pdfSan Francisco Market Report July 2022.pdf
San Francisco Market Report July 2022.pdf
 
San Francisco Market Report January 2022
San Francisco Market Report January 2022San Francisco Market Report January 2022
San Francisco Market Report January 2022
 
San Francisco Market Report December 2021
San Francisco Market Report December 2021San Francisco Market Report December 2021
San Francisco Market Report December 2021
 
San Francisco Market Report June 2022.pdf
San Francisco Market Report June 2022.pdfSan Francisco Market Report June 2022.pdf
San Francisco Market Report June 2022.pdf
 
San Francisco Market Report February 2023
San Francisco Market Report February 2023San Francisco Market Report February 2023
San Francisco Market Report February 2023
 
San Francisco Market Report January 2023.pdf
San Francisco Market Report January 2023.pdfSan Francisco Market Report January 2023.pdf
San Francisco Market Report January 2023.pdf
 
San Francisco December 2023 Market Report
San Francisco December 2023 Market ReportSan Francisco December 2023 Market Report
San Francisco December 2023 Market Report
 
San Francisco Market Report October 2021
San Francisco Market Report October 2021San Francisco Market Report October 2021
San Francisco Market Report October 2021
 
October 2023 Report: San Francisco Real Estate Market Insights
October 2023 Report: San Francisco Real Estate Market InsightsOctober 2023 Report: San Francisco Real Estate Market Insights
October 2023 Report: San Francisco Real Estate Market Insights
 
San Francisco May 2023 Market Report.pdf
San Francisco May 2023 Market Report.pdfSan Francisco May 2023 Market Report.pdf
San Francisco May 2023 Market Report.pdf
 
San Francisco Market Report November 2021
San Francisco Market Report November 2021San Francisco Market Report November 2021
San Francisco Market Report November 2021
 
San Francisco November 2023 Market Report
San Francisco November 2023 Market ReportSan Francisco November 2023 Market Report
San Francisco November 2023 Market Report
 
San Francisco June 2023 Market Report.pdf
San Francisco June 2023 Market Report.pdfSan Francisco June 2023 Market Report.pdf
San Francisco June 2023 Market Report.pdf
 
San Francisco market focus report December 2019
San Francisco market focus report December 2019San Francisco market focus report December 2019
San Francisco market focus report December 2019
 
San Francisco Market Report August 2021
San Francisco Market Report August 2021San Francisco Market Report August 2021
San Francisco Market Report August 2021
 
San Francisco January 2024 Market Report
San Francisco January 2024 Market ReportSan Francisco January 2024 Market Report
San Francisco January 2024 Market Report
 
San Francisco Market Report For July 2021
San Francisco Market Report For July 2021San Francisco Market Report For July 2021
San Francisco Market Report For July 2021
 
San Francisco Market Report September 2021
San Francisco Market Report September 2021San Francisco Market Report September 2021
San Francisco Market Report September 2021
 
San Francisco Market Report March 2023.pdf
San Francisco Market Report March 2023.pdfSan Francisco Market Report March 2023.pdf
San Francisco Market Report March 2023.pdf
 
San Francisco Market Data October 2020
San Francisco Market Data October 2020San Francisco Market Data October 2020
San Francisco Market Data October 2020
 

Kürzlich hochgeladen

call girls in ganesh nagar Delhi 8264348440 ✅ call girls ❤️
call girls in ganesh nagar Delhi 8264348440 ✅ call girls ❤️call girls in ganesh nagar Delhi 8264348440 ✅ call girls ❤️
call girls in ganesh nagar Delhi 8264348440 ✅ call girls ❤️soniya singh
 
Call Girls in shastri nagar Delhi 8264348440 ✅ call girls ❤️
Call Girls in shastri nagar Delhi 8264348440 ✅ call girls ❤️Call Girls in shastri nagar Delhi 8264348440 ✅ call girls ❤️
Call Girls in shastri nagar Delhi 8264348440 ✅ call girls ❤️soniya singh
 
TENANT SCREENING REPORT SERVICES​ How Tenant Screening Reports Work
TENANT SCREENING REPORT SERVICES​ How Tenant Screening Reports WorkTENANT SCREENING REPORT SERVICES​ How Tenant Screening Reports Work
TENANT SCREENING REPORT SERVICES​ How Tenant Screening Reports WorkTurbo Tenant
 
Maha Mauka Squarefeet Brochure |Maha Mauka Squarefeet PDF Brochure|
Maha Mauka Squarefeet Brochure |Maha Mauka Squarefeet PDF Brochure|Maha Mauka Squarefeet Brochure |Maha Mauka Squarefeet PDF Brochure|
Maha Mauka Squarefeet Brochure |Maha Mauka Squarefeet PDF Brochure|AkshayJoshi575980
 
Call Girls In Mayur Vihar Delhi ☆↫8447779280 ❤Escorts Service In Delhi
Call Girls In Mayur Vihar Delhi ☆↫8447779280 ❤Escorts Service In DelhiCall Girls In Mayur Vihar Delhi ☆↫8447779280 ❤Escorts Service In Delhi
Call Girls In Mayur Vihar Delhi ☆↫8447779280 ❤Escorts Service In Delhiasmaqueen5
 
9990771857 Call Girls in Dwarka Sector 1 Delhi (Call Girls) Delhi
9990771857 Call Girls in Dwarka Sector 1 Delhi (Call Girls) Delhi9990771857 Call Girls in Dwarka Sector 1 Delhi (Call Girls) Delhi
9990771857 Call Girls in Dwarka Sector 1 Delhi (Call Girls) Delhidelhimodel235
 
Kolte Patil Kharadi Pune E Brochure.pdf
Kolte Patil Kharadi Pune E  Brochure.pdfKolte Patil Kharadi Pune E  Brochure.pdf
Kolte Patil Kharadi Pune E Brochure.pdfabbu831446
 
Call Girls in Noida Sector 77 Noida 💯Call Us 🔝 9582086666 🔝 South Delhi Escor...
Call Girls in Noida Sector 77 Noida 💯Call Us 🔝 9582086666 🔝 South Delhi Escor...Call Girls in Noida Sector 77 Noida 💯Call Us 🔝 9582086666 🔝 South Delhi Escor...
Call Girls in Noida Sector 77 Noida 💯Call Us 🔝 9582086666 🔝 South Delhi Escor...delhimodel235
 
Call Girls In Chand Nagar (Delhi)+918447779280 Welcome To Vip Women Seeking M...
Call Girls In Chand Nagar (Delhi)+918447779280 Welcome To Vip Women Seeking M...Call Girls In Chand Nagar (Delhi)+918447779280 Welcome To Vip Women Seeking M...
Call Girls In Chand Nagar (Delhi)+918447779280 Welcome To Vip Women Seeking M...asmaqueen5
 
M3M 129 E Brochure Noida Expressway, Sector 129, Noida
M3M 129 E Brochure Noida Expressway, Sector 129, NoidaM3M 129 E Brochure Noida Expressway, Sector 129, Noida
M3M 129 E Brochure Noida Expressway, Sector 129, Noidasarak0han45400
 
Mahindra Happinest Tathawade Pune Brochure.pdf
Mahindra Happinest Tathawade Pune Brochure.pdfMahindra Happinest Tathawade Pune Brochure.pdf
Mahindra Happinest Tathawade Pune Brochure.pdfBabyrudram
 
M3M The Line Brochure - Premium Investment Opportunity for Commercial Ventures
M3M The Line Brochure - Premium Investment Opportunity for Commercial VenturesM3M The Line Brochure - Premium Investment Opportunity for Commercial Ventures
M3M The Line Brochure - Premium Investment Opportunity for Commercial Venturessheltercareglobal
 
Call Girls in Noida Sector 12 Noida 💯Call Us 🔝 9582086666 🔝 South Delhi Escor...
Call Girls in Noida Sector 12 Noida 💯Call Us 🔝 9582086666 🔝 South Delhi Escor...Call Girls in Noida Sector 12 Noida 💯Call Us 🔝 9582086666 🔝 South Delhi Escor...
Call Girls in Noida Sector 12 Noida 💯Call Us 🔝 9582086666 🔝 South Delhi Escor...delhimodel235
 
BDSM⚡Call Girls in Sector 57 Noida Escorts >༒8448380779 Escort Service
BDSM⚡Call Girls in Sector 57 Noida Escorts >༒8448380779 Escort ServiceBDSM⚡Call Girls in Sector 57 Noida Escorts >༒8448380779 Escort Service
BDSM⚡Call Girls in Sector 57 Noida Escorts >༒8448380779 Escort ServiceDelhi Call girls
 
Low Rate ↬Call Girls in Trilokpuri Delhi ↫8447779280}Escorts Service In Delhi
Low Rate ↬Call Girls in Trilokpuri Delhi ↫8447779280}Escorts Service In DelhiLow Rate ↬Call Girls in Trilokpuri Delhi ↫8447779280}Escorts Service In Delhi
Low Rate ↬Call Girls in Trilokpuri Delhi ↫8447779280}Escorts Service In Delhiasmaqueen5
 
9990771857 Call Girls in Dwarka Sector 6 Delhi (Call Girls) Delhi
9990771857 Call Girls in Dwarka Sector 6 Delhi (Call Girls) Delhi9990771857 Call Girls in Dwarka Sector 6 Delhi (Call Girls) Delhi
9990771857 Call Girls in Dwarka Sector 6 Delhi (Call Girls) Delhidelhimodel235
 
Best Deal Virtual Space in Satya The Hive Tata Zudio 750 Sqft 1.89 Cr All inc...
Best Deal Virtual Space in Satya The Hive Tata Zudio 750 Sqft 1.89 Cr All inc...Best Deal Virtual Space in Satya The Hive Tata Zudio 750 Sqft 1.89 Cr All inc...
Best Deal Virtual Space in Satya The Hive Tata Zudio 750 Sqft 1.89 Cr All inc...ApartmentWala1
 
Listing Turkey Sylvana Istanbul - Bahcesehir
Listing Turkey Sylvana Istanbul - BahcesehirListing Turkey Sylvana Istanbul - Bahcesehir
Listing Turkey Sylvana Istanbul - BahcesehirListing Turkey
 
Premium Villa Projects in Sarjapur Road Bengaluru
Premium Villa Projects in Sarjapur Road BengaluruPremium Villa Projects in Sarjapur Road Bengaluru
Premium Villa Projects in Sarjapur Road BengaluruShivaSeo3
 
9990771857 Call Girls in Dwarka Sector 137 Noida (Call Girls) Delhi
9990771857 Call Girls in Dwarka Sector 137 Noida (Call Girls) Delhi9990771857 Call Girls in Dwarka Sector 137 Noida (Call Girls) Delhi
9990771857 Call Girls in Dwarka Sector 137 Noida (Call Girls) Delhidelhimodel235
 

Kürzlich hochgeladen (20)

call girls in ganesh nagar Delhi 8264348440 ✅ call girls ❤️
call girls in ganesh nagar Delhi 8264348440 ✅ call girls ❤️call girls in ganesh nagar Delhi 8264348440 ✅ call girls ❤️
call girls in ganesh nagar Delhi 8264348440 ✅ call girls ❤️
 
Call Girls in shastri nagar Delhi 8264348440 ✅ call girls ❤️
Call Girls in shastri nagar Delhi 8264348440 ✅ call girls ❤️Call Girls in shastri nagar Delhi 8264348440 ✅ call girls ❤️
Call Girls in shastri nagar Delhi 8264348440 ✅ call girls ❤️
 
TENANT SCREENING REPORT SERVICES​ How Tenant Screening Reports Work
TENANT SCREENING REPORT SERVICES​ How Tenant Screening Reports WorkTENANT SCREENING REPORT SERVICES​ How Tenant Screening Reports Work
TENANT SCREENING REPORT SERVICES​ How Tenant Screening Reports Work
 
Maha Mauka Squarefeet Brochure |Maha Mauka Squarefeet PDF Brochure|
Maha Mauka Squarefeet Brochure |Maha Mauka Squarefeet PDF Brochure|Maha Mauka Squarefeet Brochure |Maha Mauka Squarefeet PDF Brochure|
Maha Mauka Squarefeet Brochure |Maha Mauka Squarefeet PDF Brochure|
 
Call Girls In Mayur Vihar Delhi ☆↫8447779280 ❤Escorts Service In Delhi
Call Girls In Mayur Vihar Delhi ☆↫8447779280 ❤Escorts Service In DelhiCall Girls In Mayur Vihar Delhi ☆↫8447779280 ❤Escorts Service In Delhi
Call Girls In Mayur Vihar Delhi ☆↫8447779280 ❤Escorts Service In Delhi
 
9990771857 Call Girls in Dwarka Sector 1 Delhi (Call Girls) Delhi
9990771857 Call Girls in Dwarka Sector 1 Delhi (Call Girls) Delhi9990771857 Call Girls in Dwarka Sector 1 Delhi (Call Girls) Delhi
9990771857 Call Girls in Dwarka Sector 1 Delhi (Call Girls) Delhi
 
Kolte Patil Kharadi Pune E Brochure.pdf
Kolte Patil Kharadi Pune E  Brochure.pdfKolte Patil Kharadi Pune E  Brochure.pdf
Kolte Patil Kharadi Pune E Brochure.pdf
 
Call Girls in Noida Sector 77 Noida 💯Call Us 🔝 9582086666 🔝 South Delhi Escor...
Call Girls in Noida Sector 77 Noida 💯Call Us 🔝 9582086666 🔝 South Delhi Escor...Call Girls in Noida Sector 77 Noida 💯Call Us 🔝 9582086666 🔝 South Delhi Escor...
Call Girls in Noida Sector 77 Noida 💯Call Us 🔝 9582086666 🔝 South Delhi Escor...
 
Call Girls In Chand Nagar (Delhi)+918447779280 Welcome To Vip Women Seeking M...
Call Girls In Chand Nagar (Delhi)+918447779280 Welcome To Vip Women Seeking M...Call Girls In Chand Nagar (Delhi)+918447779280 Welcome To Vip Women Seeking M...
Call Girls In Chand Nagar (Delhi)+918447779280 Welcome To Vip Women Seeking M...
 
M3M 129 E Brochure Noida Expressway, Sector 129, Noida
M3M 129 E Brochure Noida Expressway, Sector 129, NoidaM3M 129 E Brochure Noida Expressway, Sector 129, Noida
M3M 129 E Brochure Noida Expressway, Sector 129, Noida
 
Mahindra Happinest Tathawade Pune Brochure.pdf
Mahindra Happinest Tathawade Pune Brochure.pdfMahindra Happinest Tathawade Pune Brochure.pdf
Mahindra Happinest Tathawade Pune Brochure.pdf
 
M3M The Line Brochure - Premium Investment Opportunity for Commercial Ventures
M3M The Line Brochure - Premium Investment Opportunity for Commercial VenturesM3M The Line Brochure - Premium Investment Opportunity for Commercial Ventures
M3M The Line Brochure - Premium Investment Opportunity for Commercial Ventures
 
Call Girls in Noida Sector 12 Noida 💯Call Us 🔝 9582086666 🔝 South Delhi Escor...
Call Girls in Noida Sector 12 Noida 💯Call Us 🔝 9582086666 🔝 South Delhi Escor...Call Girls in Noida Sector 12 Noida 💯Call Us 🔝 9582086666 🔝 South Delhi Escor...
Call Girls in Noida Sector 12 Noida 💯Call Us 🔝 9582086666 🔝 South Delhi Escor...
 
BDSM⚡Call Girls in Sector 57 Noida Escorts >༒8448380779 Escort Service
BDSM⚡Call Girls in Sector 57 Noida Escorts >༒8448380779 Escort ServiceBDSM⚡Call Girls in Sector 57 Noida Escorts >༒8448380779 Escort Service
BDSM⚡Call Girls in Sector 57 Noida Escorts >༒8448380779 Escort Service
 
Low Rate ↬Call Girls in Trilokpuri Delhi ↫8447779280}Escorts Service In Delhi
Low Rate ↬Call Girls in Trilokpuri Delhi ↫8447779280}Escorts Service In DelhiLow Rate ↬Call Girls in Trilokpuri Delhi ↫8447779280}Escorts Service In Delhi
Low Rate ↬Call Girls in Trilokpuri Delhi ↫8447779280}Escorts Service In Delhi
 
9990771857 Call Girls in Dwarka Sector 6 Delhi (Call Girls) Delhi
9990771857 Call Girls in Dwarka Sector 6 Delhi (Call Girls) Delhi9990771857 Call Girls in Dwarka Sector 6 Delhi (Call Girls) Delhi
9990771857 Call Girls in Dwarka Sector 6 Delhi (Call Girls) Delhi
 
Best Deal Virtual Space in Satya The Hive Tata Zudio 750 Sqft 1.89 Cr All inc...
Best Deal Virtual Space in Satya The Hive Tata Zudio 750 Sqft 1.89 Cr All inc...Best Deal Virtual Space in Satya The Hive Tata Zudio 750 Sqft 1.89 Cr All inc...
Best Deal Virtual Space in Satya The Hive Tata Zudio 750 Sqft 1.89 Cr All inc...
 
Listing Turkey Sylvana Istanbul - Bahcesehir
Listing Turkey Sylvana Istanbul - BahcesehirListing Turkey Sylvana Istanbul - Bahcesehir
Listing Turkey Sylvana Istanbul - Bahcesehir
 
Premium Villa Projects in Sarjapur Road Bengaluru
Premium Villa Projects in Sarjapur Road BengaluruPremium Villa Projects in Sarjapur Road Bengaluru
Premium Villa Projects in Sarjapur Road Bengaluru
 
9990771857 Call Girls in Dwarka Sector 137 Noida (Call Girls) Delhi
9990771857 Call Girls in Dwarka Sector 137 Noida (Call Girls) Delhi9990771857 Call Girls in Dwarka Sector 137 Noida (Call Girls) Delhi
9990771857 Call Girls in Dwarka Sector 137 Noida (Call Girls) Delhi
 

San Francisco Market Report November 2022.pdf

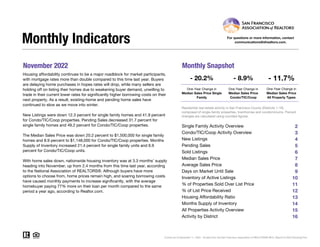
  • 1. November 2022 Monthly Snapshot One-Year Change in One-Year Change in Median Sales Price Single Family Median Sales Price Condo/TIC/Coop 2 3 4 5 6 7 8 9 10 11 12 13 14 15 16 Monthly Indicators - 20.2% - 8.9% - 11.7% One-Year Change in Housing affordability continues to be a major roadblock for market participants, with mortgage rates more than double compared to this time last year. Buyers are delaying home purchases in hopes rates will drop, while many sellers are holding off on listing their homes due to weakening buyer demand, unwilling to trade in their current lower rates for significantly higher borrowing costs on their next property. As a result, existing-home and pending home sales have continued to slow as we move into winter. New Listings were down 12.3 percent for single family homes and 41.9 percent for Condo/TIC/Coop properties. Pending Sales decreased 31.7 percent for single family homes and 49.2 percent for Condo/TIC/Coop properties. The Median Sales Price was down 20.2 percent to $1,500,000 for single family homes and 8.9 percent to $1,148,000 for Condo/TIC/Coop properties. Months Supply of Inventory increased 21.4 percent for single family units and 6.9 percent for Condo/TIC/Coop units. With home sales down, nationwide housing inventory was at 3.3 months’ supply heading into November, up from 2.4 months from this time last year, according to the National Association of REALTORS®. Although buyers have more options to choose from, home prices remain high, and soaring borrowing costs have caused monthly payments to increase significantly, with the average homebuyer paying 77% more on their loan per month compared to the same period a year ago, according to Realtor.com. Median Sales Price All Property Types Residential real estate activity in San Francisco County (Districts 1-10) composed of single-family properties, townhomes and condominiums. Percent changes are calculated using rounded figures. Single Family Activity Overview Months Supply of Inventory For questions or more information, contact communications@sfrealtors.com. Current as of December 11, 2022. All data from the San Francisco Association of REALTORS® MLS. Report © 2022 ShowingTime. Condo/TIC/Coop Activity Overview Inventory of Active Listings % of Properties Sold Over List Price % of List Price Received Housing Affordability Ratio All Properties Activity Overview New Listings Pending Sales Sold Listings Median Sales Price Average Sales Price Days on Market Until Sale Activity by District
  • 2. Single Family Activity Overview Key metrics by report month and for year-to-date (YTD) starting from the first of the year. Key Metrics Historical Sparkbars 11-2021 11-2022 Percent Change YTD 2021 YTD 2022 Percent Change Current as of December 11, 2022. All data from the San Francisco Association of REALTORS® MLS. Report © 2022 ShowingTime. | 2 Months Supply 1.4 1.7 + 21.4% -- -- -- Affordability Ratio 30 27 - 10.0% % of List Price Received 114.8% 104.9% - 8.6% 114.8% 31 78.8% 0.0% + 0.3% 22 - 29.0% 115.2% % of Properties Sold Over List Price 79.5% 57.8% - 27.3% 78.8% Active Listings 364 351 - 3.6% -- Avg. Sales Price $2,352,087 $1,900,681 - 19.2% $2,306,253 Days on Market 21 35 + 66.7% 23 23 0.0% $2,232,183 -- -- Median Sales Price $1,880,000 $1,500,000 - 20.2% $1,810,000 Sold Listings 293 185 - 36.9% 2,835 New Listings 171 150 - 12.3% 3,377 Pending Sales 259 177 - 31.7% - 21.0% 2,897 2,290 - 9.5% 3,056 2,260 - 20.3% $1,800,000 - 0.6% - 3.2% 11-2019 11-2020 11-2021 11-2022 11-2019 11-2020 11-2021 11-2022 11-2019 11-2020 11-2021 11-2022 11-2019 11-2020 11-2021 11-2022 11-2019 11-2020 11-2021 11-2022 11-2019 11-2020 11-2021 11-2022 11-2019 11-2020 11-2021 11-2022 11-2019 11-2020 11-2021 11-2022 11-2019 11-2020 11-2021 11-2022 11-2019 11-2020 11-2021 11-2022 11-2019 11-2020 11-2021 11-2022
  • 3. Condo/TIC/Coop Activity Overview Key metrics by report month and for year-to-date (YTD) starting from the first of the year. Key Metrics Historical Sparkbars 11-2021 11-2022 Percent Change YTD 2021 YTD 2022 Percent Change Current as of December 11, 2022. All data from the San Francisco Association of REALTORS® MLS. Report © 2022 ShowingTime. | 3 Months Supply 2.9 3.1 + 6.9% -- -- -- Affordability Ratio 54 39 - 27.8% % of List Price Received 104.6% 99.2% - 5.2% 103.9% 56 48.8% - 1.4% - 0.1% 37 - 33.9% 103.8% % of Properties Sold Over List Price 55.8% 30.5% - 45.3% 49.5% Active Listings 1,093 824 - 24.6% -- Avg. Sales Price $1,538,838 $1,404,199 - 8.7% $1,384,331 Days on Market 41 51 + 24.4% 46 $1,200,000 - 0.4% + 0.2% 43 - 6.5% $1,386,784 -- -- Sold Listings 425 203 - 52.2% 4,182 2,990 - 28.5% Median Sales Price $1,260,000 $1,148,000 - 8.9% $1,205,000 - 10.2% Pending Sales 360 183 - 49.2% 4,260 2,988 - 29.9% New Listings 265 154 - 41.9% 5,494 4,934 11-2019 11-2020 11-2021 11-2022 11-2019 11-2020 11-2021 11-2022 11-2019 11-2020 11-2021 11-2022 11-2019 11-2020 11-2021 11-2022 11-2019 11-2020 11-2021 11-2022 11-2019 11-2020 11-2021 11-2022 11-2019 11-2020 11-2021 11-2022 11-2019 11-2020 11-2021 11-2022 11-2019 11-2020 11-2021 11-2022 11-2019 11-2020 11-2021 11-2022 11-2019 11-2020 11-2021 11-2022
  • 4. New Listings New Listings Single Family Year-Over-Year Change Condo/TIC/ Coop Year-Over-Year Change Dec-2021 83 -33.1% 147 -7.5% Jan-2022 228 -9.9% 473 -12.1% Feb-2022 288 +14.7% 535 +6.4% Mar-2022 343 +5.9% 614 +13.7% Apr-2022 329 -4.9% 542 +0.2% May-2022 302 -15.2% 517 +1.4% Jun-2022 322 -4.2% 448 -10.4% Jul-2022 242 -20.9% 381 -16.8% Aug-2022 239 -13.7% 308 -20.6% Sep-2022 370 -12.7% 579 -19.8% Oct-2022 243 -27.0% 383 -27.6% Nov-2022 150 -12.3% 154 -41.9% 12-Month Avg 262 -10.3% 423 -10.1% Historical New Listings by Month Current as of December 11, 2022. All data from the San Francisco Association of REALTORS® MLS. Report © 2022 ShowingTime. | 4 A count of the properties that have been newly listed on the market in a given month. 241 269 171 265 150 154 Single Family Condo/TIC/Coop November 0 200 400 600 800 1-2005 1-2006 1-2007 1-2008 1-2009 1-2010 1-2011 1-2012 1-2013 1-2014 1-2015 1-2016 1-2017 1-2018 1-2019 1-2020 1-2021 1-2022 Single Family Condo/TIC/Coop 3,205 5,098 3,377 5,494 3,056 4,934 Single Family Condo/TIC/Coop Year to Date 2020 2021 2022 - 41.9% - 1.5% - 12.3% - 29.0% + 7.8% - 9.5% + 5.4% - 10.2% 2020 2021 2022 2020 2021 2022 2020 2021 2022 + 39.3% + 11.1% + 33.5% + 70.3%
  • 5. Pending Sales Pending Sales Single Family Year-Over-Year Change Condo/TIC/ Coop Year-Over-Year Change Dec-2021 129 -35.8% 226 -26.4% Jan-2022 145 -14.2% 251 -14.0% Feb-2022 216 -4.4% 287 -24.7% Mar-2022 288 -0.3% 436 -8.0% Apr-2022 269 -5.9% 345 -28.1% May-2022 249 -18.9% 332 -28.3% Jun-2022 198 -27.7% 258 -33.5% Jul-2022 183 -29.3% 222 -39.0% Aug-2022 179 -20.8% 232 -26.6% Sep-2022 188 -42.9% 215 -36.2% Oct-2022 198 -27.5% 227 -44.0% Nov-2022 177 -31.7% 183 -49.2% 12-Month Avg 202 -21.9% 268 -29.6% Historical Pending Sales by Month A count of the properties on which offers have been accepted in a given month. Current as of December 11, 2022. All data from the San Francisco Association of REALTORS® MLS. Report © 2022 ShowingTime. | 5 306 300 259 360 177 183 Single Family Condo/TIC/Coop November 0 100 200 300 400 500 600 1-2005 1-2006 1-2007 1-2008 1-2009 1-2010 1-2011 1-2012 1-2013 1-2014 1-2015 1-2016 1-2017 1-2018 1-2019 1-2020 1-2021 1-2022 Single Family Condo/TIC/Coop 2,313 2,542 2,897 4,260 2,290 2,988 Single Family Condo/TIC/Coop Year to Date 2020 2021 2022 - 49.2% + 20.0% - 31.7% - 15.4% + 67.6% - 21.0% + 25.2% - 29.9% 2020 2021 2022 2020 2021 2022 2020 2021 2022 + 37.8% + 0.0% - 7.7% + 26.6%
  • 6. Sold Listings Sold Listings Single Family Year-Over-Year Change Condo/TIC/ Coop Year-Over-Year Change Dec-2021 216 -28.5% 325 -7.9% Jan-2022 130 -19.3% 186 -31.1% Feb-2022 159 -2.5% 250 -10.1% Mar-2022 257 -5.2% 394 -13.8% Apr-2022 257 -11.1% 380 -17.7% May-2022 282 +6.0% 368 -17.1% Jun-2022 249 -23.6% 309 -34.7% Jul-2022 183 -28.2% 232 -37.1% Aug-2022 189 -26.2% 236 -32.2% Sep-2022 179 -26.9% 210 -28.1% Oct-2022 190 -38.7% 222 -39.0% Nov-2022 185 -36.9% 203 -52.2% 12-Month Avg 206 -21.1% 276 -26.9% Historical Sold Listings by Month A count of the actual sales that closed in a given month. Current as of December 11, 2022. All data from the San Francisco Association of REALTORS® MLS. Report © 2022 ShowingTime. | 6 284 341 293 425 185 203 Single Family Condo/TIC/Coop November 0 100 200 300 400 500 1-2005 1-2006 1-2007 1-2008 1-2009 1-2010 1-2011 1-2012 1-2013 1-2014 1-2015 1-2016 1-2017 1-2018 1-2019 1-2020 1-2021 1-2022 Single Family Condo/TIC/Coop 2,161 2,435 2,835 4,182 2,260 2,990 Single Family Condo/TIC/Coop Year to Date 2020 2021 2022 - 52.2% + 24.6% - 36.9% + 3.2% + 71.7% - 20.3% + 31.2% - 28.5% 2020 2021 2022 2020 2021 2022 2020 2021 2022 + 26.8% - 3.2% - 8.5% + 25.8%
  • 7. Median Sales Price Median Sales Price Single Family Year-Over-Year Change Condo/TIC/ Coop Year-Over-Year Change Dec-2021 $1,690,000 +9.0% $1,300,000 +18.2% Jan-2022 $1,630,000 +3.5% $1,070,000 -0.2% Feb-2022 $1,930,000 +17.0% $1,227,500 +2.6% Mar-2022 $2,000,000 +15.9% $1,206,750 -1.2% Apr-2022 $2,050,000 +13.9% $1,362,500 +13.5% May-2022 $2,007,500 +6.4% $1,215,000 -1.1% Jun-2022 $1,880,000 -3.1% $1,240,000 -0.8% Jul-2022 $1,670,000 -9.7% $1,198,500 -1.0% Aug-2022 $1,610,000 -12.9% $997,500 -13.3% Sep-2022 $1,650,000 -5.7% $1,160,000 -3.3% Oct-2022 $1,670,000 -7.5% $1,200,000 -3.8% Nov-2022 $1,500,000 -20.2% $1,148,000 -8.9% 12-Month Avg* $1,800,000 0.0% $1,210,000 +0.8% Historical Median Sales Price by Month Point at which half of the sales sold for more and half sold for less, not accounting for seller concessions, in a given month. * Median Sales Price for all properties from December 2021 through November 2022. This is not the average of the individual figures above. Current as of December 11, 2022. All data from the San Francisco Association of REALTORS® MLS. Report © 2022 ShowingTime. | 7 $1,637,500 $1,172,125 $1,880,000 $1,260,000 $1,500,000 $1,148,000 Single Family Condo/TIC/Coop November $500,000 $750,000 $1,000,000 $1,250,000 $1,500,000 $1,750,000 $2,000,000 $2,250,000 1-2005 1-2006 1-2007 1-2008 1-2009 1-2010 1-2011 1-2012 1-2013 1-2014 1-2015 1-2016 1-2017 1-2018 1-2019 1-2020 1-2021 1-2022 Single Family Condo/TIC/Coop $1,620,000 $1,200,000 $1,810,000 $1,205,000 $1,800,000 $1,200,000 Single Family Condo/TIC/Coop Year to Date 2020 2021 2022 - 8.9% + 7.5% - 20.2% + 14.8% + 0.4% - 0.6% + 11.7% - 0.4% 2020 2021 2022 2020 2021 2022 2020 2021 2022 + 7.2% + 2.8% - 0.4% + 0.2%
  • 8. Average Sales Price Average Sales Price Single Family Year-Over-Year Change Condo/TIC/ Coop Year-Over-Year Change Dec-2021 $2,365,749 +17.5% $1,488,734 +16.1% Jan-2022 $1,971,756 +1.3% $1,311,263 +8.3% Feb-2022 $2,417,245 +7.1% $1,398,389 +4.0% Mar-2022 $2,534,210 +14.6% $1,411,860 +3.1% Apr-2022 $2,515,877 +3.5% $1,464,116 +8.7% May-2022 $2,411,895 -2.7% $1,403,132 +1.7% Jun-2022 $2,355,940 -5.8% $1,366,119 -1.5% Jul-2022 $2,061,331 -10.1% $1,471,068 +8.4% Aug-2022 $1,950,088 -8.4% $1,175,621 -17.5% Sep-2022 $1,886,008 -12.9% $1,343,336 +0.8% Oct-2022 $2,128,399 -9.8% $1,423,422 -2.6% Nov-2022 $1,900,681 -19.2% $1,404,199 -8.7% 12-Month Avg* $2,243,835 -1.5% $1,396,782 +1.5% Historical Average Sales Price by Month Average sales price for all closed sales, not accounting for seller concessions, in a given month. * Avg. Sales Price for all properties from December 2021 through November 2022. This is not the average of the individual figures above. Current as of December 11, 2022. All data from the San Francisco Association of REALTORS® MLS. Report © 2022 ShowingTime. | 8 $2,035,750 $1,270,960 $2,352,087 $1,538,838 $1,900,681 $1,404,199 Single Family Condo/TIC/Coop November $500,000 $1,000,000 $1,500,000 $2,000,000 $2,500,000 $3,000,000 1-2005 1-2006 1-2007 1-2008 1-2009 1-2010 1-2011 1-2012 1-2013 1-2014 1-2015 1-2016 1-2017 1-2018 1-2019 1-2020 1-2021 1-2022 Single Family Condo/TIC/Coop $2,003,109 $1,320,900 $2,306,253 $1,384,331 $2,232,183 $1,386,784 Single Family Condo/TIC/Coop Year to Date 2020 2021 2022 - 8.7% + 21.1% - 19.2% + 15.5% + 4.8% - 3.2% + 15.1% + 0.2% 2020 2021 2022 2020 2021 2022 2020 2021 2022 + 6.6% + 2.1% - 2.0% - 3.1%
  • 9. Days on Market Until Sale Days on Market Until Sale Single Family Year-Over-Year Change Condo/TIC/ Coop Year-Over-Year Change Dec-2021 31 -13.9% 47 -26.6% Jan-2022 41 +2.5% 68 -9.3% Feb-2022 22 -35.3% 36 -45.5% Mar-2022 16 -38.5% 34 -29.2% Apr-2022 16 -20.0% 32 -31.9% May-2022 21 +5.0% 37 -5.1% Jun-2022 17 -10.5% 39 +5.4% Jul-2022 21 +10.5% 49 +16.7% Aug-2022 26 +4.0% 50 +16.3% Sep-2022 28 +21.7% 58 +45.0% Oct-2022 28 +40.0% 42 +16.7% Nov-2022 35 +66.7% 51 +24.4% 12-Month Avg* 24 -1.9% 43 -8.1% Historical Days on Market Until Sale by Month Average number of days between when a property is listed and when an offer is accepted in a given month. * Days on Market for all properties from December 2021 through November 2022. This is not the average of the individual figures above. Current as of December 11, 2022. All data from the San Francisco Association of REALTORS® MLS. Report © 2022 ShowingTime. | 9 34 51 21 41 35 51 Single Family Condo/TIC/Coop November 0 20 40 60 80 100 120 1-2005 1-2006 1-2007 1-2008 1-2009 1-2010 1-2011 1-2012 1-2013 1-2014 1-2015 1-2016 1-2017 1-2018 1-2019 1-2020 1-2021 1-2022 Single Family Condo/TIC/Coop 28 43 23 46 23 43 Single Family Condo/TIC/Coop Year to Date 2020 2021 2022 + 24.4% - 19.6% + 66.7% - 38.2% + 7.0% 0.0% - 17.9% - 6.5% 2020 2021 2022 2020 2021 2022 2020 2021 2022 + 36.0% + 3.7% + 13.2% + 50.0%
  • 10. Inventory of Active Listings Inventory of Active Listings Single Family Year-Over-Year Change Condo/TIC/ Coop Year-Over-Year Change Dec-2021 206 -48.2% 677 -40.8% Jan-2022 263 -34.6% 835 -33.0% Feb-2022 302 -20.5% 994 -19.6% Mar-2022 320 -12.6% 1,050 -8.6% Apr-2022 339 -13.7% 1,111 -0.1% May-2022 334 -17.5% 1,122 +4.8% Jun-2022 380 -8.7% 1,100 +3.8% Jul-2022 369 -13.2% 1,016 -4.2% Aug-2022 352 -18.1% 888 -13.4% Sep-2022 484 +2.1% 1,099 -15.6% Oct-2022 468 -4.3% 1,084 -16.9% Nov-2022 351 -3.6% 824 -24.6% 12-Month Avg* 347 -15.7% 983 -14.5% Historical Inventory of Active Listings by Month The number of properties available for sale in active status at the end of a given month. * Active Listings for all properties from December 2021 through November 2022. This is not the average of the individual figures above. Current as of December 11, 2022. All data from the San Francisco Association of REALTORS® MLS. Report © 2022 ShowingTime. | 10 623 1,820 364 1,093 351 824 Single Family Condo/TIC/Coop November 0 500 1,000 1,500 2,000 2,500 1-2005 1-2006 1-2007 1-2008 1-2009 1-2010 1-2011 1-2012 1-2013 1-2014 1-2015 1-2016 1-2017 1-2018 1-2019 1-2020 1-2021 1-2022 Single Family Condo/TIC/Coop 2020 2021 2022 - 24.6% - 39.9% - 3.6% - 41.6% 2020 2021 2022 + 40.0% + 138.2%
  • 11. % of Properties Sold Over List Price % of Properties Sold Over List Price Single Family Year-Over-Year Change Condo/TIC/ Coop Year-Over-Year Change Dec-2021 78.7% +25.1% 46.5% +62.6% Jan-2022 75.4% +30.4% 38.7% +76.7% Feb-2022 86.8% +27.5% 58.4% +65.4% Mar-2022 86.4% +17.1% 58.1% +35.4% Apr-2022 88.7% +16.6% 62.9% +39.2% May-2022 86.9% +9.0% 55.3% +3.6% Jun-2022 86.3% +5.0% 57.3% +5.5% Jul-2022 78.1% -6.5% 40.1% -27.9% Aug-2022 75.7% -10.3% 37.3% -31.7% Sep-2022 67.0% -20.7% 31.0% -43.1% Oct-2022 64.2% -24.0% 37.8% -37.7% Nov-2022 57.8% -27.3% 30.5% -45.3% 12-Month Avg 78.8% +1.9% 48.6% +1.5% Historical % of Properties Sold Over List Price by Month Percentage found when dividing the number of properties sold by properties sold over its original list price, not accounting for seller concessions. * % of Properties Sold Over List Price for all properties from December 2021 through November 2022. This is not the average of the individual figures above. Current as of December 11, 2022. All data from the San Francisco Association of REALTORS® MLS. Report © 2022 ShowingTime. | 11 61.6% 32.8% 79.5% 55.8% 57.8% 30.5% Single Family Condo/TIC/Coop November 0.0% 20.0% 40.0% 60.0% 80.0% 100.0% 1-2005 1-2006 1-2007 1-2008 1-2009 1-2010 1-2011 1-2012 1-2013 1-2014 1-2015 1-2016 1-2017 1-2018 1-2019 1-2020 1-2021 1-2022 Single Family Condo/TIC/Coop 65.8% 42.1% 78.8% 49.5% 78.8% 48.8% Single Family Condo/TIC/Coop Year to Date 2020 2021 2022 - 45.3% + 70.1% - 27.3% + 29.1% + 17.6% 0.0% + 19.8% - 1.4% 2020 2021 2022 2020 2021 2022 2020 2021 2022 - 20.2% - 15.0% - 29.7% - 49.2%
  • 12. % of List Price Received % of List Price Received Single Family Year-Over-Year Change Condo/TIC/ Coop Year-Over-Year Change Dec-2021 114.3% +7.8% 103.5% +4.2% Jan-2022 117.4% +11.5% 101.1% +2.4% Feb-2022 121.2% +10.5% 106.1% +5.4% Mar-2022 121.9% +8.7% 106.4% +3.9% Apr-2022 123.1% +8.2% 107.2% +3.4% May-2022 119.6% +2.4% 105.9% +0.7% Jun-2022 116.8% +0.5% 105.3% 0.0% Jul-2022 110.9% -6.4% 101.5% -3.1% Aug-2022 108.4% -6.6% 100.7% -3.5% Sep-2022 108.5% -6.7% 100.6% -4.2% Oct-2022 107.1% -8.5% 100.4% -4.8% Nov-2022 104.9% -8.6% 99.2% -5.2% 12-Month Avg* 115.1% +1.0% 103.8% +0.3% Historical % of List Price Received by Month Percentage found when dividing a property’s sales price by its most recent list price, then taking the average for all properties sold in a given month, not accounting for seller concessions. * % of List Price Received for all properties from December 2021 through November 2022. This is not the average of the individual figures above. Current as of December 11, 2022. All data from the San Francisco Association of REALTORS® MLS. Report © 2022 ShowingTime. | 12 106.0% 100.2% 114.8% 104.6% 104.9% 99.2% Single Family Condo/TIC/Coop November 107.7% 101.4% 114.8% 103.9% 115.2% 103.8% Single Family Condo/TIC/Coop Year to Date 90.0% 100.0% 110.0% 120.0% 130.0% 1-2005 1-2006 1-2007 1-2008 1-2009 1-2010 1-2011 1-2012 1-2013 1-2014 1-2015 1-2016 1-2017 1-2018 1-2019 1-2020 1-2021 1-2022 Single Family Condo/TIC/Coop 2020 2021 2022 - 5.2% + 4.4% - 8.6% + 8.3% 2020 2021 2022 - 5.3% - 4.7% 2020 2021 2022 - 0.1% + 2.5% + 0.3% + 6.6% 2020 2021 2022 - 4.4% - 3.9%
  • 13. Housing Affordability Ratio Housing Affordability Ratio Single Family Year-Over-Year Change Condo/TIC/ Coop Year-Over-Year Change Dec-2021 32 -13.5% 49 -21.0% Jan-2022 32 -11.1% 57 -9.5% Feb-2022 27 -18.2% 49 -7.5% Mar-2022 24 -25.0% 45 -13.5% Apr-2022 21 -32.3% 37 -32.7% May-2022 22 -26.7% 42 -22.2% Jun-2022 23 -17.9% 40 -23.1% Jul-2022 27 -10.0% 43 -20.4% Aug-2022 28 -6.7% 51 -10.5% Sep-2022 24 -25.0% 39 -29.1% Oct-2022 23 -25.8% 37 -30.2% Nov-2022 27 -10.0% 39 -27.8% 12-Month Avg* 26 -14.7% 44 -29.6% Historical Housing Affordability Ratio by Month This index measures housing affordability for the region. For example, an index of 120 means the median household income is 120% of what is necessary to qualify for the median-priced home under prevailing interest rates. A higher number means greater affordability. * Affordability Ratio for all properties from December 2021 through November 2022. This is not the average of the individual figures above. Current as of December 11, 2022. All data from the San Francisco Association of REALTORS® MLS. Report © 2022 ShowingTime. | 13 35 59 30 54 27 39 Single Family Condo/TIC/Coop November 20 40 60 80 100 1-2005 1-2006 1-2007 1-2008 1-2009 1-2010 1-2011 1-2012 1-2013 1-2014 1-2015 1-2016 1-2017 1-2018 1-2019 1-2020 1-2021 1-2022 Single Family Condo/TIC/Coop 2020 2021 2022 - 27.8% - 8.5% - 10.0% - 14.3% 2020 2021 2022 + 2.9% + 13.5% 36 57 31 56 22 37 Single Family Condo/TIC/Coop Year to Date 2020 2021 2022 - 33.9% - 1.8% - 29.0% - 13.9% 2020 2021 2022 + 9.1% + 11.8%
  • 14. Months Supply of Inventory Months Supply of Inventory Single Family Year-Over-Year Change Condo/TIC/ Coop Year-Over-Year Change Dec-2021 0.8 -57.9% 1.8 -62.5% Jan-2022 1.1 -42.1% 2.3 -54.0% Feb-2022 1.2 -29.4% 2.7 -42.6% Mar-2022 1.3 -18.8% 2.9 -27.5% Apr-2022 1.4 -12.5% 3.2 -8.6% May-2022 1.4 -12.5% 3.3 +6.5% Jun-2022 1.6 0.0% 3.4 +13.3% Jul-2022 1.6 0.0% 3.2 +10.3% Aug-2022 1.6 0.0% 2.9 +3.6% Sep-2022 2.3 +27.8% 3.7 +5.7% Oct-2022 2.2 +15.8% 3.8 +8.6% Nov-2022 1.7 +21.4% 3.1 +6.9% 12-Month Avg* 1.5 -10.2% 3.0 -16.9% Historical Months Supply of Inventory by Month The inventory of homes for sale at the end of a given month, divided by the average monthly pending sales from the last 12 months. * Months Supply for all properties from December 2021 through November 2022. This is not the average of the individual figures above. Current as of December 11, 2022. All data from the San Francisco Association of REALTORS® MLS. Report © 2022 ShowingTime. | 14 3.1 8.1 1.4 2.9 1.7 3.1 Single Family Condo/TIC/Coop November 0.0 2.0 4.0 6.0 8.0 10.0 12.0 1-2005 1-2006 1-2007 1-2008 1-2009 1-2010 1-2011 1-2012 1-2013 1-2014 1-2015 1-2016 1-2017 1-2018 1-2019 1-2020 1-2021 1-2022 Single Family Condo/TIC/Coop 2020 2021 2022 + 6.9% - 64.2% + 21.4% - 54.8% 2020 2021 2022 + 40.9% + 153.1%
  • 15. All Properties Activity Overview Key metrics by report month and for year-to-date (YTD) starting from the first of the year. Key Metrics Historical Sparkbars 11-2021 11-2022 Percent Change YTD 2021 YTD 2022 Percent Change Current as of December 11, 2022. All data from the San Francisco Association of REALTORS® MLS. Report © 2022 ShowingTime. | 15 Months Supply 2.3 2.5 + 8.7% -- -- -- Affordability Ratio 37 28 - 24.3% % of List Price Received 108.8% 102.0% - 6.3% 108.2% 39 61.6% + 0.5% + 0.4% 26 - 33.3% 108.6% % of Properties Sold Over List Price 65.7% 43.9% - 33.2% 61.3% Active Listings 1,506 1,200 - 20.3% -- Avg. Sales Price $1,871,179 $1,635,051 - 12.6% $1,756,686 Days on Market 33 44 + 33.3% 37 $1,450,000 + 1.4% - 0.6% 35 - 5.4% $1,745,834 -- -- Sold Listings 723 392 - 45.8% 7,100 5,312 - 25.2% Median Sales Price $1,505,000 $1,329,000 - 11.7% $1,430,000 - 10.2% Pending Sales 624 369 - 40.9% 7,238 5,344 - 26.2% New Listings 444 311 - 30.0% 9,013 8,090 11-2019 11-2020 11-2021 11-2022 11-2019 11-2020 11-2021 11-2022 11-2019 11-2020 11-2021 11-2022 11-2019 11-2020 11-2021 11-2022 11-2019 11-2020 11-2021 11-2022 11-2019 11-2020 11-2021 11-2022 11-2019 11-2020 11-2021 11-2022 11-2019 11-2020 11-2021 11-2022 11-2019 11-2020 11-2021 11-2022 11-2019 11-2020 11-2021 11-2022 11-2019 11-2020 11-2021 11-2022
  • 16. Activity by District SF District 1: Northwest (Sea Cliff, Lake, Jordan Park / Laurel Heights, Outer Richmond, Central Richmond, Inner Richmond, Lone Mountain) SF District 2: Central West (Outer Sunset, Central Sunset, Inner Sunset, Outer Parkside, Parkside, Inner Parkside, Golden Gate Heights) SF District 3: Southwest (Pine Lake Park, Lake Shore, Merced Manor, Stonestown, Lakeside, Merced Heights, Ingleside, Ingleside Heights, Oceanview) SF District 4: Twin Peaks W (Forest Hill (& Ext), W Portal, St Francis Wd, Balboa Terr, Mt Dav Manor, Ingleside Terr, Monterey Hts, Wstwd Pk & H'lnds, Shrwd Fst, Miraloma Pk, Dmnd Hts, Mdtwn Terr) SF District 5: Central (Haight Ashbury, Cole Vly / Prnssus Hts, Clarndn Hts, Corona Hts, Twin Pks, Glen Pk, Noe Vly, Eureka Vly / Dolores Hts, Mission Dolores, Duboce Trngl, Buena Vista / Ashbury Hts) SF District 6: Central North (Lower Pacific Heights, Anza Vista, Western Addition, North Panhandle, Alamo Square, Hayes Valley) SF District 7: North (Marina, Cow Hollow, Presidio Heights, Pacific Heights) SF District 8: Northeast (North Waterfront, North Beach, Russian Hill, Telegraph Hill, Nob Hill, Financial District / Barbary Coast, Downtown, Van Ness / Civic Center, Tenderloin) SF District 9: Central East (Yerba Buena, South Beach, South of Market, Mission Bay, Inner Mission, Potrero Hill, Central Waterfront / Dogpatch, Bernal Heights) SF District 10: Southeast (Outer Mission, Mission Terr, Excelsior, Portola, Bayview, Silver Terr, Hunters Pt, Candlestick Pt, Bayview Hts, Little Hollywood, Visitation Vly, Crocker Amazon) 11-2021 11-2022 + / – 11-2021 11-2022 + / – 11-2021 11-2022 + / – 11-2021 11-2022 + / – 11-2021 11-2022 + / – Single Family 1 SF District 1 23 32 +39.1% 36 19 -47.2% $3,025,000 $1,800,000 -40.5% 19 29 +52.6% 1.1 1.9 +72.7% 2 SF District 2 41 40 -2.4% 38 31 -18.4% $1,714,750 $1,450,000 -15.4% 17 21 +23.5% 0.9 1.0 +11.1% 3 SF District 3 25 22 -12.0% 18 11 -38.9% $1,552,500 $1,190,000 -23.3% 17 36 +111.8% 1.5 1.6 +6.7% 4 SF District 4 31 41 +32.3% 41 28 -31.7% $2,015,000 $1,785,000 -11.4% 20 28 +40.0% 0.8 1.5 +87.5% 5 SF District 5 47 44 -6.4% 47 24 -48.9% $2,750,000 $2,510,000 -8.7% 22 28 +27.3% 1.2 1.5 +25.0% 6 SF District 6 14 6 -57.1% 8 0 -100.0% $2,647,500 $0 -100.0% 10 0 -100.0% 2.9 1.7 -41.4% 7 SF District 7 45 34 -24.4% 18 6 -66.7% $4,762,500 $4,447,000 -6.6% 41 119 +190.2% 3.3 4.0 +21.2% 8 SF District 8 23 15 -34.8% 0 0 -- $0 $0 -- 0 0 -- 8.5 5.0 -41.2% 9 SF District 9 55 43 -21.8% 33 20 -39.4% $1,850,000 $1,544,250 -16.5% 21 30 +42.9% 1.9 2.0 +5.3% 10 SF District 10 60 74 +23.3% 54 46 -14.8% $1,174,500 $1,077,500 -8.3% 20 44 +120.0% 1.3 1.9 +46.2% Condo/TIC/Coop 1 SF District 1 28 16 -42.9% 21 15 -28.6% $1,350,000 $1,355,000 +0.4% 30 37 +23.3% 1.5 1.1 -26.7% 2 SF District 2 14 16 +14.3% 5 3 -40.0% $760,000 $725,000 -4.6% 67 31 -53.7% 2.4 4.8 +100.0% 3 SF District 3 8 10 +25.0% 8 2 -75.0% $780,000 $798,500 +2.4% 35 63 +80.0% 1.9 3.2 +68.4% 4 SF District 4 15 10 -33.3% 5 3 -40.0% $780,000 $599,000 -23.2% 28 50 +78.6% 3.1 2.1 -32.3% 5 SF District 5 82 85 +3.7% 63 42 -33.3% $1,525,000 $1,399,000 -8.3% 28 31 +10.7% 1.4 1.8 +28.6% 6 SF District 6 95 57 -40.0% 48 33 -31.3% $1,138,500 $1,150,000 +1.0% 38 48 +26.3% 2.3 1.8 -21.7% 7 SF District 7 83 61 -26.5% 53 22 -58.5% $1,850,000 $1,689,584 -8.7% 36 52 +44.4% 2.0 2.3 +15.0% 8 SF District 8 242 172 -28.9% 73 31 -57.5% $1,270,000 $960,000 -24.4% 40 54 +35.0% 3.8 3.8 0.0% 9 SF District 9 482 372 -22.8% 137 49 -64.2% $1,100,000 $1,012,500 -8.0% 50 68 +36.0% 3.7 4.3 +16.2% 10 SF District 10 44 25 -43.2% 12 3 -75.0% $628,000 $549,000 -12.6% 73 124 +69.9% 5.1 3.6 -29.4% Key metrics by report month for the districts of San Francisco. Current as of December 11, 2022. All data from the San Francisco Association of REALTORS® MLS. Report © 2022 ShowingTime. | 16 Active Listings Sold Listings Median Sales Price Days on Market Months Supply