SlideShare ist ein Scribd-Unternehmen logo
1 von 16
Downloaden Sie, um offline zu lesen
May 2022 Monthly Snapshot
One-Year Change in One-Year Change in
Median Sales Price Single
Family
Median Sales Price
Condo/TIC/Coop
2
3
4
5
6
7
8
9
10
11
12
13
14
15
16
Monthly Indicators
+ 6.8% - 0.2% + 6.7%
One-Year Change in
After two years of record-setting activity, there are signs the housing market
might be cooling. High home prices and a surge in mortgage interest rates are
slowing buyer activity, with home sales declining for the third consecutive
month under the weight of soaring homeownership costs. The National
Association of REALTORS® (NAR) reports existing home sales were down
2.4% from the previous month, while pending sales fell 3.9% as of last
measure, extending the trend of recent months. Economists predict sales will
continue to soften in the near future, which may put downward pressure on
home prices.
New Listings were down 24.8 percent for single family homes and 30.4 percent
for Condo/TIC/Coop properties. Pending Sales decreased 22.5 percent for
single family homes and 29.3 percent for Condo/TIC/Coop properties.
The Median Sales Price was up 6.8 percent to $2,015,000 for single family
homes but decreased 0.2 percent to $1,225,000 for Condo/TIC/Coop
properties. Months Supply of Inventory decreased 32.0 percent for single family
units and 15.9 percent for Condo/TIC/Coop units.
The slowdown in sales has provided a much-needed lift to housing supply, with
inventory up 10.8% from the previous month according to NAR, although
supply remains down 10.4% compared to this time last year, with only 2.2
months’ supply of homes at the current sales pace. As the nation continues to
explore ways to solve the ongoing housing shortage, estimated at 5.5 million
homes, the Biden administration recently unveiled the Housing Supply Action
Plan, which aims to expand housing access through a number of administrative
and legislative actions and help relieve the nation’s housing crisis over the next
5 years.
Median Sales Price
All Property Types
Residential real estate activity in San Francisco County (Districts 1-10)
composed of single-family properties, townhomes and condominiums. Percent
changes are calculated using rounded figures.
Single Family Activity Overview
Months Supply of Inventory
For questions or more information, contact
communications@sfrealtors.com.
Current as of June 11, 2022. All data from the San Francisco Association of REALTORS® MLS. Report © 2022 ShowingTime.
Condo/TIC/Coop Activity Overview
Inventory of Active Listings
% of Properties Sold Over List Price
% of List Price Received
Housing Affordability Ratio
All Properties Activity Overview
New Listings
Pending Sales
Sold Listings
Median Sales Price
Average Sales Price
Days on Market Until Sale
Activity by District
Single Family Activity Overview
Key metrics by report month and for year-to-date (YTD) starting from the first of the year.
Key Metrics Historical Sparkbars 5-2021 5-2022 Percent Change YTD 2021 YTD 2022 Percent Change
Current as of June 11, 2022. All data from the San Francisco Association of REALTORS® MLS. Report © 2022 ShowingTime. | 2
Months Supply 2.5 1.7 - 32.0% -- -- --
Affordability Ratio 30 22 - 26.7%
% of List Price Received 116.8% 119.7% + 2.5% 112.3%
32
86.0% + 18.1%
+ 7.7%
23 - 28.1%
121.0%
% of Properties Sold Over List Price 79.7% 87.2% + 9.4% 72.8%
Active Listings 644 403 - 37.4% --
Avg. Sales Price $2,479,992 $2,415,763 - 2.6% $2,298,873
Days on Market 18 20 + 11.1% 24 19 - 20.8%
$2,416,607
-- --
Median Sales Price $1,886,500 $2,015,000 + 6.8% $1,755,000
Sold Listings 266 281 + 5.6% 1,149
New Listings 314 236 - 24.8% 1,579
Pending Sales 307 238 - 22.5% - 9.6%
1,277 1,155
- 12.1%
1,388
1,082 - 5.8%
$1,958,200 + 11.6%
+ 5.1%
5-2019 5-2020 5-2021 5-2022
5-2019 5-2020 5-2021 5-2022
5-2019 5-2020 5-2021 5-2022
5-2019 5-2020 5-2021 5-2022
5-2019 5-2020 5-2021 5-2022
5-2019 5-2020 5-2021 5-2022
5-2019 5-2020 5-2021 5-2022
5-2019 5-2020 5-2021 5-2022
5-2019 5-2020 5-2021 5-2022
5-2019 5-2020 5-2021 5-2022
5-2019 5-2020 5-2021 5-2022
Condo/TIC/Coop Activity Overview
Key metrics by report month and for year-to-date (YTD) starting from the first of the year.
Key Metrics Historical Sparkbars 5-2021 5-2022 Percent Change YTD 2021 YTD 2022 Percent Change
Current as of June 11, 2022. All data from the San Francisco Association of REALTORS® MLS. Report © 2022 ShowingTime. | 3
Months Supply 4.4 3.7 - 15.9% -- -- --
Affordability Ratio 54 42 - 22.2%
% of List Price Received 105.2% 105.9% + 0.7% 102.6%
55
56.3% + 34.7%
+ 3.1%
41 - 25.5%
105.8%
% of Properties Sold Over List Price 53.5% 55.1% + 3.0% 41.8%
Active Listings 1,503 1,238 - 17.6% --
Avg. Sales Price $1,379,360 $1,409,428 + 2.2% $1,340,387
Days on Market 36 36 0.0% 49
$1,250,000 + 4.4%
+ 5.2%
36 - 26.5%
$1,409,869
-- --
Sold Listings 443 362 - 18.3% 1,910 1,568 - 17.9%
Median Sales Price $1,227,000 $1,225,000 - 0.2% $1,196,750
- 9.2%
Pending Sales 461 326 - 29.3% 2,087 1,648 - 21.0%
New Listings 527 367 - 30.4% 2,699 2,451
5-2019 5-2020 5-2021 5-2022
5-2019 5-2020 5-2021 5-2022
5-2019 5-2020 5-2021 5-2022
5-2019 5-2020 5-2021 5-2022
5-2019 5-2020 5-2021 5-2022
5-2019 5-2020 5-2021 5-2022
5-2019 5-2020 5-2021 5-2022
5-2019 5-2020 5-2021 5-2022
5-2019 5-2020 5-2021 5-2022
5-2019 5-2020 5-2021 5-2022
5-2019 5-2020 5-2021 5-2022
New Listings
New Listings
Single
Family
Year-Over-Year
Change
Condo/TIC/
Coop
Year-Over-Year
Change
Jun-2021 324 -9.7% 495 -14.5%
Jul-2021 304 -25.5% 429 -38.6%
Aug-2021 302 -14.7% 438 -32.8%
Sep-2021 377 +6.2% 587 -11.9%
Oct-2021 273 -26.6% 462 -11.5%
Nov-2021 164 -32.0% 279 +9.4%
Dec-2021 108 -26.5% 219 -11.7%
Jan-2022 268 +3.9% 514 -3.9%
Feb-2022 291 -4.9% 524 +4.4%
Mar-2022 330 -4.9% 574 -7.4%
Apr-2022 263 -25.7% 472 -8.3%
May-2022 236 -24.8% 367 -30.4%
12-Month Avg 270 -15.1% 447 -15.2%
Historical New Listings by Month
Current as of June 11, 2022. All data from the San Francisco Association of REALTORS® MLS. Report © 2022 ShowingTime. | 4
A count of the properties that have been newly listed on the market in a given month.
275
505
314
527
236
367
Single Family Condo/TIC/Coop
May
0
200
400
600
800
1-2005 1-2006 1-2007 1-2008 1-2009 1-2010 1-2011 1-2012 1-2013 1-2014 1-2015 1-2016 1-2017 1-2018 1-2019 1-2020 1-2021 1-2022
Single Family Condo/TIC/Coop
1,156
1,778
1,579
2,699
1,388
2,451
Single Family Condo/TIC/Coop
Year to Date
2020 2021 2022
- 30.4%
+ 4.4%
- 24.8%
+ 14.2% + 51.8%
- 12.1%
+ 36.6% - 9.2%
2020 2021 2022 2020 2021 2022 2020 2021 2022
- 11.0% - 11.9% - 1.4%
+ 35.0%
Pending Sales
Pending Sales
Single
Family
Year-Over-Year
Change
Condo/TIC/
Coop
Year-Over-Year
Change
Jun-2021 275 +21.1% 388 +65.8%
Jul-2021 259 -6.2% 364 +50.4%
Aug-2021 226 -3.8% 316 -1.9%
Sep-2021 330 +17.4% 336 +9.8%
Oct-2021 273 -12.2% 403 +21.0%
Nov-2021 260 -15.3% 362 +20.7%
Dec-2021 129 -36.8% 226 -26.4%
Jan-2022 145 -14.7% 251 -14.0%
Feb-2022 216 -4.0% 293 -23.1%
Mar-2022 290 +0.3% 435 -8.2%
Apr-2022 266 -7.0% 343 -28.4%
May-2022 238 -22.5% 326 -29.3%
12-Month Avg 242 -6.8% 337 -2.1%
Historical Pending Sales by Month
A count of the properties on which offers have been accepted in a given month.
Current as of June 11, 2022. All data from the San Francisco Association of REALTORS® MLS. Report © 2022 ShowingTime. | 5
162
142
307
461
238
326
Single Family Condo/TIC/Coop
May
0
100
200
300
400
500
1-2005 1-2006 1-2007 1-2008 1-2009 1-2010 1-2011 1-2012 1-2013 1-2014 1-2015 1-2016 1-2017 1-2018 1-2019 1-2020 1-2021 1-2022
Single Family Condo/TIC/Coop
679
806
1,277
2,087
1,155
1,648
Single Family Condo/TIC/Coop
Year to Date
2020 2021 2022
- 29.3%
+ 224.6%
- 22.5%
+ 89.5% + 158.9%
- 9.6%
+ 88.1% - 21.0%
2020 2021 2022 2020 2021 2022 2020 2021 2022
- 40.7% - 33.2% - 38.1%
- 57.4%
Sold Listings
Sold Listings
Single
Family
Year-Over-Year
Change
Condo/TIC/
Coop
Year-Over-Year
Change
Jun-2021 325 +79.6% 471 +166.1%
Jul-2021 255 +7.1% 369 +38.7%
Aug-2021 256 +5.3% 348 +45.0%
Sep-2021 245 -4.7% 291 -9.9%
Oct-2021 310 +1.6% 362 +24.0%
Nov-2021 293 +3.2% 423 +24.0%
Dec-2021 216 -28.5% 325 -7.9%
Jan-2022 129 -19.9% 186 -31.1%
Feb-2022 159 -2.5% 250 -10.1%
Mar-2022 256 -5.2% 394 -13.8%
Apr-2022 257 -11.1% 376 -18.6%
May-2022 281 +5.6% 362 -18.3%
12-Month Avg 249 +0.8% 346 +6.5%
Historical Sold Listings by Month
A count of the actual sales that closed in a given month.
Current as of June 11, 2022. All data from the San Francisco Association of REALTORS® MLS. Report © 2022 ShowingTime. | 6
114 114
266
443
281
362
Single Family Condo/TIC/Coop
May
0
100
200
300
400
500
1-2005 1-2006 1-2007 1-2008 1-2009 1-2010 1-2011 1-2012 1-2013 1-2014 1-2015 1-2016 1-2017 1-2018 1-2019 1-2020 1-2021 1-2022
Single Family Condo/TIC/Coop
653
796
1,149
1,910
1,082
1,568
Single Family Condo/TIC/Coop
Year to Date
2020 2021 2022
- 18.3%
+ 288.6%
+ 5.6%
+ 133.3% + 139.9%
- 5.8%
+ 76.0% - 17.9%
2020 2021 2022 2020 2021 2022 2020 2021 2022
- 57.9% - 31.0% - 34.3%
- 65.8%
Median Sales Price
Median Sales Price
Single
Family
Year-Over-Year
Change
Condo/TIC/
Coop
Year-Over-Year
Change
Jun-2021 $1,950,000 +12.7% $1,250,000 +2.0%
Jul-2021 $1,850,000 +15.3% $1,210,000 -4.0%
Aug-2021 $1,847,500 +13.7% $1,150,000 -5.0%
Sep-2021 $1,750,000 +6.1% $1,200,000 +2.1%
Oct-2021 $1,805,000 +12.5% $1,242,500 +7.8%
Nov-2021 $1,880,000 +14.8% $1,260,000 +7.5%
Dec-2021 $1,690,000 +9.0% $1,300,000 +18.2%
Jan-2022 $1,630,000 +3.5% $1,070,000 -0.2%
Feb-2022 $1,930,000 +17.0% $1,227,500 +2.6%
Mar-2022 $2,030,000 +17.7% $1,206,750 -1.2%
Apr-2022 $2,050,000 +13.9% $1,362,500 +13.5%
May-2022 $2,015,000 +6.8% $1,225,000 -0.2%
12-Month Avg* $1,875,000 +11.9% $1,240,000 +4.2%
Historical Median Sales Price by Month
Point at which half of the sales sold for more and half sold for less, not accounting for seller concessions, in a given month.
* Median Sales Price for all properties from June 2021 through May 2022. This is not the average
of the individual figures above.
Current as of June 11, 2022. All data from the San Francisco Association of REALTORS® MLS. Report © 2022 ShowingTime. | 7
$1,587,500
$1,087,500
$1,886,500
$1,227,000
$2,015,000
$1,225,000
Single Family Condo/TIC/Coop
May
$500,000
$750,000
$1,000,000
$1,250,000
$1,500,000
$1,750,000
$2,000,000
$2,250,000
1-2005 1-2006 1-2007 1-2008 1-2009 1-2010 1-2011 1-2012 1-2013 1-2014 1-2015 1-2016 1-2017 1-2018 1-2019 1-2020 1-2021 1-2022
Single Family Condo/TIC/Coop
$1,575,000
$1,200,000
$1,755,000
$1,196,750
$1,958,200
$1,250,000
Single Family Condo/TIC/Coop
Year to Date
2020 2021 2022
- 0.2%
+ 12.8%
+ 6.8%
+ 18.8% - 0.3%
+ 11.6%
+ 11.4% + 4.4%
2020 2021 2022 2020 2021 2022 2020 2021 2022
- 2.0% + 1.6% + 0.8%
- 11.2%
Average Sales Price
Average Sales
Price
Single
Family
Year-Over-Year
Change
Condo/TIC/
Coop
Year-Over-Year
Change
Jun-2021 $2,504,876 +13.8% $1,388,929 -1.9%
Jul-2021 $2,292,230 +13.8% $1,357,053 -2.9%
Aug-2021 $2,128,296 +7.1% $1,425,053 +7.4%
Sep-2021 $2,165,489 +14.2% $1,330,272 +1.9%
Oct-2021 $2,359,157 +23.7% $1,456,361 +16.3%
Nov-2021 $2,352,770 +15.6% $1,539,719 +21.1%
Dec-2021 $2,365,749 +17.5% $1,488,734 +16.1%
Jan-2022 $1,977,367 +1.6% $1,311,263 +8.3%
Feb-2022 $2,417,245 +7.1% $1,398,389 +4.0%
Mar-2022 $2,538,817 +14.6% $1,411,860 +3.1%
Apr-2022 $2,515,877 +3.5% $1,464,618 +8.7%
May-2022 $2,415,763 -2.6% $1,409,428 +2.2%
12-Month Avg* $2,354,280 +11.3% $1,421,938 +7.2%
Historical Average Sales Price by Month
Average sales price for all closed sales, not accounting for seller concessions, in a given month.
* Avg. Sales Price for all properties from June 2021 through May 2022. This is not the average of
the individual figures above.
Current as of June 11, 2022. All data from the San Francisco Association of REALTORS® MLS. Report © 2022 ShowingTime. | 8
$1,877,767
$1,251,342
$2,479,992
$1,379,360
$2,415,763
$1,409,428
Single Family Condo/TIC/Coop
May
$500,000
$1,000,000
$1,500,000
$2,000,000
$2,500,000
$3,000,000
1-2005 1-2006 1-2007 1-2008 1-2009 1-2010 1-2011 1-2012 1-2013 1-2014 1-2015 1-2016 1-2017 1-2018 1-2019 1-2020 1-2021 1-2022
Single Family Condo/TIC/Coop
$2,023,122
$1,325,169
$2,298,873
$1,340,387
$2,416,607
$1,409,869
Single Family Condo/TIC/Coop
Year to Date
2020 2021 2022
+ 2.2%
+ 10.2%
- 2.6%
+ 32.1% + 1.1%
+ 5.1%
+ 13.6% + 5.2%
2020 2021 2022 2020 2021 2022 2020 2021 2022
- 9.1% + 1.1% + 0.6%
- 4.7%
Days on Market Until Sale
Days on Market
Until Sale
Single
Family
Year-Over-Year
Change
Condo/TIC/
Coop
Year-Over-Year
Change
Jun-2021 17 -34.6% 35 +2.9%
Jul-2021 18 -28.0% 40 +5.3%
Aug-2021 24 0.0% 40 0.0%
Sep-2021 22 -12.0% 37 -17.8%
Oct-2021 19 -29.6% 34 -17.1%
Nov-2021 20 -39.4% 40 -20.0%
Dec-2021 30 -14.3% 45 -27.4%
Jan-2022 37 +2.8% 62 -11.4%
Feb-2022 19 -36.7% 33 -46.8%
Mar-2022 15 -34.8% 32 -28.9%
Apr-2022 15 -21.1% 29 -35.6%
May-2022 20 +11.1% 36 0.0%
12-Month Avg* 20 -22.6% 38 -20.3%
Historical Days on Market Until Sale by Month
Average number of days between when a property is listed and when an offer is accepted in a given month.
* Days on Market for all properties from June 2021 through May 2022. This is not the average of
the individual figures above.
Current as of June 11, 2022. All data from the San Francisco Association of REALTORS® MLS. Report © 2022 ShowingTime. | 9
24
40
18
36
20
36
Single Family Condo/TIC/Coop
May
0
20
40
60
80
100
120
1-2005 1-2006 1-2007 1-2008 1-2009 1-2010 1-2011 1-2012 1-2013 1-2014 1-2015 1-2016 1-2017 1-2018 1-2019 1-2020 1-2021 1-2022
Single Family Condo/TIC/Coop
25
36
24
49
19
36
Single Family Condo/TIC/Coop
Year to Date
2020 2021 2022
0.0%
- 10.0%
+ 11.1%
- 25.0% + 36.1%
- 20.8%
- 4.0% - 26.5%
2020 2021 2022 2020 2021 2022 2020 2021 2022
+ 9.1% - 7.4% - 5.3%
+ 33.3%
Inventory of Active Listings
Inventory of Active
Listings
Single
Family
Year-Over-Year
Change
Condo/TIC/
Coop
Year-Over-Year
Change
Jun-2021 643 -17.9% 1,487 -5.2%
Jul-2021 651 -24.4% 1,460 -24.4%
Aug-2021 684 -26.1% 1,474 -30.1%
Sep-2021 682 -26.6% 1,618 -30.3%
Oct-2021 638 -31.2% 1,556 -33.9%
Nov-2021 507 -36.0% 1,359 -35.1%
Dec-2021 373 -36.3% 1,016 -32.5%
Jan-2022 472 -20.8% 1,215 -24.3%
Feb-2022 516 -18.1% 1,366 -14.4%
Mar-2022 517 -19.1% 1,387 -12.6%
Apr-2022 465 -31.0% 1,378 -9.6%
May-2022 403 -37.4% 1,238 -17.6%
12-Month Avg* 546 -27.1% 1,380 -23.7%
Historical Inventory of Active Listings by Month
The number of properties available for sale in active status at the end of a given month.
* Active Listings for all properties from June 2021 through May 2022. This is not the average of
the individual figures above.
Current as of June 11, 2022. All data from the San Francisco Association of REALTORS® MLS. Report © 2022 ShowingTime. | 10
688
1,343
644
1,503
403
1,238
Single Family Condo/TIC/Coop
May
0
500
1,000
1,500
2,000
2,500
1-2005 1-2006 1-2007 1-2008 1-2009 1-2010 1-2011 1-2012 1-2013 1-2014 1-2015 1-2016 1-2017 1-2018 1-2019 1-2020 1-2021 1-2022
Single Family Condo/TIC/Coop
2020 2021 2022
- 17.6%
+ 11.9%
- 37.4%
- 6.4%
2020 2021 2022
+ 32.8% + 61.8%
% of Properties Sold Over List Price
% of Properties
Sold Over List Price
Single
Family
Year-Over-Year
Change
Condo/TIC/
Coop
Year-Over-Year
Change
Jun-2021 82.5% +49.5% 54.4% +74.9%
Jul-2021 83.5% +29.1% 55.6% +25.2%
Aug-2021 84.4% +28.3% 54.6% +59.6%
Sep-2021 84.5% +30.0% 54.6% +58.7%
Oct-2021 84.5% +25.2% 61.0% +42.5%
Nov-2021 79.5% +29.1% 55.6% +69.5%
Dec-2021 78.7% +25.1% 46.5% +62.6%
Jan-2022 76.0% +31.5% 38.7% +76.7%
Feb-2022 86.8% +27.5% 58.4% +65.4%
Mar-2022 86.3% +16.5% 58.1% +35.4%
Apr-2022 88.7% +16.6% 63.0% +40.0%
May-2022 87.2% +9.4% 55.1% +3.0%
12-Month Avg 83.8% +24.7% 55.3% +43.8%
Historical % of Properties Sold Over List Price by Month
Percentage found when dividing the number of properties sold by properties sold over its original list price, not accounting for seller
concessions.
* % of Properties Sold Over List Price for all properties from June 2021 through May 2022. This is
not the average of the individual figures above.
Current as of June 11, 2022. All data from the San Francisco Association of REALTORS® MLS. Report © 2022 ShowingTime. | 11
63.2%
42.1%
79.7%
53.5%
87.2%
55.1%
Single Family Condo/TIC/Coop
May
0.0%
20.0%
40.0%
60.0%
80.0%
100.0%
1-2005 1-2006 1-2007 1-2008 1-2009 1-2010 1-2011 1-2012 1-2013 1-2014 1-2015 1-2016 1-2017 1-2018 1-2019 1-2020 1-2021 1-2022
Single Family Condo/TIC/Coop
70.5%
53.0%
72.8%
41.8%
86.0%
56.3%
Single Family Condo/TIC/Coop
Year to Date
2020 2021 2022
+ 3.0%
+ 27.1%
+ 9.4%
+ 26.1% - 21.1%
+ 18.1%
+ 3.3% + 34.7%
2020 2021 2022 2020 2021 2022 2020 2021 2022
- 21.4% - 4.9% - 4.5%
- 33.6%
% of List Price Received
% of List Price
Received
Single
Family
Year-Over-Year
Change
Condo/TIC/
Coop
Year-Over-Year
Change
Jun-2021 116.3% +10.1% 105.3% +5.4%
Jul-2021 118.5% +11.8% 104.8% +3.8%
Aug-2021 116.1% +8.0% 104.3% +3.9%
Sep-2021 116.3% +8.9% 105.0% +4.8%
Oct-2021 117.0% +8.2% 105.6% +4.2%
Nov-2021 114.9% +8.4% 104.6% +4.4%
Dec-2021 114.3% +7.8% 103.5% +4.2%
Jan-2022 117.7% +11.8% 101.1% +2.4%
Feb-2022 121.2% +10.5% 106.1% +5.4%
Mar-2022 122.0% +8.7% 106.4% +3.9%
Apr-2022 123.1% +8.2% 107.3% +3.5%
May-2022 119.7% +2.5% 105.9% +0.7%
12-Month Avg* 118.0% +8.4% 105.2% +3.7%
Historical % of List Price Received by Month
Percentage found when dividing a property’s sales price by its most recent list price, then taking the average for all properties sold in a given
month, not accounting for seller concessions.
* % of List Price Received for all properties from June 2021 through May 2022. This is not the
average of the individual figures above.
Current as of June 11, 2022. All data from the San Francisco Association of REALTORS® MLS. Report © 2022 ShowingTime. | 12
105.8%
100.4%
116.8%
105.2%
119.7%
105.9%
Single Family Condo/TIC/Coop
May
110.0%
103.3%
112.3%
102.6%
121.0%
105.8%
Single Family Condo/TIC/Coop
Year to Date
90.0%
100.0%
110.0%
120.0%
130.0%
1-2005 1-2006 1-2007 1-2008 1-2009 1-2010 1-2011 1-2012 1-2013 1-2014 1-2015 1-2016 1-2017 1-2018 1-2019 1-2020 1-2021 1-2022
Single Family Condo/TIC/Coop
2020 2021 2022
+ 0.7%
+ 4.8%
+ 2.5%
+ 10.4%
2020 2021 2022
- 6.4% - 6.0%
2020 2021 2022
+ 3.1%
- 0.7%
+ 7.7%
+ 2.1%
2020 2021 2022
- 1.1% - 1.4%
Housing Affordability Ratio
Housing
Affordability Ratio
Single
Family
Year-Over-Year
Change
Condo/TIC/
Coop
Year-Over-Year
Change
Jun-2021 28 -12.5% 52 -3.7%
Jul-2021 30 -14.3% 54 +1.9%
Aug-2021 30 -14.3% 57 +1.8%
Sep-2021 32 -8.6% 55 -3.5%
Oct-2021 31 -13.9% 53 -10.2%
Nov-2021 30 -14.3% 54 -8.5%
Dec-2021 32 -13.5% 49 -21.0%
Jan-2022 32 -11.1% 57 -9.5%
Feb-2022 27 -18.2% 49 -7.5%
Mar-2022 23 -28.1% 45 -13.5%
Apr-2022 21 -32.3% 37 -32.7%
May-2022 22 -26.7% 42 -22.2%
12-Month Avg* 28 -35.1% 50 -25.6%
Historical Housing Affordability Ratio by Month
This index measures housing affordability for the region. For example, an index of 120 means the median household income is 120% of what is
necessary to qualify for the median-priced home under prevailing interest rates. A higher number means greater affordability.
* Affordability Ratio for all properties from June 2021 through May 2022. This is not the average
of the individual figures above.
Current as of June 11, 2022. All data from the San Francisco Association of REALTORS® MLS. Report © 2022 ShowingTime. | 13
35
59
30
54
22
42
Single Family Condo/TIC/Coop
May
20
40
60
80
100
1-2005 1-2006 1-2007 1-2008 1-2009 1-2010 1-2011 1-2012 1-2013 1-2014 1-2015 1-2016 1-2017 1-2018 1-2019 1-2020 1-2021 1-2022
Single Family Condo/TIC/Coop
2020 2021 2022
- 22.2%
- 8.5%
- 26.7%
- 14.3%
2020 2021 2022
+ 12.9% + 22.9%
35
54
32
55
23
41
Single Family Condo/TIC/Coop
Year to Date
2020 2021 2022
- 25.5%
+ 1.9%
- 28.1%
- 8.6%
2020 2021 2022
+ 9.4% + 10.2%
Months Supply of Inventory
Months Supply of
Inventory
Single
Family
Year-Over-Year
Change
Condo/TIC/
Coop
Year-Over-Year
Change
Jun-2021 2.4 -45.5% 4.2 -46.2%
Jul-2021 2.5 -46.8% 4.0 -58.3%
Aug-2021 2.6 -46.9% 4.0 -60.0%
Sep-2021 2.6 -45.8% 4.4 -58.5%
Oct-2021 2.4 -48.9% 4.1 -61.7%
Nov-2021 2.0 -48.7% 3.6 -61.3%
Dec-2021 1.5 -46.4% 2.7 -57.1%
Jan-2022 1.9 -32.1% 3.3 -49.2%
Feb-2022 2.1 -27.6% 3.8 -37.7%
Mar-2022 2.1 -25.0% 3.9 -30.4%
Apr-2022 1.9 -29.6% 4.0 -16.7%
May-2022 1.7 -32.0% 3.7 -15.9%
12-Month Avg* 2.1 -41.8% 3.8 -50.4%
Historical Months Supply of Inventory by Month
The inventory of homes for sale at the end of a given month, divided by the average monthly pending sales from the last 12 months.
* Months Supply for all properties from June 2021 through May 2022. This is not the average of
the individual figures above.
Current as of June 11, 2022. All data from the San Francisco Association of REALTORS® MLS. Report © 2022 ShowingTime. | 14
3.9
6.7
2.5
4.4
1.7
3.7
Single Family Condo/TIC/Coop
May
0.0
2.0
4.0
6.0
8.0
10.0
12.0
1-2005 1-2006 1-2007 1-2008 1-2009 1-2010 1-2011 1-2012 1-2013 1-2014 1-2015 1-2016 1-2017 1-2018 1-2019 1-2020 1-2021 1-2022
Single Family Condo/TIC/Coop
2020 2021 2022
- 15.9%
- 34.3%
- 32.0%
- 35.9%
2020 2021 2022
+ 56.0% + 103.0%
All Properties Activity Overview
Key metrics by report month and for year-to-date (YTD) starting from the first of the year.
Key Metrics Historical Sparkbars 5-2021 5-2022 Percent Change YTD 2021 YTD 2022 Percent Change
Current as of June 11, 2022. All data from the San Francisco Association of REALTORS® MLS. Report © 2022 ShowingTime. | 15
Months Supply 3.6 2.9 - 19.4% -- -- --
Affordability Ratio 37 28 - 24.3%
% of List Price Received 109.5% 111.9% + 2.2% 106.2%
39
68.3% + 28.1%
+ 5.5%
28 - 28.2%
112.0%
% of Properties Sold Over List Price 63.1% 68.9% + 9.2% 53.3%
Active Listings 2,189 1,677 - 23.4% --
Avg. Sales Price $1,791,485 $1,845,206 + 3.0% $1,702,492
Days on Market 30 29 - 3.3% 40
$1,500,000 + 9.6%
+ 6.7%
29 - 27.5%
$1,816,920
-- --
Sold Listings 715 648 - 9.4% 3,096 2,676 - 13.6%
Median Sales Price $1,420,000 $1,515,111 + 6.7% $1,369,000
- 10.4%
Pending Sales 775 568 - 26.7% 3,399 2,828 - 16.8%
New Listings 852 614 - 27.9% 4,334 3,885
5-2019 5-2020 5-2021 5-2022
5-2019 5-2020 5-2021 5-2022
5-2019 5-2020 5-2021 5-2022
5-2019 5-2020 5-2021 5-2022
5-2019 5-2020 5-2021 5-2022
5-2019 5-2020 5-2021 5-2022
5-2019 5-2020 5-2021 5-2022
5-2019 5-2020 5-2021 5-2022
5-2019 5-2020 5-2021 5-2022
5-2019 5-2020 5-2021 5-2022
5-2019 5-2020 5-2021 5-2022
Activity by District
SF District 1: Northwest (Sea Cliff, Lake, Jordan Park / Laurel Heights, Outer Richmond, Central Ric After two
SF District 2: Central West (Outer Sunset, Central Sunset, Inner Sunset, Outer Parkside, Parkside, Inner Parkside, Golden Gate Heights)
SF District 3: Southwest (Pine Lake Park, Lake Shore, Merced Manor, Stonestown, Lakeside, Merced Heights, Ingleside, Ingleside Heights, Oceanview)
SF District 4: Twin Peaks W (Forest Hill (& Ext), W Portal, St Francis Wd, Balboa Terr, Mt Dav Manor, Ingleside Terr, Monterey Hts, Wstwd Pk & H'lnds, Shrwd Fst, Miraloma Pk, Dmnd Hts, Mdtwn Terr)
SF District 5: Central (Haight Ashbury, Cole Vly / Prnssus Hts, Clarndn Hts, Corona Hts, Twin Pks, Glen Pk, Noe Vly, Eureka Vly / Dolores Hts, Mission Dolores, Duboce Trngl, Buena Vista / Ashbury Hts)
SF District 6: Central North (Lower Pacific Heights, Anza Vista, Western Addition, North Panhandle, Alamo Square, Hayes Valley)
SF District 7: North (Marina, Cow Hollow, Presidio Heights, Pacific Heights)
SF District 8: Northeast (North Waterfront, North Beach, Russian Hill, Telegraph Hill, Nob Hill, Financial District / Barbary Coast, Downtown, Van Ness / Civic Center, Tenderloin)
SF District 9: Central East (Yerba Buena, South Beach, South of Market, Mission Bay, Inner Mission, Potrero Hill, Central Waterfront / Dogpatch, Bernal Heights)
SF District 10: Southeast (Outer Mission, Mission Terr, Excelsior, Portola, Bayview, Silver Terr, Hunters Pt, Candlestick Pt, Bayview Hts, Little Hollywood, Visitation Vly, Crocker Amazon)
5-2021 5-2022 + / – 5-2021 5-2022 + / – 5-2021 5-2022 + / – 5-2021 5-2022 + / – 5-2021 5-2022 + / –
Single Family
1 SF District 1 34 25 -26.5% 18 24 +33.3% $2,270,000 $2,962,763 +30.5% 10 13 +30.0% 1.7 1.1 -35.3%
2 SF District 2 83 58 -30.1% 38 60 +57.9% $1,800,000 $1,928,000 +7.1% 9 14 +55.6% 1.9 1.2 -36.8%
3 SF District 3 30 24 -20.0% 20 17 -15.0% $1,579,000 $1,350,000 -14.5% 16 21 +31.3% 1.8 1.5 -16.7%
4 SF District 4 62 42 -32.3% 45 32 -28.9% $2,056,000 $2,152,500 +4.7% 10 15 +50.0% 1.6 1.3 -18.8%
5 SF District 5 116 52 -55.2% 46 38 -17.4% $2,810,000 $2,725,000 -3.0% 22 18 -18.2% 2.8 1.5 -46.4%
6 SF District 6 18 7 -61.1% 4 8 +100.0% $3,655,000 $3,725,000 +1.9% 39 40 +2.6% 3.3 1.4 -57.6%
7 SF District 7 57 37 -35.1% 16 9 -43.8% $6,432,500 $5,600,000 -12.9% 21 80 +281.0% 4.8 3.3 -31.3%
8 SF District 8 27 23 -14.8% 2 3 +50.0% $5,206,106 $4,100,000 -21.2% 53 34 -35.8% 11.9 6.6 -44.5%
9 SF District 9 101 50 -50.5% 30 32 +6.7% $1,737,500 $2,287,500 +31.7% 34 21 -38.2% 3.2 1.9 -40.6%
10 SF District 10 116 85 -26.7% 47 58 +23.4% $1,238,000 $1,326,000 +7.1% 19 17 -10.5% 2.4 1.9 -20.8%
Condo/TIC/Coop
1 SF District 1 29 37 +27.6% 20 14 -30.0% $1,353,500 $1,497,500 +10.6% 21 13 -38.1% 1.5 2.2 +46.7%
2 SF District 2 19 13 -31.6% 3 4 +33.3% $1,000,000 $1,450,000 +45.0% 14 47 +235.7% 3.1 2.8 -9.7%
3 SF District 3 11 10 -9.1% 5 2 -60.0% $1,230,000 $776,500 -36.9% 55 37 -32.7% 2.8 2.7 -3.6%
4 SF District 4 15 16 +6.7% 7 7 0.0% $732,500 $850,000 +16.0% 38 24 -36.8% 2.8 2.9 +3.6%
5 SF District 5 159 114 -28.3% 72 65 -9.7% $1,570,000 $1,539,000 -2.0% 17 21 +23.5% 2.8 2.1 -25.0%
6 SF District 6 118 102 -13.6% 33 37 +12.1% $1,299,000 $1,225,000 -5.7% 27 36 +33.3% 2.9 2.8 -3.4%
7 SF District 7 138 89 -35.5% 54 47 -13.0% $1,600,000 $1,995,000 +24.7% 25 28 +12.0% 3.6 2.5 -30.6%
8 SF District 8 306 267 -12.7% 84 64 -23.8% $1,055,000 $1,170,000 +10.9% 52 43 -17.3% 5.7 4.5 -21.1%
9 SF District 9 662 545 -17.7% 155 115 -25.8% $1,025,000 $1,038,000 +1.3% 44 45 +2.3% 5.9 4.9 -16.9%
10 SF District 10 46 45 -2.2% 10 7 -30.0% $829,444 $815,000 -1.7% 24 55 +129.2% 5.8 6.3 +8.6%
Key metrics by report month for the districts of San Fransisco.
Current as of June 11, 2022. All data from the San Francisco Association of REALTORS® MLS. Report © 2022 ShowingTime. | 16
Active Listings Sold Listings Median Sales Price Days on Market Months Supply

Weitere ähnliche Inhalte

Ähnlich wie San Francisco Market Report May 2022.

San Francisco Market Report March 2022
San Francisco Market Report March 2022San Francisco Market Report March 2022
San Francisco Market Report March 2022Ronny Budiutama
 
San Francisco Market Report November 2022.pdf
San Francisco Market Report November 2022.pdfSan Francisco Market Report November 2022.pdf
San Francisco Market Report November 2022.pdfRonny Budiutama
 
San Francisco Market Report December 2021
San Francisco Market Report December 2021San Francisco Market Report December 2021
San Francisco Market Report December 2021Ronny Budiutama
 
San Francisco Market Report October 2022.pdf
San Francisco Market Report October 2022.pdfSan Francisco Market Report October 2022.pdf
San Francisco Market Report October 2022.pdfRonny Budiutama
 
San Francisco Market Report February 2023
San Francisco Market Report February 2023San Francisco Market Report February 2023
San Francisco Market Report February 2023Ronny Budiutama
 
San Francisco Market Report January 2023.pdf
San Francisco Market Report January 2023.pdfSan Francisco Market Report January 2023.pdf
San Francisco Market Report January 2023.pdfRonny Budiutama
 
San Francisco May 2023 Market Report.pdf
San Francisco May 2023 Market Report.pdfSan Francisco May 2023 Market Report.pdf
San Francisco May 2023 Market Report.pdfRonny Budiutama
 
San Francisco December 2023 Market Report
San Francisco December 2023 Market ReportSan Francisco December 2023 Market Report
San Francisco December 2023 Market ReportRonny Budiutama
 
San Francisco Market Report March 2023.pdf
San Francisco Market Report March 2023.pdfSan Francisco Market Report March 2023.pdf
San Francisco Market Report March 2023.pdfRonny Budiutama
 
San Francisco Market Report October 2021
San Francisco Market Report October 2021San Francisco Market Report October 2021
San Francisco Market Report October 2021Ronny Budiutama
 
San Francisco June 2023 Market Report.pdf
San Francisco June 2023 Market Report.pdfSan Francisco June 2023 Market Report.pdf
San Francisco June 2023 Market Report.pdfRonny Budiutama
 
San Francisco Market Report June 2021
San Francisco Market Report June 2021San Francisco Market Report June 2021
San Francisco Market Report June 2021Ronny Budiutama
 
October 2023 Report: San Francisco Real Estate Market Insights
October 2023 Report: San Francisco Real Estate Market InsightsOctober 2023 Report: San Francisco Real Estate Market Insights
October 2023 Report: San Francisco Real Estate Market InsightsRonny Budiutama
 
San Francisco Market Report February 2021
San Francisco Market Report February 2021San Francisco Market Report February 2021
San Francisco Market Report February 2021Ronny Budiutama
 
San Francisco Market Report November 2021
San Francisco Market Report November 2021San Francisco Market Report November 2021
San Francisco Market Report November 2021Ronny Budiutama
 
San Francisco Market Report September 2021
San Francisco Market Report September 2021San Francisco Market Report September 2021
San Francisco Market Report September 2021Ronny Budiutama
 
San Francisco market focus report December 2019
San Francisco market focus report December 2019San Francisco market focus report December 2019
San Francisco market focus report December 2019Ronny Budiutama
 
San Francisco November 2023 Market Report
San Francisco November 2023 Market ReportSan Francisco November 2023 Market Report
San Francisco November 2023 Market ReportRonny Budiutama
 
San Francisco Market Report May 2021
San Francisco Market Report May 2021San Francisco Market Report May 2021
San Francisco Market Report May 2021Ronny Budiutama
 
San Francisco January 2024 Market Report
San Francisco January 2024 Market ReportSan Francisco January 2024 Market Report
San Francisco January 2024 Market ReportRonny Budiutama
 

Ähnlich wie San Francisco Market Report May 2022. (20)

San Francisco Market Report March 2022
San Francisco Market Report March 2022San Francisco Market Report March 2022
San Francisco Market Report March 2022
 
San Francisco Market Report November 2022.pdf
San Francisco Market Report November 2022.pdfSan Francisco Market Report November 2022.pdf
San Francisco Market Report November 2022.pdf
 
San Francisco Market Report December 2021
San Francisco Market Report December 2021San Francisco Market Report December 2021
San Francisco Market Report December 2021
 
San Francisco Market Report October 2022.pdf
San Francisco Market Report October 2022.pdfSan Francisco Market Report October 2022.pdf
San Francisco Market Report October 2022.pdf
 
San Francisco Market Report February 2023
San Francisco Market Report February 2023San Francisco Market Report February 2023
San Francisco Market Report February 2023
 
San Francisco Market Report January 2023.pdf
San Francisco Market Report January 2023.pdfSan Francisco Market Report January 2023.pdf
San Francisco Market Report January 2023.pdf
 
San Francisco May 2023 Market Report.pdf
San Francisco May 2023 Market Report.pdfSan Francisco May 2023 Market Report.pdf
San Francisco May 2023 Market Report.pdf
 
San Francisco December 2023 Market Report
San Francisco December 2023 Market ReportSan Francisco December 2023 Market Report
San Francisco December 2023 Market Report
 
San Francisco Market Report March 2023.pdf
San Francisco Market Report March 2023.pdfSan Francisco Market Report March 2023.pdf
San Francisco Market Report March 2023.pdf
 
San Francisco Market Report October 2021
San Francisco Market Report October 2021San Francisco Market Report October 2021
San Francisco Market Report October 2021
 
San Francisco June 2023 Market Report.pdf
San Francisco June 2023 Market Report.pdfSan Francisco June 2023 Market Report.pdf
San Francisco June 2023 Market Report.pdf
 
San Francisco Market Report June 2021
San Francisco Market Report June 2021San Francisco Market Report June 2021
San Francisco Market Report June 2021
 
October 2023 Report: San Francisco Real Estate Market Insights
October 2023 Report: San Francisco Real Estate Market InsightsOctober 2023 Report: San Francisco Real Estate Market Insights
October 2023 Report: San Francisco Real Estate Market Insights
 
San Francisco Market Report February 2021
San Francisco Market Report February 2021San Francisco Market Report February 2021
San Francisco Market Report February 2021
 
San Francisco Market Report November 2021
San Francisco Market Report November 2021San Francisco Market Report November 2021
San Francisco Market Report November 2021
 
San Francisco Market Report September 2021
San Francisco Market Report September 2021San Francisco Market Report September 2021
San Francisco Market Report September 2021
 
San Francisco market focus report December 2019
San Francisco market focus report December 2019San Francisco market focus report December 2019
San Francisco market focus report December 2019
 
San Francisco November 2023 Market Report
San Francisco November 2023 Market ReportSan Francisco November 2023 Market Report
San Francisco November 2023 Market Report
 
San Francisco Market Report May 2021
San Francisco Market Report May 2021San Francisco Market Report May 2021
San Francisco Market Report May 2021
 
San Francisco January 2024 Market Report
San Francisco January 2024 Market ReportSan Francisco January 2024 Market Report
San Francisco January 2024 Market Report
 

Mehr von Ronny Budiutama

San Francisco Market Update -February 2024
San Francisco Market Update -February 2024San Francisco Market Update -February 2024
San Francisco Market Update -February 2024Ronny Budiutama
 
San Francisco Market Update - March 2024
San Francisco Market Update - March 2024San Francisco Market Update - March 2024
San Francisco Market Update - March 2024Ronny Budiutama
 
2023 Annual San Francisco Housing Market
2023 Annual San Francisco Housing Market2023 Annual San Francisco Housing Market
2023 Annual San Francisco Housing MarketRonny Budiutama
 
CA Weekly MLS Market Data Report - August 2023
CA Weekly MLS Market Data Report - August 2023CA Weekly MLS Market Data Report - August 2023
CA Weekly MLS Market Data Report - August 2023Ronny Budiutama
 
San Francisco Market Report July 2023.pdf
San Francisco Market Report July 2023.pdfSan Francisco Market Report July 2023.pdf
San Francisco Market Report July 2023.pdfRonny Budiutama
 
Annual Report on the San Francisco County Housing Market.pdf
Annual Report on the San Francisco County Housing Market.pdfAnnual Report on the San Francisco County Housing Market.pdf
Annual Report on the San Francisco County Housing Market.pdfRonny Budiutama
 

Mehr von Ronny Budiutama (6)

San Francisco Market Update -February 2024
San Francisco Market Update -February 2024San Francisco Market Update -February 2024
San Francisco Market Update -February 2024
 
San Francisco Market Update - March 2024
San Francisco Market Update - March 2024San Francisco Market Update - March 2024
San Francisco Market Update - March 2024
 
2023 Annual San Francisco Housing Market
2023 Annual San Francisco Housing Market2023 Annual San Francisco Housing Market
2023 Annual San Francisco Housing Market
 
CA Weekly MLS Market Data Report - August 2023
CA Weekly MLS Market Data Report - August 2023CA Weekly MLS Market Data Report - August 2023
CA Weekly MLS Market Data Report - August 2023
 
San Francisco Market Report July 2023.pdf
San Francisco Market Report July 2023.pdfSan Francisco Market Report July 2023.pdf
San Francisco Market Report July 2023.pdf
 
Annual Report on the San Francisco County Housing Market.pdf
Annual Report on the San Francisco County Housing Market.pdfAnnual Report on the San Francisco County Housing Market.pdf
Annual Report on the San Francisco County Housing Market.pdf
 

Kürzlich hochgeladen

Top tourism places in Dubai - Inch & Brick Realty
Top tourism places in Dubai - Inch & Brick RealtyTop tourism places in Dubai - Inch & Brick Realty
Top tourism places in Dubai - Inch & Brick Realtypunitranainchbrick02
 
Vanam At Purva Soukhyam Guduvanchery.pdf.pdf
Vanam At Purva Soukhyam Guduvanchery.pdf.pdfVanam At Purva Soukhyam Guduvanchery.pdf.pdf
Vanam At Purva Soukhyam Guduvanchery.pdf.pdfkratirudram
 
Madhugiri Boucher Managed Farmland (knx)
Madhugiri Boucher Managed Farmland (knx)Madhugiri Boucher Managed Farmland (knx)
Madhugiri Boucher Managed Farmland (knx)knoxdigital1
 
Cheap Rate ✨➥9711108085▻✨Call Girls In Connaught Place (Delhi)
Cheap Rate ✨➥9711108085▻✨Call Girls In Connaught Place (Delhi)Cheap Rate ✨➥9711108085▻✨Call Girls In Connaught Place (Delhi)
Cheap Rate ✨➥9711108085▻✨Call Girls In Connaught Place (Delhi)delhi24hrs1
 
Low Rate ✨➥9582086666▻✨Call Girls In Gurgaon Sector 21 (Gurgaon)
Low Rate ✨➥9582086666▻✨Call Girls In Gurgaon Sector 21 (Gurgaon)Low Rate ✨➥9582086666▻✨Call Girls In Gurgaon Sector 21 (Gurgaon)
Low Rate ✨➥9582086666▻✨Call Girls In Gurgaon Sector 21 (Gurgaon)delhi24hrs1
 
Call Girls in Maurice Nagar (Delhi) ꧁8447779280꧂ Female Escorts Service in De...
Call Girls in Maurice Nagar (Delhi) ꧁8447779280꧂ Female Escorts Service in De...Call Girls in Maurice Nagar (Delhi) ꧁8447779280꧂ Female Escorts Service in De...
Call Girls in Maurice Nagar (Delhi) ꧁8447779280꧂ Female Escorts Service in De...asmaqueen5
 
Jaipur Escorts 🥰 8617370543 Call Girls Offer VIP Hot Girls
Jaipur Escorts 🥰 8617370543 Call Girls Offer VIP Hot GirlsJaipur Escorts 🥰 8617370543 Call Girls Offer VIP Hot Girls
Jaipur Escorts 🥰 8617370543 Call Girls Offer VIP Hot GirlsDeepika Singh
 
Call Girls In Sarai Rohilla ☎️8447779280{Sarai Rohilla Escort Service In Delh...
Call Girls In Sarai Rohilla ☎️8447779280{Sarai Rohilla Escort Service In Delh...Call Girls In Sarai Rohilla ☎️8447779280{Sarai Rohilla Escort Service In Delh...
Call Girls In Sarai Rohilla ☎️8447779280{Sarai Rohilla Escort Service In Delh...asmaqueen5
 
Kohinoor Teiko Hinjewadi Phase 2 Pune E-Brochure.pdf
Kohinoor Teiko Hinjewadi Phase 2 Pune  E-Brochure.pdfKohinoor Teiko Hinjewadi Phase 2 Pune  E-Brochure.pdf
Kohinoor Teiko Hinjewadi Phase 2 Pune E-Brochure.pdfManishSaxena95
 
Housing Price Regulation Thesis Defense by Slidesgo.pptx
Housing Price Regulation Thesis Defense by Slidesgo.pptxHousing Price Regulation Thesis Defense by Slidesgo.pptx
Housing Price Regulation Thesis Defense by Slidesgo.pptxcosmo-soil
 
Real Estate Finance and Investments (2019).pdf
Real Estate Finance and Investments (2019).pdfReal Estate Finance and Investments (2019).pdf
Real Estate Finance and Investments (2019).pdfZahraYusuf9
 
SVN Live 5.6.24 Weekly Property Broadcast
SVN Live 5.6.24 Weekly Property BroadcastSVN Live 5.6.24 Weekly Property Broadcast
SVN Live 5.6.24 Weekly Property BroadcastSVN International Corp.
 
Explore Dual Citizenship in Africa | Citizenship Benefits & Requirements
Explore Dual Citizenship in Africa | Citizenship Benefits & RequirementsExplore Dual Citizenship in Africa | Citizenship Benefits & Requirements
Explore Dual Citizenship in Africa | Citizenship Benefits & Requirementsmarketingkingdomofku
 
Low Density Living New Project in BPTP THE AMAARIO Sector 37D Gurgaon Haryana...
Low Density Living New Project in BPTP THE AMAARIO Sector 37D Gurgaon Haryana...Low Density Living New Project in BPTP THE AMAARIO Sector 37D Gurgaon Haryana...
Low Density Living New Project in BPTP THE AMAARIO Sector 37D Gurgaon Haryana...ApartmentWala1
 
Kohinoor Courtyard One Wakad Pune | Elegant Living Spaces
Kohinoor Courtyard One Wakad Pune | Elegant Living SpacesKohinoor Courtyard One Wakad Pune | Elegant Living Spaces
Kohinoor Courtyard One Wakad Pune | Elegant Living Spacesaidasheikh47
 
Best Interior Design Services in Haldwani
Best Interior Design Services in HaldwaniBest Interior Design Services in Haldwani
Best Interior Design Services in HaldwaniGeomatrix
 
Retail Space for Lease - 1221 W. Main St., Sun Prairie, WI
Retail Space for Lease - 1221 W. Main St., Sun Prairie, WIRetail Space for Lease - 1221 W. Main St., Sun Prairie, WI
Retail Space for Lease - 1221 W. Main St., Sun Prairie, WILee & Associates of Madison, WI
 
Bridge & Elliot Ladner Floor Plans May 2024.pdf
Bridge & Elliot Ladner Floor Plans May 2024.pdfBridge & Elliot Ladner Floor Plans May 2024.pdf
Bridge & Elliot Ladner Floor Plans May 2024.pdfVickyAulakh1
 
Yashwin Enchante Uppar Kharadi Pune E-Brochue.pdf
Yashwin Enchante Uppar Kharadi Pune  E-Brochue.pdfYashwin Enchante Uppar Kharadi Pune  E-Brochue.pdf
Yashwin Enchante Uppar Kharadi Pune E-Brochue.pdfManishSaxena95
 
Rohan Harita Tathawade Pune Brochure.pdf
Rohan Harita Tathawade Pune Brochure.pdfRohan Harita Tathawade Pune Brochure.pdf
Rohan Harita Tathawade Pune Brochure.pdfabbu831446
 

Kürzlich hochgeladen (20)

Top tourism places in Dubai - Inch & Brick Realty
Top tourism places in Dubai - Inch & Brick RealtyTop tourism places in Dubai - Inch & Brick Realty
Top tourism places in Dubai - Inch & Brick Realty
 
Vanam At Purva Soukhyam Guduvanchery.pdf.pdf
Vanam At Purva Soukhyam Guduvanchery.pdf.pdfVanam At Purva Soukhyam Guduvanchery.pdf.pdf
Vanam At Purva Soukhyam Guduvanchery.pdf.pdf
 
Madhugiri Boucher Managed Farmland (knx)
Madhugiri Boucher Managed Farmland (knx)Madhugiri Boucher Managed Farmland (knx)
Madhugiri Boucher Managed Farmland (knx)
 
Cheap Rate ✨➥9711108085▻✨Call Girls In Connaught Place (Delhi)
Cheap Rate ✨➥9711108085▻✨Call Girls In Connaught Place (Delhi)Cheap Rate ✨➥9711108085▻✨Call Girls In Connaught Place (Delhi)
Cheap Rate ✨➥9711108085▻✨Call Girls In Connaught Place (Delhi)
 
Low Rate ✨➥9582086666▻✨Call Girls In Gurgaon Sector 21 (Gurgaon)
Low Rate ✨➥9582086666▻✨Call Girls In Gurgaon Sector 21 (Gurgaon)Low Rate ✨➥9582086666▻✨Call Girls In Gurgaon Sector 21 (Gurgaon)
Low Rate ✨➥9582086666▻✨Call Girls In Gurgaon Sector 21 (Gurgaon)
 
Call Girls in Maurice Nagar (Delhi) ꧁8447779280꧂ Female Escorts Service in De...
Call Girls in Maurice Nagar (Delhi) ꧁8447779280꧂ Female Escorts Service in De...Call Girls in Maurice Nagar (Delhi) ꧁8447779280꧂ Female Escorts Service in De...
Call Girls in Maurice Nagar (Delhi) ꧁8447779280꧂ Female Escorts Service in De...
 
Jaipur Escorts 🥰 8617370543 Call Girls Offer VIP Hot Girls
Jaipur Escorts 🥰 8617370543 Call Girls Offer VIP Hot GirlsJaipur Escorts 🥰 8617370543 Call Girls Offer VIP Hot Girls
Jaipur Escorts 🥰 8617370543 Call Girls Offer VIP Hot Girls
 
Call Girls In Sarai Rohilla ☎️8447779280{Sarai Rohilla Escort Service In Delh...
Call Girls In Sarai Rohilla ☎️8447779280{Sarai Rohilla Escort Service In Delh...Call Girls In Sarai Rohilla ☎️8447779280{Sarai Rohilla Escort Service In Delh...
Call Girls In Sarai Rohilla ☎️8447779280{Sarai Rohilla Escort Service In Delh...
 
Kohinoor Teiko Hinjewadi Phase 2 Pune E-Brochure.pdf
Kohinoor Teiko Hinjewadi Phase 2 Pune  E-Brochure.pdfKohinoor Teiko Hinjewadi Phase 2 Pune  E-Brochure.pdf
Kohinoor Teiko Hinjewadi Phase 2 Pune E-Brochure.pdf
 
Housing Price Regulation Thesis Defense by Slidesgo.pptx
Housing Price Regulation Thesis Defense by Slidesgo.pptxHousing Price Regulation Thesis Defense by Slidesgo.pptx
Housing Price Regulation Thesis Defense by Slidesgo.pptx
 
Real Estate Finance and Investments (2019).pdf
Real Estate Finance and Investments (2019).pdfReal Estate Finance and Investments (2019).pdf
Real Estate Finance and Investments (2019).pdf
 
SVN Live 5.6.24 Weekly Property Broadcast
SVN Live 5.6.24 Weekly Property BroadcastSVN Live 5.6.24 Weekly Property Broadcast
SVN Live 5.6.24 Weekly Property Broadcast
 
Explore Dual Citizenship in Africa | Citizenship Benefits & Requirements
Explore Dual Citizenship in Africa | Citizenship Benefits & RequirementsExplore Dual Citizenship in Africa | Citizenship Benefits & Requirements
Explore Dual Citizenship in Africa | Citizenship Benefits & Requirements
 
Low Density Living New Project in BPTP THE AMAARIO Sector 37D Gurgaon Haryana...
Low Density Living New Project in BPTP THE AMAARIO Sector 37D Gurgaon Haryana...Low Density Living New Project in BPTP THE AMAARIO Sector 37D Gurgaon Haryana...
Low Density Living New Project in BPTP THE AMAARIO Sector 37D Gurgaon Haryana...
 
Kohinoor Courtyard One Wakad Pune | Elegant Living Spaces
Kohinoor Courtyard One Wakad Pune | Elegant Living SpacesKohinoor Courtyard One Wakad Pune | Elegant Living Spaces
Kohinoor Courtyard One Wakad Pune | Elegant Living Spaces
 
Best Interior Design Services in Haldwani
Best Interior Design Services in HaldwaniBest Interior Design Services in Haldwani
Best Interior Design Services in Haldwani
 
Retail Space for Lease - 1221 W. Main St., Sun Prairie, WI
Retail Space for Lease - 1221 W. Main St., Sun Prairie, WIRetail Space for Lease - 1221 W. Main St., Sun Prairie, WI
Retail Space for Lease - 1221 W. Main St., Sun Prairie, WI
 
Bridge & Elliot Ladner Floor Plans May 2024.pdf
Bridge & Elliot Ladner Floor Plans May 2024.pdfBridge & Elliot Ladner Floor Plans May 2024.pdf
Bridge & Elliot Ladner Floor Plans May 2024.pdf
 
Yashwin Enchante Uppar Kharadi Pune E-Brochue.pdf
Yashwin Enchante Uppar Kharadi Pune  E-Brochue.pdfYashwin Enchante Uppar Kharadi Pune  E-Brochue.pdf
Yashwin Enchante Uppar Kharadi Pune E-Brochue.pdf
 
Rohan Harita Tathawade Pune Brochure.pdf
Rohan Harita Tathawade Pune Brochure.pdfRohan Harita Tathawade Pune Brochure.pdf
Rohan Harita Tathawade Pune Brochure.pdf
 

San Francisco Market Report May 2022.

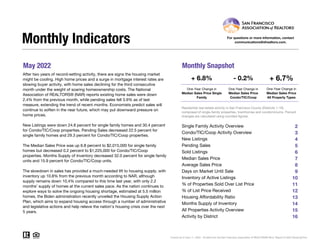
  • 1. May 2022 Monthly Snapshot One-Year Change in One-Year Change in Median Sales Price Single Family Median Sales Price Condo/TIC/Coop 2 3 4 5 6 7 8 9 10 11 12 13 14 15 16 Monthly Indicators + 6.8% - 0.2% + 6.7% One-Year Change in After two years of record-setting activity, there are signs the housing market might be cooling. High home prices and a surge in mortgage interest rates are slowing buyer activity, with home sales declining for the third consecutive month under the weight of soaring homeownership costs. The National Association of REALTORS® (NAR) reports existing home sales were down 2.4% from the previous month, while pending sales fell 3.9% as of last measure, extending the trend of recent months. Economists predict sales will continue to soften in the near future, which may put downward pressure on home prices. New Listings were down 24.8 percent for single family homes and 30.4 percent for Condo/TIC/Coop properties. Pending Sales decreased 22.5 percent for single family homes and 29.3 percent for Condo/TIC/Coop properties. The Median Sales Price was up 6.8 percent to $2,015,000 for single family homes but decreased 0.2 percent to $1,225,000 for Condo/TIC/Coop properties. Months Supply of Inventory decreased 32.0 percent for single family units and 15.9 percent for Condo/TIC/Coop units. The slowdown in sales has provided a much-needed lift to housing supply, with inventory up 10.8% from the previous month according to NAR, although supply remains down 10.4% compared to this time last year, with only 2.2 months’ supply of homes at the current sales pace. As the nation continues to explore ways to solve the ongoing housing shortage, estimated at 5.5 million homes, the Biden administration recently unveiled the Housing Supply Action Plan, which aims to expand housing access through a number of administrative and legislative actions and help relieve the nation’s housing crisis over the next 5 years. Median Sales Price All Property Types Residential real estate activity in San Francisco County (Districts 1-10) composed of single-family properties, townhomes and condominiums. Percent changes are calculated using rounded figures. Single Family Activity Overview Months Supply of Inventory For questions or more information, contact communications@sfrealtors.com. Current as of June 11, 2022. All data from the San Francisco Association of REALTORS® MLS. Report © 2022 ShowingTime. Condo/TIC/Coop Activity Overview Inventory of Active Listings % of Properties Sold Over List Price % of List Price Received Housing Affordability Ratio All Properties Activity Overview New Listings Pending Sales Sold Listings Median Sales Price Average Sales Price Days on Market Until Sale Activity by District
  • 2. Single Family Activity Overview Key metrics by report month and for year-to-date (YTD) starting from the first of the year. Key Metrics Historical Sparkbars 5-2021 5-2022 Percent Change YTD 2021 YTD 2022 Percent Change Current as of June 11, 2022. All data from the San Francisco Association of REALTORS® MLS. Report © 2022 ShowingTime. | 2 Months Supply 2.5 1.7 - 32.0% -- -- -- Affordability Ratio 30 22 - 26.7% % of List Price Received 116.8% 119.7% + 2.5% 112.3% 32 86.0% + 18.1% + 7.7% 23 - 28.1% 121.0% % of Properties Sold Over List Price 79.7% 87.2% + 9.4% 72.8% Active Listings 644 403 - 37.4% -- Avg. Sales Price $2,479,992 $2,415,763 - 2.6% $2,298,873 Days on Market 18 20 + 11.1% 24 19 - 20.8% $2,416,607 -- -- Median Sales Price $1,886,500 $2,015,000 + 6.8% $1,755,000 Sold Listings 266 281 + 5.6% 1,149 New Listings 314 236 - 24.8% 1,579 Pending Sales 307 238 - 22.5% - 9.6% 1,277 1,155 - 12.1% 1,388 1,082 - 5.8% $1,958,200 + 11.6% + 5.1% 5-2019 5-2020 5-2021 5-2022 5-2019 5-2020 5-2021 5-2022 5-2019 5-2020 5-2021 5-2022 5-2019 5-2020 5-2021 5-2022 5-2019 5-2020 5-2021 5-2022 5-2019 5-2020 5-2021 5-2022 5-2019 5-2020 5-2021 5-2022 5-2019 5-2020 5-2021 5-2022 5-2019 5-2020 5-2021 5-2022 5-2019 5-2020 5-2021 5-2022 5-2019 5-2020 5-2021 5-2022
  • 3. Condo/TIC/Coop Activity Overview Key metrics by report month and for year-to-date (YTD) starting from the first of the year. Key Metrics Historical Sparkbars 5-2021 5-2022 Percent Change YTD 2021 YTD 2022 Percent Change Current as of June 11, 2022. All data from the San Francisco Association of REALTORS® MLS. Report © 2022 ShowingTime. | 3 Months Supply 4.4 3.7 - 15.9% -- -- -- Affordability Ratio 54 42 - 22.2% % of List Price Received 105.2% 105.9% + 0.7% 102.6% 55 56.3% + 34.7% + 3.1% 41 - 25.5% 105.8% % of Properties Sold Over List Price 53.5% 55.1% + 3.0% 41.8% Active Listings 1,503 1,238 - 17.6% -- Avg. Sales Price $1,379,360 $1,409,428 + 2.2% $1,340,387 Days on Market 36 36 0.0% 49 $1,250,000 + 4.4% + 5.2% 36 - 26.5% $1,409,869 -- -- Sold Listings 443 362 - 18.3% 1,910 1,568 - 17.9% Median Sales Price $1,227,000 $1,225,000 - 0.2% $1,196,750 - 9.2% Pending Sales 461 326 - 29.3% 2,087 1,648 - 21.0% New Listings 527 367 - 30.4% 2,699 2,451 5-2019 5-2020 5-2021 5-2022 5-2019 5-2020 5-2021 5-2022 5-2019 5-2020 5-2021 5-2022 5-2019 5-2020 5-2021 5-2022 5-2019 5-2020 5-2021 5-2022 5-2019 5-2020 5-2021 5-2022 5-2019 5-2020 5-2021 5-2022 5-2019 5-2020 5-2021 5-2022 5-2019 5-2020 5-2021 5-2022 5-2019 5-2020 5-2021 5-2022 5-2019 5-2020 5-2021 5-2022
  • 4. New Listings New Listings Single Family Year-Over-Year Change Condo/TIC/ Coop Year-Over-Year Change Jun-2021 324 -9.7% 495 -14.5% Jul-2021 304 -25.5% 429 -38.6% Aug-2021 302 -14.7% 438 -32.8% Sep-2021 377 +6.2% 587 -11.9% Oct-2021 273 -26.6% 462 -11.5% Nov-2021 164 -32.0% 279 +9.4% Dec-2021 108 -26.5% 219 -11.7% Jan-2022 268 +3.9% 514 -3.9% Feb-2022 291 -4.9% 524 +4.4% Mar-2022 330 -4.9% 574 -7.4% Apr-2022 263 -25.7% 472 -8.3% May-2022 236 -24.8% 367 -30.4% 12-Month Avg 270 -15.1% 447 -15.2% Historical New Listings by Month Current as of June 11, 2022. All data from the San Francisco Association of REALTORS® MLS. Report © 2022 ShowingTime. | 4 A count of the properties that have been newly listed on the market in a given month. 275 505 314 527 236 367 Single Family Condo/TIC/Coop May 0 200 400 600 800 1-2005 1-2006 1-2007 1-2008 1-2009 1-2010 1-2011 1-2012 1-2013 1-2014 1-2015 1-2016 1-2017 1-2018 1-2019 1-2020 1-2021 1-2022 Single Family Condo/TIC/Coop 1,156 1,778 1,579 2,699 1,388 2,451 Single Family Condo/TIC/Coop Year to Date 2020 2021 2022 - 30.4% + 4.4% - 24.8% + 14.2% + 51.8% - 12.1% + 36.6% - 9.2% 2020 2021 2022 2020 2021 2022 2020 2021 2022 - 11.0% - 11.9% - 1.4% + 35.0%
  • 5. Pending Sales Pending Sales Single Family Year-Over-Year Change Condo/TIC/ Coop Year-Over-Year Change Jun-2021 275 +21.1% 388 +65.8% Jul-2021 259 -6.2% 364 +50.4% Aug-2021 226 -3.8% 316 -1.9% Sep-2021 330 +17.4% 336 +9.8% Oct-2021 273 -12.2% 403 +21.0% Nov-2021 260 -15.3% 362 +20.7% Dec-2021 129 -36.8% 226 -26.4% Jan-2022 145 -14.7% 251 -14.0% Feb-2022 216 -4.0% 293 -23.1% Mar-2022 290 +0.3% 435 -8.2% Apr-2022 266 -7.0% 343 -28.4% May-2022 238 -22.5% 326 -29.3% 12-Month Avg 242 -6.8% 337 -2.1% Historical Pending Sales by Month A count of the properties on which offers have been accepted in a given month. Current as of June 11, 2022. All data from the San Francisco Association of REALTORS® MLS. Report © 2022 ShowingTime. | 5 162 142 307 461 238 326 Single Family Condo/TIC/Coop May 0 100 200 300 400 500 1-2005 1-2006 1-2007 1-2008 1-2009 1-2010 1-2011 1-2012 1-2013 1-2014 1-2015 1-2016 1-2017 1-2018 1-2019 1-2020 1-2021 1-2022 Single Family Condo/TIC/Coop 679 806 1,277 2,087 1,155 1,648 Single Family Condo/TIC/Coop Year to Date 2020 2021 2022 - 29.3% + 224.6% - 22.5% + 89.5% + 158.9% - 9.6% + 88.1% - 21.0% 2020 2021 2022 2020 2021 2022 2020 2021 2022 - 40.7% - 33.2% - 38.1% - 57.4%
  • 6. Sold Listings Sold Listings Single Family Year-Over-Year Change Condo/TIC/ Coop Year-Over-Year Change Jun-2021 325 +79.6% 471 +166.1% Jul-2021 255 +7.1% 369 +38.7% Aug-2021 256 +5.3% 348 +45.0% Sep-2021 245 -4.7% 291 -9.9% Oct-2021 310 +1.6% 362 +24.0% Nov-2021 293 +3.2% 423 +24.0% Dec-2021 216 -28.5% 325 -7.9% Jan-2022 129 -19.9% 186 -31.1% Feb-2022 159 -2.5% 250 -10.1% Mar-2022 256 -5.2% 394 -13.8% Apr-2022 257 -11.1% 376 -18.6% May-2022 281 +5.6% 362 -18.3% 12-Month Avg 249 +0.8% 346 +6.5% Historical Sold Listings by Month A count of the actual sales that closed in a given month. Current as of June 11, 2022. All data from the San Francisco Association of REALTORS® MLS. Report © 2022 ShowingTime. | 6 114 114 266 443 281 362 Single Family Condo/TIC/Coop May 0 100 200 300 400 500 1-2005 1-2006 1-2007 1-2008 1-2009 1-2010 1-2011 1-2012 1-2013 1-2014 1-2015 1-2016 1-2017 1-2018 1-2019 1-2020 1-2021 1-2022 Single Family Condo/TIC/Coop 653 796 1,149 1,910 1,082 1,568 Single Family Condo/TIC/Coop Year to Date 2020 2021 2022 - 18.3% + 288.6% + 5.6% + 133.3% + 139.9% - 5.8% + 76.0% - 17.9% 2020 2021 2022 2020 2021 2022 2020 2021 2022 - 57.9% - 31.0% - 34.3% - 65.8%
  • 7. Median Sales Price Median Sales Price Single Family Year-Over-Year Change Condo/TIC/ Coop Year-Over-Year Change Jun-2021 $1,950,000 +12.7% $1,250,000 +2.0% Jul-2021 $1,850,000 +15.3% $1,210,000 -4.0% Aug-2021 $1,847,500 +13.7% $1,150,000 -5.0% Sep-2021 $1,750,000 +6.1% $1,200,000 +2.1% Oct-2021 $1,805,000 +12.5% $1,242,500 +7.8% Nov-2021 $1,880,000 +14.8% $1,260,000 +7.5% Dec-2021 $1,690,000 +9.0% $1,300,000 +18.2% Jan-2022 $1,630,000 +3.5% $1,070,000 -0.2% Feb-2022 $1,930,000 +17.0% $1,227,500 +2.6% Mar-2022 $2,030,000 +17.7% $1,206,750 -1.2% Apr-2022 $2,050,000 +13.9% $1,362,500 +13.5% May-2022 $2,015,000 +6.8% $1,225,000 -0.2% 12-Month Avg* $1,875,000 +11.9% $1,240,000 +4.2% Historical Median Sales Price by Month Point at which half of the sales sold for more and half sold for less, not accounting for seller concessions, in a given month. * Median Sales Price for all properties from June 2021 through May 2022. This is not the average of the individual figures above. Current as of June 11, 2022. All data from the San Francisco Association of REALTORS® MLS. Report © 2022 ShowingTime. | 7 $1,587,500 $1,087,500 $1,886,500 $1,227,000 $2,015,000 $1,225,000 Single Family Condo/TIC/Coop May $500,000 $750,000 $1,000,000 $1,250,000 $1,500,000 $1,750,000 $2,000,000 $2,250,000 1-2005 1-2006 1-2007 1-2008 1-2009 1-2010 1-2011 1-2012 1-2013 1-2014 1-2015 1-2016 1-2017 1-2018 1-2019 1-2020 1-2021 1-2022 Single Family Condo/TIC/Coop $1,575,000 $1,200,000 $1,755,000 $1,196,750 $1,958,200 $1,250,000 Single Family Condo/TIC/Coop Year to Date 2020 2021 2022 - 0.2% + 12.8% + 6.8% + 18.8% - 0.3% + 11.6% + 11.4% + 4.4% 2020 2021 2022 2020 2021 2022 2020 2021 2022 - 2.0% + 1.6% + 0.8% - 11.2%
  • 8. Average Sales Price Average Sales Price Single Family Year-Over-Year Change Condo/TIC/ Coop Year-Over-Year Change Jun-2021 $2,504,876 +13.8% $1,388,929 -1.9% Jul-2021 $2,292,230 +13.8% $1,357,053 -2.9% Aug-2021 $2,128,296 +7.1% $1,425,053 +7.4% Sep-2021 $2,165,489 +14.2% $1,330,272 +1.9% Oct-2021 $2,359,157 +23.7% $1,456,361 +16.3% Nov-2021 $2,352,770 +15.6% $1,539,719 +21.1% Dec-2021 $2,365,749 +17.5% $1,488,734 +16.1% Jan-2022 $1,977,367 +1.6% $1,311,263 +8.3% Feb-2022 $2,417,245 +7.1% $1,398,389 +4.0% Mar-2022 $2,538,817 +14.6% $1,411,860 +3.1% Apr-2022 $2,515,877 +3.5% $1,464,618 +8.7% May-2022 $2,415,763 -2.6% $1,409,428 +2.2% 12-Month Avg* $2,354,280 +11.3% $1,421,938 +7.2% Historical Average Sales Price by Month Average sales price for all closed sales, not accounting for seller concessions, in a given month. * Avg. Sales Price for all properties from June 2021 through May 2022. This is not the average of the individual figures above. Current as of June 11, 2022. All data from the San Francisco Association of REALTORS® MLS. Report © 2022 ShowingTime. | 8 $1,877,767 $1,251,342 $2,479,992 $1,379,360 $2,415,763 $1,409,428 Single Family Condo/TIC/Coop May $500,000 $1,000,000 $1,500,000 $2,000,000 $2,500,000 $3,000,000 1-2005 1-2006 1-2007 1-2008 1-2009 1-2010 1-2011 1-2012 1-2013 1-2014 1-2015 1-2016 1-2017 1-2018 1-2019 1-2020 1-2021 1-2022 Single Family Condo/TIC/Coop $2,023,122 $1,325,169 $2,298,873 $1,340,387 $2,416,607 $1,409,869 Single Family Condo/TIC/Coop Year to Date 2020 2021 2022 + 2.2% + 10.2% - 2.6% + 32.1% + 1.1% + 5.1% + 13.6% + 5.2% 2020 2021 2022 2020 2021 2022 2020 2021 2022 - 9.1% + 1.1% + 0.6% - 4.7%
  • 9. Days on Market Until Sale Days on Market Until Sale Single Family Year-Over-Year Change Condo/TIC/ Coop Year-Over-Year Change Jun-2021 17 -34.6% 35 +2.9% Jul-2021 18 -28.0% 40 +5.3% Aug-2021 24 0.0% 40 0.0% Sep-2021 22 -12.0% 37 -17.8% Oct-2021 19 -29.6% 34 -17.1% Nov-2021 20 -39.4% 40 -20.0% Dec-2021 30 -14.3% 45 -27.4% Jan-2022 37 +2.8% 62 -11.4% Feb-2022 19 -36.7% 33 -46.8% Mar-2022 15 -34.8% 32 -28.9% Apr-2022 15 -21.1% 29 -35.6% May-2022 20 +11.1% 36 0.0% 12-Month Avg* 20 -22.6% 38 -20.3% Historical Days on Market Until Sale by Month Average number of days between when a property is listed and when an offer is accepted in a given month. * Days on Market for all properties from June 2021 through May 2022. This is not the average of the individual figures above. Current as of June 11, 2022. All data from the San Francisco Association of REALTORS® MLS. Report © 2022 ShowingTime. | 9 24 40 18 36 20 36 Single Family Condo/TIC/Coop May 0 20 40 60 80 100 120 1-2005 1-2006 1-2007 1-2008 1-2009 1-2010 1-2011 1-2012 1-2013 1-2014 1-2015 1-2016 1-2017 1-2018 1-2019 1-2020 1-2021 1-2022 Single Family Condo/TIC/Coop 25 36 24 49 19 36 Single Family Condo/TIC/Coop Year to Date 2020 2021 2022 0.0% - 10.0% + 11.1% - 25.0% + 36.1% - 20.8% - 4.0% - 26.5% 2020 2021 2022 2020 2021 2022 2020 2021 2022 + 9.1% - 7.4% - 5.3% + 33.3%
  • 10. Inventory of Active Listings Inventory of Active Listings Single Family Year-Over-Year Change Condo/TIC/ Coop Year-Over-Year Change Jun-2021 643 -17.9% 1,487 -5.2% Jul-2021 651 -24.4% 1,460 -24.4% Aug-2021 684 -26.1% 1,474 -30.1% Sep-2021 682 -26.6% 1,618 -30.3% Oct-2021 638 -31.2% 1,556 -33.9% Nov-2021 507 -36.0% 1,359 -35.1% Dec-2021 373 -36.3% 1,016 -32.5% Jan-2022 472 -20.8% 1,215 -24.3% Feb-2022 516 -18.1% 1,366 -14.4% Mar-2022 517 -19.1% 1,387 -12.6% Apr-2022 465 -31.0% 1,378 -9.6% May-2022 403 -37.4% 1,238 -17.6% 12-Month Avg* 546 -27.1% 1,380 -23.7% Historical Inventory of Active Listings by Month The number of properties available for sale in active status at the end of a given month. * Active Listings for all properties from June 2021 through May 2022. This is not the average of the individual figures above. Current as of June 11, 2022. All data from the San Francisco Association of REALTORS® MLS. Report © 2022 ShowingTime. | 10 688 1,343 644 1,503 403 1,238 Single Family Condo/TIC/Coop May 0 500 1,000 1,500 2,000 2,500 1-2005 1-2006 1-2007 1-2008 1-2009 1-2010 1-2011 1-2012 1-2013 1-2014 1-2015 1-2016 1-2017 1-2018 1-2019 1-2020 1-2021 1-2022 Single Family Condo/TIC/Coop 2020 2021 2022 - 17.6% + 11.9% - 37.4% - 6.4% 2020 2021 2022 + 32.8% + 61.8%
  • 11. % of Properties Sold Over List Price % of Properties Sold Over List Price Single Family Year-Over-Year Change Condo/TIC/ Coop Year-Over-Year Change Jun-2021 82.5% +49.5% 54.4% +74.9% Jul-2021 83.5% +29.1% 55.6% +25.2% Aug-2021 84.4% +28.3% 54.6% +59.6% Sep-2021 84.5% +30.0% 54.6% +58.7% Oct-2021 84.5% +25.2% 61.0% +42.5% Nov-2021 79.5% +29.1% 55.6% +69.5% Dec-2021 78.7% +25.1% 46.5% +62.6% Jan-2022 76.0% +31.5% 38.7% +76.7% Feb-2022 86.8% +27.5% 58.4% +65.4% Mar-2022 86.3% +16.5% 58.1% +35.4% Apr-2022 88.7% +16.6% 63.0% +40.0% May-2022 87.2% +9.4% 55.1% +3.0% 12-Month Avg 83.8% +24.7% 55.3% +43.8% Historical % of Properties Sold Over List Price by Month Percentage found when dividing the number of properties sold by properties sold over its original list price, not accounting for seller concessions. * % of Properties Sold Over List Price for all properties from June 2021 through May 2022. This is not the average of the individual figures above. Current as of June 11, 2022. All data from the San Francisco Association of REALTORS® MLS. Report © 2022 ShowingTime. | 11 63.2% 42.1% 79.7% 53.5% 87.2% 55.1% Single Family Condo/TIC/Coop May 0.0% 20.0% 40.0% 60.0% 80.0% 100.0% 1-2005 1-2006 1-2007 1-2008 1-2009 1-2010 1-2011 1-2012 1-2013 1-2014 1-2015 1-2016 1-2017 1-2018 1-2019 1-2020 1-2021 1-2022 Single Family Condo/TIC/Coop 70.5% 53.0% 72.8% 41.8% 86.0% 56.3% Single Family Condo/TIC/Coop Year to Date 2020 2021 2022 + 3.0% + 27.1% + 9.4% + 26.1% - 21.1% + 18.1% + 3.3% + 34.7% 2020 2021 2022 2020 2021 2022 2020 2021 2022 - 21.4% - 4.9% - 4.5% - 33.6%
  • 12. % of List Price Received % of List Price Received Single Family Year-Over-Year Change Condo/TIC/ Coop Year-Over-Year Change Jun-2021 116.3% +10.1% 105.3% +5.4% Jul-2021 118.5% +11.8% 104.8% +3.8% Aug-2021 116.1% +8.0% 104.3% +3.9% Sep-2021 116.3% +8.9% 105.0% +4.8% Oct-2021 117.0% +8.2% 105.6% +4.2% Nov-2021 114.9% +8.4% 104.6% +4.4% Dec-2021 114.3% +7.8% 103.5% +4.2% Jan-2022 117.7% +11.8% 101.1% +2.4% Feb-2022 121.2% +10.5% 106.1% +5.4% Mar-2022 122.0% +8.7% 106.4% +3.9% Apr-2022 123.1% +8.2% 107.3% +3.5% May-2022 119.7% +2.5% 105.9% +0.7% 12-Month Avg* 118.0% +8.4% 105.2% +3.7% Historical % of List Price Received by Month Percentage found when dividing a property’s sales price by its most recent list price, then taking the average for all properties sold in a given month, not accounting for seller concessions. * % of List Price Received for all properties from June 2021 through May 2022. This is not the average of the individual figures above. Current as of June 11, 2022. All data from the San Francisco Association of REALTORS® MLS. Report © 2022 ShowingTime. | 12 105.8% 100.4% 116.8% 105.2% 119.7% 105.9% Single Family Condo/TIC/Coop May 110.0% 103.3% 112.3% 102.6% 121.0% 105.8% Single Family Condo/TIC/Coop Year to Date 90.0% 100.0% 110.0% 120.0% 130.0% 1-2005 1-2006 1-2007 1-2008 1-2009 1-2010 1-2011 1-2012 1-2013 1-2014 1-2015 1-2016 1-2017 1-2018 1-2019 1-2020 1-2021 1-2022 Single Family Condo/TIC/Coop 2020 2021 2022 + 0.7% + 4.8% + 2.5% + 10.4% 2020 2021 2022 - 6.4% - 6.0% 2020 2021 2022 + 3.1% - 0.7% + 7.7% + 2.1% 2020 2021 2022 - 1.1% - 1.4%
  • 13. Housing Affordability Ratio Housing Affordability Ratio Single Family Year-Over-Year Change Condo/TIC/ Coop Year-Over-Year Change Jun-2021 28 -12.5% 52 -3.7% Jul-2021 30 -14.3% 54 +1.9% Aug-2021 30 -14.3% 57 +1.8% Sep-2021 32 -8.6% 55 -3.5% Oct-2021 31 -13.9% 53 -10.2% Nov-2021 30 -14.3% 54 -8.5% Dec-2021 32 -13.5% 49 -21.0% Jan-2022 32 -11.1% 57 -9.5% Feb-2022 27 -18.2% 49 -7.5% Mar-2022 23 -28.1% 45 -13.5% Apr-2022 21 -32.3% 37 -32.7% May-2022 22 -26.7% 42 -22.2% 12-Month Avg* 28 -35.1% 50 -25.6% Historical Housing Affordability Ratio by Month This index measures housing affordability for the region. For example, an index of 120 means the median household income is 120% of what is necessary to qualify for the median-priced home under prevailing interest rates. A higher number means greater affordability. * Affordability Ratio for all properties from June 2021 through May 2022. This is not the average of the individual figures above. Current as of June 11, 2022. All data from the San Francisco Association of REALTORS® MLS. Report © 2022 ShowingTime. | 13 35 59 30 54 22 42 Single Family Condo/TIC/Coop May 20 40 60 80 100 1-2005 1-2006 1-2007 1-2008 1-2009 1-2010 1-2011 1-2012 1-2013 1-2014 1-2015 1-2016 1-2017 1-2018 1-2019 1-2020 1-2021 1-2022 Single Family Condo/TIC/Coop 2020 2021 2022 - 22.2% - 8.5% - 26.7% - 14.3% 2020 2021 2022 + 12.9% + 22.9% 35 54 32 55 23 41 Single Family Condo/TIC/Coop Year to Date 2020 2021 2022 - 25.5% + 1.9% - 28.1% - 8.6% 2020 2021 2022 + 9.4% + 10.2%
  • 14. Months Supply of Inventory Months Supply of Inventory Single Family Year-Over-Year Change Condo/TIC/ Coop Year-Over-Year Change Jun-2021 2.4 -45.5% 4.2 -46.2% Jul-2021 2.5 -46.8% 4.0 -58.3% Aug-2021 2.6 -46.9% 4.0 -60.0% Sep-2021 2.6 -45.8% 4.4 -58.5% Oct-2021 2.4 -48.9% 4.1 -61.7% Nov-2021 2.0 -48.7% 3.6 -61.3% Dec-2021 1.5 -46.4% 2.7 -57.1% Jan-2022 1.9 -32.1% 3.3 -49.2% Feb-2022 2.1 -27.6% 3.8 -37.7% Mar-2022 2.1 -25.0% 3.9 -30.4% Apr-2022 1.9 -29.6% 4.0 -16.7% May-2022 1.7 -32.0% 3.7 -15.9% 12-Month Avg* 2.1 -41.8% 3.8 -50.4% Historical Months Supply of Inventory by Month The inventory of homes for sale at the end of a given month, divided by the average monthly pending sales from the last 12 months. * Months Supply for all properties from June 2021 through May 2022. This is not the average of the individual figures above. Current as of June 11, 2022. All data from the San Francisco Association of REALTORS® MLS. Report © 2022 ShowingTime. | 14 3.9 6.7 2.5 4.4 1.7 3.7 Single Family Condo/TIC/Coop May 0.0 2.0 4.0 6.0 8.0 10.0 12.0 1-2005 1-2006 1-2007 1-2008 1-2009 1-2010 1-2011 1-2012 1-2013 1-2014 1-2015 1-2016 1-2017 1-2018 1-2019 1-2020 1-2021 1-2022 Single Family Condo/TIC/Coop 2020 2021 2022 - 15.9% - 34.3% - 32.0% - 35.9% 2020 2021 2022 + 56.0% + 103.0%
  • 15. All Properties Activity Overview Key metrics by report month and for year-to-date (YTD) starting from the first of the year. Key Metrics Historical Sparkbars 5-2021 5-2022 Percent Change YTD 2021 YTD 2022 Percent Change Current as of June 11, 2022. All data from the San Francisco Association of REALTORS® MLS. Report © 2022 ShowingTime. | 15 Months Supply 3.6 2.9 - 19.4% -- -- -- Affordability Ratio 37 28 - 24.3% % of List Price Received 109.5% 111.9% + 2.2% 106.2% 39 68.3% + 28.1% + 5.5% 28 - 28.2% 112.0% % of Properties Sold Over List Price 63.1% 68.9% + 9.2% 53.3% Active Listings 2,189 1,677 - 23.4% -- Avg. Sales Price $1,791,485 $1,845,206 + 3.0% $1,702,492 Days on Market 30 29 - 3.3% 40 $1,500,000 + 9.6% + 6.7% 29 - 27.5% $1,816,920 -- -- Sold Listings 715 648 - 9.4% 3,096 2,676 - 13.6% Median Sales Price $1,420,000 $1,515,111 + 6.7% $1,369,000 - 10.4% Pending Sales 775 568 - 26.7% 3,399 2,828 - 16.8% New Listings 852 614 - 27.9% 4,334 3,885 5-2019 5-2020 5-2021 5-2022 5-2019 5-2020 5-2021 5-2022 5-2019 5-2020 5-2021 5-2022 5-2019 5-2020 5-2021 5-2022 5-2019 5-2020 5-2021 5-2022 5-2019 5-2020 5-2021 5-2022 5-2019 5-2020 5-2021 5-2022 5-2019 5-2020 5-2021 5-2022 5-2019 5-2020 5-2021 5-2022 5-2019 5-2020 5-2021 5-2022 5-2019 5-2020 5-2021 5-2022
  • 16. Activity by District SF District 1: Northwest (Sea Cliff, Lake, Jordan Park / Laurel Heights, Outer Richmond, Central Ric After two SF District 2: Central West (Outer Sunset, Central Sunset, Inner Sunset, Outer Parkside, Parkside, Inner Parkside, Golden Gate Heights) SF District 3: Southwest (Pine Lake Park, Lake Shore, Merced Manor, Stonestown, Lakeside, Merced Heights, Ingleside, Ingleside Heights, Oceanview) SF District 4: Twin Peaks W (Forest Hill (& Ext), W Portal, St Francis Wd, Balboa Terr, Mt Dav Manor, Ingleside Terr, Monterey Hts, Wstwd Pk & H'lnds, Shrwd Fst, Miraloma Pk, Dmnd Hts, Mdtwn Terr) SF District 5: Central (Haight Ashbury, Cole Vly / Prnssus Hts, Clarndn Hts, Corona Hts, Twin Pks, Glen Pk, Noe Vly, Eureka Vly / Dolores Hts, Mission Dolores, Duboce Trngl, Buena Vista / Ashbury Hts) SF District 6: Central North (Lower Pacific Heights, Anza Vista, Western Addition, North Panhandle, Alamo Square, Hayes Valley) SF District 7: North (Marina, Cow Hollow, Presidio Heights, Pacific Heights) SF District 8: Northeast (North Waterfront, North Beach, Russian Hill, Telegraph Hill, Nob Hill, Financial District / Barbary Coast, Downtown, Van Ness / Civic Center, Tenderloin) SF District 9: Central East (Yerba Buena, South Beach, South of Market, Mission Bay, Inner Mission, Potrero Hill, Central Waterfront / Dogpatch, Bernal Heights) SF District 10: Southeast (Outer Mission, Mission Terr, Excelsior, Portola, Bayview, Silver Terr, Hunters Pt, Candlestick Pt, Bayview Hts, Little Hollywood, Visitation Vly, Crocker Amazon) 5-2021 5-2022 + / – 5-2021 5-2022 + / – 5-2021 5-2022 + / – 5-2021 5-2022 + / – 5-2021 5-2022 + / – Single Family 1 SF District 1 34 25 -26.5% 18 24 +33.3% $2,270,000 $2,962,763 +30.5% 10 13 +30.0% 1.7 1.1 -35.3% 2 SF District 2 83 58 -30.1% 38 60 +57.9% $1,800,000 $1,928,000 +7.1% 9 14 +55.6% 1.9 1.2 -36.8% 3 SF District 3 30 24 -20.0% 20 17 -15.0% $1,579,000 $1,350,000 -14.5% 16 21 +31.3% 1.8 1.5 -16.7% 4 SF District 4 62 42 -32.3% 45 32 -28.9% $2,056,000 $2,152,500 +4.7% 10 15 +50.0% 1.6 1.3 -18.8% 5 SF District 5 116 52 -55.2% 46 38 -17.4% $2,810,000 $2,725,000 -3.0% 22 18 -18.2% 2.8 1.5 -46.4% 6 SF District 6 18 7 -61.1% 4 8 +100.0% $3,655,000 $3,725,000 +1.9% 39 40 +2.6% 3.3 1.4 -57.6% 7 SF District 7 57 37 -35.1% 16 9 -43.8% $6,432,500 $5,600,000 -12.9% 21 80 +281.0% 4.8 3.3 -31.3% 8 SF District 8 27 23 -14.8% 2 3 +50.0% $5,206,106 $4,100,000 -21.2% 53 34 -35.8% 11.9 6.6 -44.5% 9 SF District 9 101 50 -50.5% 30 32 +6.7% $1,737,500 $2,287,500 +31.7% 34 21 -38.2% 3.2 1.9 -40.6% 10 SF District 10 116 85 -26.7% 47 58 +23.4% $1,238,000 $1,326,000 +7.1% 19 17 -10.5% 2.4 1.9 -20.8% Condo/TIC/Coop 1 SF District 1 29 37 +27.6% 20 14 -30.0% $1,353,500 $1,497,500 +10.6% 21 13 -38.1% 1.5 2.2 +46.7% 2 SF District 2 19 13 -31.6% 3 4 +33.3% $1,000,000 $1,450,000 +45.0% 14 47 +235.7% 3.1 2.8 -9.7% 3 SF District 3 11 10 -9.1% 5 2 -60.0% $1,230,000 $776,500 -36.9% 55 37 -32.7% 2.8 2.7 -3.6% 4 SF District 4 15 16 +6.7% 7 7 0.0% $732,500 $850,000 +16.0% 38 24 -36.8% 2.8 2.9 +3.6% 5 SF District 5 159 114 -28.3% 72 65 -9.7% $1,570,000 $1,539,000 -2.0% 17 21 +23.5% 2.8 2.1 -25.0% 6 SF District 6 118 102 -13.6% 33 37 +12.1% $1,299,000 $1,225,000 -5.7% 27 36 +33.3% 2.9 2.8 -3.4% 7 SF District 7 138 89 -35.5% 54 47 -13.0% $1,600,000 $1,995,000 +24.7% 25 28 +12.0% 3.6 2.5 -30.6% 8 SF District 8 306 267 -12.7% 84 64 -23.8% $1,055,000 $1,170,000 +10.9% 52 43 -17.3% 5.7 4.5 -21.1% 9 SF District 9 662 545 -17.7% 155 115 -25.8% $1,025,000 $1,038,000 +1.3% 44 45 +2.3% 5.9 4.9 -16.9% 10 SF District 10 46 45 -2.2% 10 7 -30.0% $829,444 $815,000 -1.7% 24 55 +129.2% 5.8 6.3 +8.6% Key metrics by report month for the districts of San Fransisco. Current as of June 11, 2022. All data from the San Francisco Association of REALTORS® MLS. Report © 2022 ShowingTime. | 16 Active Listings Sold Listings Median Sales Price Days on Market Months Supply