SlideShare ist ein Scribd-Unternehmen logo
1 von 16
Downloaden Sie, um offline zu lesen
July 2022 Monthly Snapshot
One-Year Change in One-Year Change in
Median Sales Price Single
Family
Median Sales Price
Condo/TIC/Coop
2
3
4
5
6
7
8
9
10
11
12
13
14
15
16
Current as of August 11, 2022. All data from the San Francisco Association of REALTORS® MLS. Report © 2022 ShowingTime.
Condo/TIC/Coop Activity Overview
Inventory of Active Listings
% of Properties Sold Over List Price
% of List Price Received
Housing Affordability Ratio
All Properties Activity Overview
New Listings
Pending Sales
Sold Listings
Median Sales Price
Average Sales Price
Days on Market Until Sale
Activity by District
Monthly Indicators
- 9.7% - 0.8% - 1.3%
One-Year Change in
The U.S. housing market has continued to cool, as rising mortgage rates and
record-high sales prices have stifled affordability, weakening demand and
pricing out a multitude of buyers. Nationally, median household income has
failed to keep pace with increasing mortgage payments, with the costs of
buying a home about 80% more expensive now than they were just three
summers ago, according to the National Association of REALTORS® (NAR). As
more and more prospective buyers find their home purchase plans delayed,
many are turning to the rental market, where competition has intensified due to
increased demand.
New Listings were down 44.1 percent for single family homes and 40.8 percent
for Condo/TIC/Coop properties. Pending Sales decreased 31.3 percent for
single family homes and 42.9 percent for Condo/TIC/Coop properties.
The Median Sales Price was down 9.7 percent to $1,670,000 for single family
homes and 0.8 percent to $1,200,000 for Condo/TIC/Coop properties. Months
Supply of Inventory decreased 32.0 percent for single family units and 17.5
percent for Condo/TIC/Coop units.
At a time of year when homebuying activity is typically very strong, soaring
homeownership costs have caused home sales to decline nationwide for the
fifth consecutive month, with existing-home sales falling 5.4% month-to-month
and 14.2% year-over-year as of last measure, according to NAR. But there is a
bright spot. Inventory of existing homes has continued to climb this summer,
with 1.26 million homes available at the beginning of July, equivalent to a 3
months’ supply. And despite the summer slowdown, homes are still selling
quickly, with the typical home staying on market an average of 14 days.
Median Sales Price
All Property Types
Residential real estate activity in San Francisco County (Districts 1-10)
composed of single-family properties, townhomes and condominiums. Percent
changes are calculated using rounded figures.
Single Family Activity Overview
Months Supply of Inventory
For questions or more information, contact
communications@sfrealtors.com.
Single Family Activity Overview
Key metrics by report month and for year-to-date (YTD) starting from the first of the year.
Key Metrics Historical Sparkbars 7-2021 7-2022 Percent Change YTD 2021 YTD 2022 Percent Change
- 13.5%
1,909
1,513 - 12.5%
$1,900,000 + 5.6%
+ 1.2%
Pending Sales 259 178 - 31.3% - 14.9%
1,810 1,540
New Listings 304 170 - 44.1% 2,207
Sold Listings 255 181 - 29.0% 1,730
Median Sales Price $1,850,000 $1,670,000 - 9.7% $1,800,000
19 - 13.6%
$2,363,930
-- --
Days on Market 18 20 + 11.1% 22
Avg. Sales Price $2,292,230 $2,071,125 - 9.6% $2,335,930
Active Listings 652 393 - 39.7% --
% of Properties Sold Over List Price 83.5% 77.9% - 6.7% 76.1%
31
85.0% + 11.7%
+ 4.5%
24 - 22.6%
119.1%
% of List Price Received 118.5% 110.9% - 6.4% 114.0%
Current as of August 11, 2022. All data from the San Francisco Association of REALTORS® MLS. Report © 2022 ShowingTime. | 2
Months Supply 2.5 1.7 - 32.0% -- -- --
Affordability Ratio 30 27 - 10.0%
7-2019 7-2020 7-2021 7-2022
7-2019 7-2020 7-2021 7-2022
7-2019 7-2020 7-2021 7-2022
7-2019 7-2020 7-2021 7-2022
7-2019 7-2020 7-2021 7-2022
7-2019 7-2020 7-2021 7-2022
7-2019 7-2020 7-2021 7-2022
7-2019 7-2020 7-2021 7-2022
7-2019 7-2020 7-2021 7-2022
7-2019 7-2020 7-2021 7-2022
7-2019 7-2020 7-2021 7-2022
Condo/TIC/Coop Activity Overview
Key metrics by report month and for year-to-date (YTD) starting from the first of the year.
Key Metrics Historical Sparkbars 7-2021 7-2022 Percent Change YTD 2021 YTD 2022 Percent Change
- 11.8%
Pending Sales 364 208 - 42.9% 2,840 2,126 - 25.1%
New Listings 429 254 - 40.8% 3,625 3,199
Sold Listings 369 229 - 37.9% 2,750 2,111 - 23.2%
Median Sales Price $1,210,000 $1,200,000 - 0.8% $1,200,000 $1,240,000 + 3.3%
+ 4.3%
37 - 17.8%
$1,409,278
-- --
Days on Market 40 48 + 20.0% 45
Avg. Sales Price $1,357,053 $1,469,174 + 8.3% $1,350,944
Active Listings 1,460 1,044 - 28.5% --
% of Properties Sold Over List Price 55.6% 40.6% - 27.0% 45.8%
55
54.8% + 19.7%
+ 1.8%
42 - 23.6%
105.3%
% of List Price Received 104.8% 101.5% - 3.1% 103.4%
Current as of August 11, 2022. All data from the San Francisco Association of REALTORS® MLS. Report © 2022 ShowingTime. | 3
Months Supply 4.0 3.3 - 17.5% -- -- --
Affordability Ratio 54 43 - 20.4%
7-2019 7-2020 7-2021 7-2022
7-2019 7-2020 7-2021 7-2022
7-2019 7-2020 7-2021 7-2022
7-2019 7-2020 7-2021 7-2022
7-2019 7-2020 7-2021 7-2022
7-2019 7-2020 7-2021 7-2022
7-2019 7-2020 7-2021 7-2022
7-2019 7-2020 7-2021 7-2022
7-2019 7-2020 7-2021 7-2022
7-2019 7-2020 7-2021 7-2022
7-2019 7-2020 7-2021 7-2022
New Listings
New Listings
Single
Family
Year-Over-Year
Change
Condo/TIC/
Coop
Year-Over-Year
Change
Aug-2021 303 -14.4% 440 -32.5%
Sep-2021 379 +6.8% 587 -11.9%
Oct-2021 275 -26.1% 463 -11.3%
Nov-2021 165 -31.5% 281 +10.2%
Dec-2021 110 -25.2% 219 -11.7%
Jan-2022 270 +4.7% 518 -3.2%
Feb-2022 298 -2.6% 531 +5.8%
Mar-2022 349 +0.6% 589 -5.2%
Apr-2022 298 -15.8% 513 -0.6%
May-2022 288 -8.3% 449 -14.8%
Jun-2022 236 -27.2% 345 -30.3%
Jul-2022 170 -44.1% 254 -40.8%
12-Month Avg 262 -14.6% 432 -13.1%
Historical New Listings by Month
Current as of August 11, 2022. All data from the San Francisco Association of REALTORS® MLS. Report © 2022 ShowingTime. | 4
A count of the properties that have been newly listed on the market in a given month.
408
699
304
429
170
254
Single Family Condo/TIC/Coop
July
0
200
400
600
800
1-2005 1-2006 1-2007 1-2008 1-2009 1-2010 1-2011 1-2012 1-2013 1-2014 1-2015 1-2016 1-2017 1-2018 1-2019 1-2020 1-2021 1-2022
Single Family Condo/TIC/Coop
1,924
3,056
2,207
3,625
1,909
3,199
Single Family Condo/TIC/Coop
Year to Date
2020 2021 2022
- 40.8%
- 38.6%
- 44.1%
- 25.5% + 18.6%
- 13.5%
+ 14.7% - 11.8%
2020 2021 2022 2020 2021 2022 2020 2021 2022
+ 75.9% + 6.2% + 25.5%
+ 113.8%
Pending Sales
Pending Sales
Single
Family
Year-Over-Year
Change
Condo/TIC/
Coop
Year-Over-Year
Change
Aug-2021 226 -3.8% 316 -1.9%
Sep-2021 330 +17.4% 336 +9.8%
Oct-2021 273 -12.2% 403 +21.0%
Nov-2021 260 -15.3% 362 +20.7%
Dec-2021 129 -36.8% 226 -26.4%
Jan-2022 145 -14.7% 251 -14.0%
Feb-2022 216 -4.0% 294 -22.8%
Mar-2022 288 -0.3% 439 -7.4%
Apr-2022 268 -6.3% 344 -28.3%
May-2022 248 -19.2% 330 -28.4%
Jun-2022 197 -28.1% 260 -33.0%
Jul-2022 178 -31.3% 208 -42.9%
12-Month Avg 230 -12.4% 314 -14.5%
Historical Pending Sales by Month
Current as of August 11, 2022. All data from the San Francisco Association of REALTORS® MLS. Report © 2022 ShowingTime. | 5
A count of the properties on which offers have been accepted in a given month.
276
242
259
364
178
208
Single Family Condo/TIC/Coop
July
0
100
200
300
400
500
600
1-2005 1-2006 1-2007 1-2008 1-2009 1-2010 1-2011 1-2012 1-2013 1-2014 1-2015 1-2016 1-2017 1-2018 1-2019 1-2020 1-2021 1-2022
Single Family Condo/TIC/Coop
1,182
1,282
1,810
2,840
1,540
2,126
Single Family Condo/TIC/Coop
Year to Date
2020 2021 2022
- 42.9%
+ 50.4%
- 31.3%
- 6.2% + 121.5%
- 14.9%
+ 53.1% - 25.1%
2020 2021 2022 2020 2021 2022 2020 2021 2022
+ 29.6% - 17.9% - 27.3%
+ 12.6%
Sold Listings
Sold Listings
Single
Family
Year-Over-Year
Change
Condo/TIC/
Coop
Year-Over-Year
Change
Aug-2021 256 +5.3% 348 +45.0%
Sep-2021 245 -4.7% 291 -9.9%
Oct-2021 310 +1.6% 362 +24.0%
Nov-2021 293 +3.2% 423 +24.0%
Dec-2021 216 -28.5% 325 -7.9%
Jan-2022 129 -19.9% 186 -31.1%
Feb-2022 159 -2.5% 250 -10.1%
Mar-2022 257 -4.8% 394 -13.8%
Apr-2022 257 -11.1% 377 -18.4%
May-2022 282 +6.0% 368 -16.9%
Jun-2022 248 -23.9% 307 -34.8%
Jul-2022 181 -29.0% 229 -37.9%
12-Month Avg 236 -9.2% 322 -10.2%
Historical Sold Listings by Month
Current as of August 11, 2022. All data from the San Francisco Association of REALTORS® MLS. Report © 2022 ShowingTime. | 6
A count of the actual sales that closed in a given month.
238
266
255
369
181
229
Single Family Condo/TIC/Coop
July
0
100
200
300
400
500
1-2005 1-2006 1-2007 1-2008 1-2009 1-2010 1-2011 1-2012 1-2013 1-2014 1-2015 1-2016 1-2017 1-2018 1-2019 1-2020 1-2021 1-2022
Single Family Condo/TIC/Coop
1,072
1,239
1,730
2,750
1,513
2,111
Single Family Condo/TIC/Coop
Year to Date
2020 2021 2022
- 37.9%
+ 38.7%
- 29.0%
+ 7.1% + 122.0%
- 12.5%
+ 61.4% - 23.2%
2020 2021 2022 2020 2021 2022 2020 2021 2022
- 0.4% - 23.0% - 28.0%
+ 6.8%
Median Sales Price
Median Sales Price
Single
Family
Year-Over-Year
Change
Condo/TIC/
Coop
Year-Over-Year
Change
Aug-2021 $1,847,500 +13.7% $1,150,000 -5.0%
Sep-2021 $1,750,000 +6.1% $1,200,000 +2.1%
Oct-2021 $1,805,000 +12.5% $1,242,500 +7.8%
Nov-2021 $1,880,000 +14.8% $1,260,000 +7.5%
Dec-2021 $1,690,000 +9.0% $1,300,000 +18.2%
Jan-2022 $1,630,000 +3.5% $1,070,000 -0.2%
Feb-2022 $1,930,000 +17.0% $1,227,500 +2.6%
Mar-2022 $2,000,000 +15.9% $1,206,750 -1.2%
Apr-2022 $2,050,000 +13.9% $1,365,000 +13.8%
May-2022 $2,007,500 +6.4% $1,215,000 -1.0%
Jun-2022 $1,865,070 -3.9% $1,240,000 -0.8%
Jul-2022 $1,670,000 -9.7% $1,200,000 -0.8%
12-Month Avg* $1,850,000 +8.2% $1,235,000 +3.3%
Historical Median Sales Price by Month
* Median Sales Price for all properties from August 2021 through July 2022. This is not the
average of the individual figures above.
Current as of August 11, 2022. All data from the San Francisco Association of REALTORS® MLS. Report © 2022 ShowingTime. | 7
Point at which half of the sales sold for more and half sold for less, not accounting for seller concessions, in a given month.
$1,604,000
$1,260,700
$1,850,000
$1,210,000
$1,670,000
$1,200,000
Single Family Condo/TIC/Coop
July
$500,000
$750,000
$1,000,000
$1,250,000
$1,500,000
$1,750,000
$2,000,000
$2,250,000
1-2005 1-2006 1-2007 1-2008 1-2009 1-2010 1-2011 1-2012 1-2013 1-2014 1-2015 1-2016 1-2017 1-2018 1-2019 1-2020 1-2021 1-2022
Single Family Condo/TIC/Coop
$1,609,000
$1,220,000
$1,800,000
$1,200,000
$1,900,000
$1,240,000
Single Family Condo/TIC/Coop
Year to Date
2020 2021 2022
- 0.8%
- 4.0%
- 9.7%
+ 15.3% - 1.6%
+ 5.6%
+ 11.9% + 3.3%
2020 2021 2022 2020 2021 2022 2020 2021 2022
+ 3.5% + 0.9% + 1.7%
+ 5.1%
Average Sales Price
Average Sales
Price
Single
Family
Year-Over-Year
Change
Condo/TIC/
Coop
Year-Over-Year
Change
Aug-2021 $2,128,296 +7.1% $1,425,053 +7.4%
Sep-2021 $2,165,489 +14.2% $1,330,272 +1.9%
Oct-2021 $2,359,157 +23.7% $1,456,361 +16.3%
Nov-2021 $2,352,770 +15.6% $1,539,719 +21.1%
Dec-2021 $2,365,749 +17.5% $1,488,734 +16.1%
Jan-2022 $1,977,367 +1.6% $1,311,263 +8.3%
Feb-2022 $2,417,245 +7.1% $1,398,389 +4.0%
Mar-2022 $2,534,210 +14.4% $1,411,860 +3.1%
Apr-2022 $2,515,877 +3.5% $1,466,749 +8.9%
May-2022 $2,411,895 -2.7% $1,403,132 +1.7%
Jun-2022 $2,356,065 -5.8% $1,366,306 -1.6%
Jul-2022 $2,071,125 -9.6% $1,469,174 +8.3%
12-Month Avg* $2,323,938 +7.0% $1,430,149 +7.7%
Historical Average Sales Price by Month
* Avg. Sales Price for all properties from August 2021 through July 2022. This is not the average
of the individual figures above.
Current as of August 11, 2022. All data from the San Francisco Association of REALTORS® MLS. Report © 2022 ShowingTime. | 8
Average sales price for all closed sales, not accounting for seller concessions, in a given month.
$2,013,417
$1,397,387
$2,292,230
$1,357,053
$2,071,125
$1,469,174
Single Family Condo/TIC/Coop
July
$500,000
$1,000,000
$1,500,000
$2,000,000
$2,500,000
$3,000,000
1-2005 1-2006 1-2007 1-2008 1-2009 1-2010 1-2011 1-2012 1-2013 1-2014 1-2015 1-2016 1-2017 1-2018 1-2019 1-2020 1-2021 1-2022
Single Family Condo/TIC/Coop
$2,051,039
$1,353,553
$2,335,930
$1,350,944
$2,363,930
$1,409,278
Single Family Condo/TIC/Coop
Year to Date
2020 2021 2022
+ 8.3%
- 2.9%
- 9.6%
+ 13.8% - 0.2%
+ 1.2%
+ 13.9% + 4.3%
2020 2021 2022 2020 2021 2022 2020 2021 2022
+ 5.5% + 2.3% + 1.9%
+ 8.7%
Days on Market Until Sale
Days on Market
Until Sale
Single
Family
Year-Over-Year
Change
Condo/TIC/
Coop
Year-Over-Year
Change
Aug-2021 24 0.0% 40 0.0%
Sep-2021 22 -12.0% 37 -17.8%
Oct-2021 19 -29.6% 34 -17.1%
Nov-2021 20 -39.4% 40 -20.0%
Dec-2021 30 -14.3% 45 -27.4%
Jan-2022 37 +2.8% 62 -11.4%
Feb-2022 19 -36.7% 33 -46.8%
Mar-2022 15 -34.8% 32 -28.9%
Apr-2022 15 -21.1% 29 -35.6%
May-2022 20 +11.1% 36 0.0%
Jun-2022 16 -5.9% 38 +8.6%
Jul-2022 20 +11.1% 48 +20.0%
12-Month Avg* 21 -17.5% 38 -17.5%
Historical Days on Market Until Sale by Month
* Days on Market for all properties from August 2021 through July 2022. This is not the average
of the individual figures above.
Current as of August 11, 2022. All data from the San Francisco Association of REALTORS® MLS. Report © 2022 ShowingTime. | 9
Average number of days between when a property is listed and when an offer is accepted in a given month.
25
38
18
40
20
48
Single Family Condo/TIC/Coop
July
0
20
40
60
80
100
120
1-2005 1-2006 1-2007 1-2008 1-2009 1-2010 1-2011 1-2012 1-2013 1-2014 1-2015 1-2016 1-2017 1-2018 1-2019 1-2020 1-2021 1-2022
Single Family Condo/TIC/Coop
25
36
22
45
19
37
Single Family Condo/TIC/Coop
Year to Date
2020 2021 2022
+ 20.0%
+ 5.3%
+ 11.1%
- 28.0% + 25.0%
- 13.6%
- 12.0% - 17.8%
2020 2021 2022 2020 2021 2022 2020 2021 2022
+ 8.7% - 3.8% 0.0%
+ 15.2%
Inventory of Active Listings
Inventory of Active
Listings
Single
Family
Year-Over-Year
Change
Condo/TIC/
Coop
Year-Over-Year
Change
Aug-2021 686 -25.9% 1,475 -30.1%
Sep-2021 685 -26.3% 1,619 -30.2%
Oct-2021 642 -30.8% 1,557 -33.9%
Nov-2021 512 -35.4% 1,362 -35.0%
Dec-2021 380 -35.3% 1,019 -32.3%
Jan-2022 480 -19.6% 1,222 -23.9%
Feb-2022 529 -16.2% 1,378 -13.7%
Mar-2022 551 -13.9% 1,411 -11.1%
Apr-2022 536 -20.6% 1,443 -5.4%
May-2022 518 -19.7% 1,386 -7.8%
Jun-2022 477 -25.9% 1,256 -15.6%
Jul-2022 393 -39.7% 1,044 -28.5%
12-Month Avg* 532 -26.1% 1,348 -23.5%
Historical Inventory of Active Listings by Month
* Active Listings for all properties from August 2021 through July 2022. This is not the average of
the individual figures above.
Current as of August 11, 2022. All data from the San Francisco Association of REALTORS® MLS. Report © 2022 ShowingTime. | 10
The number of properties available for sale in active status at the end of a given month.
862
1,930
652
1,460
393
1,044
Single Family Condo/TIC/Coop
July
0
500
1,000
1,500
2,000
2,500
1-2005 1-2006 1-2007 1-2008 1-2009 1-2010 1-2011 1-2012 1-2013 1-2014 1-2015 1-2016 1-2017 1-2018 1-2019 1-2020 1-2021 1-2022
Single Family Condo/TIC/Coop
2020 2021 2022
- 28.5%
- 24.4%
- 39.7%
- 24.4%
2020 2021 2022
+ 66.4% + 118.8%
% of Properties Sold Over List Price
% of Properties
Sold Over List Price
Single
Family
Year-Over-Year
Change
Condo/TIC/
Coop
Year-Over-Year
Change
Aug-2021 84.4% +28.3% 54.6% +59.6%
Sep-2021 84.5% +30.0% 54.6% +58.7%
Oct-2021 84.5% +25.2% 61.0% +42.5%
Nov-2021 79.5% +29.1% 55.6% +69.5%
Dec-2021 78.7% +25.1% 46.5% +62.6%
Jan-2022 76.0% +31.5% 38.7% +76.7%
Feb-2022 86.8% +27.5% 58.4% +65.4%
Mar-2022 86.4% +16.6% 58.1% +35.4%
Apr-2022 88.7% +16.6% 62.9% +39.2%
May-2022 86.9% +9.0% 55.3% +3.4%
Jun-2022 86.3% +5.0% 57.7% +6.1%
Jul-2022 77.9% -6.7% 40.6% -27.0%
12-Month Avg 83.8% +18.1% 54.8% +31.4%
Historical % of Properties Sold Over List Price by Month
* % of Properties Sold Over List Price for all properties from August 2021 through July 2022. This
is not the average of the individual figures above.
Current as of August 11, 2022. All data from the San Francisco Association of REALTORS® MLS. Report © 2022 ShowingTime. | 11
Percentage found when dividing the number of properties sold by properties sold over its original list price, not accounting for seller
concessions.
64.7%
44.4%
83.5%
55.6%
77.9%
40.6%
Single Family Condo/TIC/Coop
July
0.0%
20.0%
40.0%
60.0%
80.0%
100.0%
1-2005 1-2006 1-2007 1-2008 1-2009 1-2010 1-2011 1-2012 1-2013 1-2014 1-2015 1-2016 1-2017 1-2018 1-2019 1-2020 1-2021 1-2022
Single Family Condo/TIC/Coop
66.6%
48.0%
76.1%
45.8%
85.0%
54.8%
Single Family Condo/TIC/Coop
Year to Date
2020 2021 2022
- 27.0%
+ 25.2%
- 6.7%
+ 29.1% - 4.6%
+ 11.7%
+ 14.3% + 19.7%
2020 2021 2022 2020 2021 2022 2020 2021 2022
- 21.1% - 12.9% - 18.5%
- 36.5%
% of List Price Received
% of List Price
Received
Single
Family
Year-Over-Year
Change
Condo/TIC/
Coop
Year-Over-Year
Change
Aug-2021 116.1% +8.0% 104.3% +3.9%
Sep-2021 116.3% +8.9% 105.0% +4.8%
Oct-2021 117.0% +8.2% 105.6% +4.2%
Nov-2021 114.9% +8.4% 104.6% +4.4%
Dec-2021 114.3% +7.8% 103.5% +4.2%
Jan-2022 117.7% +11.8% 101.1% +2.4%
Feb-2022 121.2% +10.5% 106.1% +5.4%
Mar-2022 121.9% +8.6% 106.4% +3.9%
Apr-2022 123.1% +8.2% 107.3% +3.5%
May-2022 119.6% +2.4% 105.9% +0.7%
Jun-2022 116.9% +0.6% 105.3% 0.0%
Jul-2022 110.9% -6.4% 101.5% -3.1%
12-Month Avg* 117.5% +6.1% 105.0% +2.7%
Historical % of List Price Received by Month
* % of List Price Received for all properties from August 2021 through July 2022. This is not the
average of the individual figures above.
Current as of August 11, 2022. All data from the San Francisco Association of REALTORS® MLS. Report © 2022 ShowingTime. | 12
Percentage found when dividing a property’s sales price by its most recent list price, then taking the average for all properties sold in a given
month, not accounting for seller concessions.
106.0%
101.0%
118.5%
104.8%
110.9%
101.5%
Single Family Condo/TIC/Coop
July
108.4%
102.3%
114.0%
103.4%
119.1%
105.3%
Single Family Condo/TIC/Coop
Year to Date
90.0%
100.0%
110.0%
120.0%
130.0%
1-2005 1-2006 1-2007 1-2008 1-2009 1-2010 1-2011 1-2012 1-2013 1-2014 1-2015 1-2016 1-2017 1-2018 1-2019 1-2020 1-2021 1-2022
Single Family Condo/TIC/Coop
2020 2021 2022
- 3.1%
+ 3.8%
- 6.4%
+ 11.8%
2020 2021 2022
- 8.0% - 6.0%
2020 2021 2022
+ 1.8%
+ 1.1%
+ 4.5%
+ 5.2%
2020 2021 2022
- 3.6% - 3.0%
Housing Affordability Ratio
Housing
Affordability Ratio
Single
Family
Year-Over-Year
Change
Condo/TIC/
Coop
Year-Over-Year
Change
Aug-2021 30 -14.3% 57 +1.8%
Sep-2021 32 -8.6% 55 -3.5%
Oct-2021 31 -13.9% 53 -10.2%
Nov-2021 30 -14.3% 54 -8.5%
Dec-2021 32 -13.5% 49 -21.0%
Jan-2022 32 -11.1% 57 -9.5%
Feb-2022 27 -18.2% 49 -7.5%
Mar-2022 24 -25.0% 45 -13.5%
Apr-2022 21 -32.3% 37 -32.7%
May-2022 22 -26.7% 42 -22.2%
Jun-2022 23 -17.9% 40 -23.1%
Jul-2022 27 -10.0% 43 -20.4%
12-Month Avg* 28 -18.5% 48 -23.8%
Historical Housing Affordability Ratio by Month
* Affordability Ratio for all properties from August 2021 through July 2022. This is not the average
of the individual figures above.
Current as of August 11, 2022. All data from the San Francisco Association of REALTORS® MLS. Report © 2022 ShowingTime. | 13
This index measures housing affordability for the region. For example, an index of 120 means the median household income is 120% of what is
necessary to qualify for the median-priced home under prevailing interest rates. A higher number means greater affordability.
35
53
30
54
27
43
Single Family Condo/TIC/Coop
July
20
40
60
80
100
1-2005 1-2006 1-2007 1-2008 1-2009 1-2010 1-2011 1-2012 1-2013 1-2014 1-2015 1-2016 1-2017 1-2018 1-2019 1-2020 1-2021 1-2022
Single Family Condo/TIC/Coop
2020 2021 2022
- 20.4%
+ 1.9%
- 10.0%
- 14.3%
2020 2021 2022
+ 6.1% + 6.0%
35
55
31
55
24
42
Single Family Condo/TIC/Coop
Year to Date
2020 2021 2022
- 23.6%
0.0%
- 22.6%
- 11.4%
2020 2021 2022
+ 9.4% + 10.0%
Months Supply of Inventory
Months Supply of
Inventory
Single
Family
Year-Over-Year
Change
Condo/TIC/
Coop
Year-Over-Year
Change
Aug-2021 2.6 -46.9% 4.0 -60.0%
Sep-2021 2.6 -45.8% 4.4 -58.5%
Oct-2021 2.4 -48.9% 4.2 -60.7%
Nov-2021 2.0 -48.7% 3.6 -61.3%
Dec-2021 1.5 -46.4% 2.7 -57.1%
Jan-2022 1.9 -32.1% 3.3 -49.2%
Feb-2022 2.1 -27.6% 3.8 -37.7%
Mar-2022 2.2 -21.4% 3.9 -30.4%
Apr-2022 2.2 -18.5% 4.1 -14.6%
May-2022 2.1 -16.0% 4.1 -6.8%
Jun-2022 2.0 -16.7% 3.8 -9.5%
Jul-2022 1.7 -32.0% 3.3 -17.5%
12-Month Avg* 2.1 -36.0% 3.8 -45.1%
Historical Months Supply of Inventory by Month
* Months Supply for all properties from August 2021 through July 2022. This is not the average of
the individual figures above.
Current as of August 11, 2022. All data from the San Francisco Association of REALTORS® MLS. Report © 2022 ShowingTime. | 14
The inventory of homes for sale at the end of a given month, divided by the average monthly pending sales from the last 12 months.
4.7
9.6
2.5
4.0
1.7
3.3
Single Family Condo/TIC/Coop
July
0.0
2.0
4.0
6.0
8.0
10.0
12.0
1-2005 1-2006 1-2007 1-2008 1-2009 1-2010 1-2011 1-2012 1-2013 1-2014 1-2015 1-2016 1-2017 1-2018 1-2019 1-2020 1-2021 1-2022
Single Family Condo/TIC/Coop
2020 2021 2022
- 17.5%
- 58.3%
- 32.0%
- 46.8%
2020 2021 2022
+ 88.0% + 159.5%
All Properties Activity Overview
Key metrics by report month and for year-to-date (YTD) starting from the first of the year.
Key Metrics Historical Sparkbars 7-2021 7-2022 Percent Change YTD 2021 YTD 2022 Percent Change
- 12.7%
Pending Sales 629 392 - 37.7% 4,702 3,703 - 21.2%
New Listings 753 430 - 42.9% 5,923 5,170
Sold Listings 632 414 - 34.5% 4,534 3,661 - 19.3%
Median Sales Price $1,462,500 $1,443,500 - 1.3% $1,400,000 $1,500,000 + 7.1%
+ 4.2%
30 - 16.7%
$1,803,690
-- --
Days on Market 31 36 + 16.1% 36
Avg. Sales Price $1,735,274 $1,733,562 - 0.1% $1,731,813
Active Listings 2,162 1,473 - 31.9% --
% of Properties Sold Over List Price 66.9% 57.0% - 14.8% 57.5%
38
67.3% + 17.0%
+ 3.4%
29 - 23.7%
111.0%
% of List Price Received 110.3% 105.6% - 4.3% 107.4%
Current as of August 11, 2022. All data from the San Francisco Association of REALTORS® MLS. Report © 2022 ShowingTime. | 15
Months Supply 3.4 2.7 - 20.6% -- -- --
Affordability Ratio 38 30 - 21.1%
7-2019 7-2020 7-2021 7-2022
7-2019 7-2020 7-2021 7-2022
7-2019 7-2020 7-2021 7-2022
7-2019 7-2020 7-2021 7-2022
7-2019 7-2020 7-2021 7-2022
7-2019 7-2020 7-2021 7-2022
7-2019 7-2020 7-2021 7-2022
7-2019 7-2020 7-2021 7-2022
7-2019 7-2020 7-2021 7-2022
7-2019 7-2020 7-2021 7-2022
7-2019 7-2020 7-2021 7-2022
Activity by District
SF District 1: Northwest (Sea Cliff, Lake, Jordan Park / Laurel Heights, Outer Richmond, Central Richmond, Inner Richmond, Lone Mountain)
SF District 2: Central West (Outer Sunset, Central Sunset, Inner Sunset, Outer Parkside, Parkside, Inner Parkside, Golden Gate Heights)
SF District 3: Southwest (Pine Lake Park, Lake Shore, Merced Manor, Stonestown, Lakeside, Merced Heights, Ingleside, Ingleside Heights, Oceanview)
SF District 4: Twin Peaks W (Forest Hill (& Ext), W Portal, St Francis Wd, Balboa Terr, Mt Dav Manor, Ingleside Terr, Monterey Hts, Wstwd Pk & H'lnds, Shrwd Fst, Miraloma Pk, Dmnd Hts, Mdtwn Terr)
SF District 5: Central (Haight Ashbury, Cole Vly / Prnssus Hts, Clarndn Hts, Corona Hts, Twin Pks, Glen Pk, Noe Vly, Eureka Vly / Dolores Hts, Mission Dolores, Duboce Trngl, Buena Vista / Ashbury Hts)
SF District 6: Central North (Lower Pacific Heights, Anza Vista, Western Addition, North Panhandle, Alamo Square, Hayes Valley)
SF District 7: North (Marina, Cow Hollow, Presidio Heights, Pacific Heights)
SF District 8: Northeast (North Waterfront, North Beach, Russian Hill, Telegraph Hill, Nob Hill, Financial District / Barbary Coast, Downtown, Van Ness / Civic Center, Tenderloin)
SF District 9: Central East (Yerba Buena, South Beach, South of Market, Mission Bay, Inner Mission, Potrero Hill, Central Waterfront / Dogpatch, Bernal Heights)
SF District 10: Southeast (Outer Mission, Mission Terr, Excelsior, Portola, Bayview, Silver Terr, Hunters Pt, Candlestick Pt, Bayview Hts, Little Hollywood, Visitation Vly, Crocker Amazon)
7-2021 7-2022 + / – 7-2021 7-2022 + / – 7-2021 7-2022 + / – 7-2021 7-2022 + / – 7-2021 7-2022 + / –
Single Family
1 SF District 1 45 29 -35.6% 15 13 -13.3% $2,900,000 $2,410,000 -16.9% 8 16 +100.0% 2.4 1.4 -41.7%
2 SF District 2 83 48 -42.2% 54 41 -24.1% $1,835,000 $1,550,000 -15.5% 10 18 +80.0% 1.8 1.1 -38.9%
3 SF District 3 44 28 -36.4% 14 15 +7.1% $1,600,000 $1,460,000 -8.8% 18 17 -5.6% 2.7 1.7 -37.0%
4 SF District 4 72 54 -25.0% 29 26 -10.3% $1,910,000 $1,940,000 +1.6% 21 17 -19.0% 1.9 1.8 -5.3%
5 SF District 5 121 42 -65.3% 41 27 -34.1% $2,900,000 $2,645,000 -8.8% 17 19 +11.8% 3.0 1.2 -60.0%
6 SF District 6 18 4 -77.8% 5 1 -80.0% $4,750,000 $2,250,000 -52.6% 12 13 +8.3% 3.1 0.9 -71.0%
7 SF District 7 49 20 -59.2% 15 5 -66.7% $4,950,000 $7,030,000 +42.0% 20 16 -20.0% 3.8 2.0 -47.4%
8 SF District 8 22 13 -40.9% 3 3 0.0% $2,850,000 $2,000,000 -29.8% 55 26 -52.7% 9.0 3.7 -58.9%
9 SF District 9 83 50 -39.8% 31 14 -54.8% $1,740,000 $1,727,500 -0.7% 20 23 +15.0% 2.6 2.1 -19.2%
10 SF District 10 115 105 -8.7% 48 36 -25.0% $1,200,000 $1,187,500 -1.0% 26 28 +7.7% 2.3 2.5 +8.7%
Condo/TIC/Coop
1 SF District 1 42 31 -26.2% 15 13 -13.3% $1,325,000 $1,510,000 +14.0% 10 22 +120.0% 2.1 2.0 -4.8%
2 SF District 2 16 10 -37.5% 7 2 -71.4% $1,372,500 $1,400,000 +2.0% 30 29 -3.3% 2.3 2.6 +13.0%
3 SF District 3 7 8 +14.3% 2 2 0.0% $710,000 $751,500 +5.8% 19 23 +21.1% 1.6 2.1 +31.3%
4 SF District 4 19 14 -26.3% 5 3 -40.0% $895,000 $610,000 -31.8% 24 49 +104.2% 3.7 2.6 -29.7%
5 SF District 5 152 100 -34.2% 52 35 -32.7% $1,435,000 $1,400,000 -2.4% 22 41 +86.4% 2.6 1.9 -26.9%
6 SF District 6 121 85 -29.8% 38 22 -42.1% $1,262,050 $1,337,500 +6.0% 28 44 +57.1% 2.8 2.4 -14.3%
7 SF District 7 121 73 -39.7% 46 25 -45.7% $1,625,000 $1,450,000 -10.8% 23 34 +47.8% 3.0 2.2 -26.7%
8 SF District 8 296 202 -31.8% 67 43 -35.8% $1,025,000 $1,050,000 +2.4% 44 49 +11.4% 5.0 3.7 -26.0%
9 SF District 9 635 485 -23.6% 130 76 -41.5% $1,126,500 $1,177,500 +4.5% 58 63 +8.6% 5.2 4.7 -9.6%
10 SF District 10 51 36 -29.4% 7 8 +14.3% $785,000 $734,250 -6.5% 71 39 -45.1% 6.3 5.0 -20.6%
Key metrics by report month for the districts of San Fransisco.
Current as of August 11, 2022. All data from the San Francisco Association of REALTORS® MLS. Report © 2022 ShowingTime. | 16
Active Listings Sold Listings Median Sales Price Days on Market Months Supply

Weitere ähnliche Inhalte

Ă„hnlich wie San Francisco Market Report July 2022.pdf

San Francisco Market Report October 2022.pdf
San Francisco Market Report October 2022.pdfSan Francisco Market Report October 2022.pdf
San Francisco Market Report October 2022.pdfRonny Budiutama
 
San Francisco Market Report December 2021
San Francisco Market Report December 2021San Francisco Market Report December 2021
San Francisco Market Report December 2021Ronny Budiutama
 
San Francisco Market Report November 2022.pdf
San Francisco Market Report November 2022.pdfSan Francisco Market Report November 2022.pdf
San Francisco Market Report November 2022.pdfRonny Budiutama
 
San Francisco Market Report January 2022
San Francisco Market Report January 2022San Francisco Market Report January 2022
San Francisco Market Report January 2022Ronny Budiutama
 
San Francisco Market Report January 2023.pdf
San Francisco Market Report January 2023.pdfSan Francisco Market Report January 2023.pdf
San Francisco Market Report January 2023.pdfRonny Budiutama
 
San Francisco Market Report February 2023
San Francisco Market Report February 2023San Francisco Market Report February 2023
San Francisco Market Report February 2023Ronny Budiutama
 
San Francisco Market Report March 2023.pdf
San Francisco Market Report March 2023.pdfSan Francisco Market Report March 2023.pdf
San Francisco Market Report March 2023.pdfRonny Budiutama
 
San Francisco June 2023 Market Report.pdf
San Francisco June 2023 Market Report.pdfSan Francisco June 2023 Market Report.pdf
San Francisco June 2023 Market Report.pdfRonny Budiutama
 
San Francisco December 2023 Market Report
San Francisco December 2023 Market ReportSan Francisco December 2023 Market Report
San Francisco December 2023 Market ReportRonny Budiutama
 
San Francisco May 2023 Market Report.pdf
San Francisco May 2023 Market Report.pdfSan Francisco May 2023 Market Report.pdf
San Francisco May 2023 Market Report.pdfRonny Budiutama
 
San Francisco Market Report October 2021
San Francisco Market Report October 2021San Francisco Market Report October 2021
San Francisco Market Report October 2021Ronny Budiutama
 
San Francisco market report July 2020
San Francisco market report July 2020San Francisco market report July 2020
San Francisco market report July 2020Ronny Budiutama
 
San Francisco market focus report December 2019
San Francisco market focus report December 2019San Francisco market focus report December 2019
San Francisco market focus report December 2019Ronny Budiutama
 
San Francisco Market Report September 2021
San Francisco Market Report September 2021San Francisco Market Report September 2021
San Francisco Market Report September 2021Ronny Budiutama
 
October 2023 Report: San Francisco Real Estate Market Insights
October 2023 Report: San Francisco Real Estate Market InsightsOctober 2023 Report: San Francisco Real Estate Market Insights
October 2023 Report: San Francisco Real Estate Market InsightsRonny Budiutama
 
San Francisco Market Report June 2021
San Francisco Market Report June 2021San Francisco Market Report June 2021
San Francisco Market Report June 2021Ronny Budiutama
 
San Francisco November 2023 Market Report
San Francisco November 2023 Market ReportSan Francisco November 2023 Market Report
San Francisco November 2023 Market ReportRonny Budiutama
 
San Francisco Market Report August 2021
San Francisco Market Report August 2021San Francisco Market Report August 2021
San Francisco Market Report August 2021Ronny Budiutama
 
San Francisco market report April 2020
San Francisco market report April 2020San Francisco market report April 2020
San Francisco market report April 2020Ronny Budiutama
 
San Francisco January 2024 Market Report
San Francisco January 2024 Market ReportSan Francisco January 2024 Market Report
San Francisco January 2024 Market ReportRonny Budiutama
 

Ă„hnlich wie San Francisco Market Report July 2022.pdf (20)

San Francisco Market Report October 2022.pdf
San Francisco Market Report October 2022.pdfSan Francisco Market Report October 2022.pdf
San Francisco Market Report October 2022.pdf
 
San Francisco Market Report December 2021
San Francisco Market Report December 2021San Francisco Market Report December 2021
San Francisco Market Report December 2021
 
San Francisco Market Report November 2022.pdf
San Francisco Market Report November 2022.pdfSan Francisco Market Report November 2022.pdf
San Francisco Market Report November 2022.pdf
 
San Francisco Market Report January 2022
San Francisco Market Report January 2022San Francisco Market Report January 2022
San Francisco Market Report January 2022
 
San Francisco Market Report January 2023.pdf
San Francisco Market Report January 2023.pdfSan Francisco Market Report January 2023.pdf
San Francisco Market Report January 2023.pdf
 
San Francisco Market Report February 2023
San Francisco Market Report February 2023San Francisco Market Report February 2023
San Francisco Market Report February 2023
 
San Francisco Market Report March 2023.pdf
San Francisco Market Report March 2023.pdfSan Francisco Market Report March 2023.pdf
San Francisco Market Report March 2023.pdf
 
San Francisco June 2023 Market Report.pdf
San Francisco June 2023 Market Report.pdfSan Francisco June 2023 Market Report.pdf
San Francisco June 2023 Market Report.pdf
 
San Francisco December 2023 Market Report
San Francisco December 2023 Market ReportSan Francisco December 2023 Market Report
San Francisco December 2023 Market Report
 
San Francisco May 2023 Market Report.pdf
San Francisco May 2023 Market Report.pdfSan Francisco May 2023 Market Report.pdf
San Francisco May 2023 Market Report.pdf
 
San Francisco Market Report October 2021
San Francisco Market Report October 2021San Francisco Market Report October 2021
San Francisco Market Report October 2021
 
San Francisco market report July 2020
San Francisco market report July 2020San Francisco market report July 2020
San Francisco market report July 2020
 
San Francisco market focus report December 2019
San Francisco market focus report December 2019San Francisco market focus report December 2019
San Francisco market focus report December 2019
 
San Francisco Market Report September 2021
San Francisco Market Report September 2021San Francisco Market Report September 2021
San Francisco Market Report September 2021
 
October 2023 Report: San Francisco Real Estate Market Insights
October 2023 Report: San Francisco Real Estate Market InsightsOctober 2023 Report: San Francisco Real Estate Market Insights
October 2023 Report: San Francisco Real Estate Market Insights
 
San Francisco Market Report June 2021
San Francisco Market Report June 2021San Francisco Market Report June 2021
San Francisco Market Report June 2021
 
San Francisco November 2023 Market Report
San Francisco November 2023 Market ReportSan Francisco November 2023 Market Report
San Francisco November 2023 Market Report
 
San Francisco Market Report August 2021
San Francisco Market Report August 2021San Francisco Market Report August 2021
San Francisco Market Report August 2021
 
San Francisco market report April 2020
San Francisco market report April 2020San Francisco market report April 2020
San Francisco market report April 2020
 
San Francisco January 2024 Market Report
San Francisco January 2024 Market ReportSan Francisco January 2024 Market Report
San Francisco January 2024 Market Report
 

Mehr von Ronny Budiutama

2023 Annual San Francisco Housing Market
2023 Annual San Francisco Housing Market2023 Annual San Francisco Housing Market
2023 Annual San Francisco Housing MarketRonny Budiutama
 
CA Weekly MLS Market Data Report - August 2023
CA Weekly MLS Market Data Report - August 2023CA Weekly MLS Market Data Report - August 2023
CA Weekly MLS Market Data Report - August 2023Ronny Budiutama
 
San Francisco Market Report July 2023.pdf
San Francisco Market Report July 2023.pdfSan Francisco Market Report July 2023.pdf
San Francisco Market Report July 2023.pdfRonny Budiutama
 
Annual Report on the San Francisco County Housing Market.pdf
Annual Report on the San Francisco County Housing Market.pdfAnnual Report on the San Francisco County Housing Market.pdf
Annual Report on the San Francisco County Housing Market.pdfRonny Budiutama
 
San Francisco Market Report November 2021
San Francisco Market Report November 2021San Francisco Market Report November 2021
San Francisco Market Report November 2021Ronny Budiutama
 
San Francisco Market Report For July 2021
San Francisco Market Report For July 2021San Francisco Market Report For July 2021
San Francisco Market Report For July 2021Ronny Budiutama
 

Mehr von Ronny Budiutama (6)

2023 Annual San Francisco Housing Market
2023 Annual San Francisco Housing Market2023 Annual San Francisco Housing Market
2023 Annual San Francisco Housing Market
 
CA Weekly MLS Market Data Report - August 2023
CA Weekly MLS Market Data Report - August 2023CA Weekly MLS Market Data Report - August 2023
CA Weekly MLS Market Data Report - August 2023
 
San Francisco Market Report July 2023.pdf
San Francisco Market Report July 2023.pdfSan Francisco Market Report July 2023.pdf
San Francisco Market Report July 2023.pdf
 
Annual Report on the San Francisco County Housing Market.pdf
Annual Report on the San Francisco County Housing Market.pdfAnnual Report on the San Francisco County Housing Market.pdf
Annual Report on the San Francisco County Housing Market.pdf
 
San Francisco Market Report November 2021
San Francisco Market Report November 2021San Francisco Market Report November 2021
San Francisco Market Report November 2021
 
San Francisco Market Report For July 2021
San Francisco Market Report For July 2021San Francisco Market Report For July 2021
San Francisco Market Report For July 2021
 

KĂĽrzlich hochgeladen

Call Girls In Laxmi Nagar Delhi +91-8447779280! !Best Woman Seeking Man Escor...
Call Girls In Laxmi Nagar Delhi +91-8447779280! !Best Woman Seeking Man Escor...Call Girls In Laxmi Nagar Delhi +91-8447779280! !Best Woman Seeking Man Escor...
Call Girls In Laxmi Nagar Delhi +91-8447779280! !Best Woman Seeking Man Escor...asmaqueen5
 
Maha Mauka Squarefeet Brochure |Maha Mauka Squarefeet PDF Brochure|
Maha Mauka Squarefeet Brochure |Maha Mauka Squarefeet PDF Brochure|Maha Mauka Squarefeet Brochure |Maha Mauka Squarefeet PDF Brochure|
Maha Mauka Squarefeet Brochure |Maha Mauka Squarefeet PDF Brochure|AkshayJoshi575980
 
Properties for Sale in Istanbul with Schools and Parks | Antalya Development
Properties for Sale in Istanbul with Schools and Parks | Antalya DevelopmentProperties for Sale in Istanbul with Schools and Parks | Antalya Development
Properties for Sale in Istanbul with Schools and Parks | Antalya DevelopmentAntalya Development
 
BDSM⚡Call Girls in Sector 57 Noida Escorts >༒8448380779 Escort Service
BDSM⚡Call Girls in Sector 57 Noida Escorts >༒8448380779 Escort ServiceBDSM⚡Call Girls in Sector 57 Noida Escorts >༒8448380779 Escort Service
BDSM⚡Call Girls in Sector 57 Noida Escorts >༒8448380779 Escort ServiceDelhi Call girls
 
9990771857 Call Girls in Dwarka Sector 2 Delhi (Call Girls) Delhi
9990771857 Call Girls in Dwarka Sector 2 Delhi (Call Girls) Delhi9990771857 Call Girls in Dwarka Sector 2 Delhi (Call Girls) Delhi
9990771857 Call Girls in Dwarka Sector 2 Delhi (Call Girls) Delhidelhimodel235
 
9990771857 Call Girls in Dwarka Sector 1 Delhi (Call Girls) Delhi
9990771857 Call Girls in Dwarka Sector 1 Delhi (Call Girls) Delhi9990771857 Call Girls in Dwarka Sector 1 Delhi (Call Girls) Delhi
9990771857 Call Girls in Dwarka Sector 1 Delhi (Call Girls) Delhidelhimodel235
 
Shapoorji Pallonji Joyville Vista Pune | Spend Your Family Time Together
Shapoorji Pallonji Joyville Vista Pune | Spend Your Family Time TogetherShapoorji Pallonji Joyville Vista Pune | Spend Your Family Time Together
Shapoorji Pallonji Joyville Vista Pune | Spend Your Family Time Togetheraidasheikh47
 
Call Girls In Vasant Vihar Delhi 💯Call Us 🔝8264348440🔝
Call Girls In Vasant Vihar Delhi 💯Call Us 🔝8264348440🔝Call Girls In Vasant Vihar Delhi 💯Call Us 🔝8264348440🔝
Call Girls In Vasant Vihar Delhi 💯Call Us 🔝8264348440🔝soniya singh
 
Call Girls in shastri nagar Delhi 8264348440 ✅ call girls ❤️
Call Girls in shastri nagar Delhi 8264348440 ✅ call girls ❤️Call Girls in shastri nagar Delhi 8264348440 ✅ call girls ❤️
Call Girls in shastri nagar Delhi 8264348440 ✅ call girls ❤️soniya singh
 
M3M The Line Brochure - Premium Investment Opportunity for Commercial Ventures
M3M The Line Brochure - Premium Investment Opportunity for Commercial VenturesM3M The Line Brochure - Premium Investment Opportunity for Commercial Ventures
M3M The Line Brochure - Premium Investment Opportunity for Commercial Venturessheltercareglobal
 
Call Girls In Chand Nagar (Delhi)+918447779280 Welcome To Vip Women Seeking M...
Call Girls In Chand Nagar (Delhi)+918447779280 Welcome To Vip Women Seeking M...Call Girls In Chand Nagar (Delhi)+918447779280 Welcome To Vip Women Seeking M...
Call Girls In Chand Nagar (Delhi)+918447779280 Welcome To Vip Women Seeking M...asmaqueen5
 
9990771857 Call Girls in Dwarka Sector 137 Noida (Call Girls) Delhi
9990771857 Call Girls in Dwarka Sector 137 Noida (Call Girls) Delhi9990771857 Call Girls in Dwarka Sector 137 Noida (Call Girls) Delhi
9990771857 Call Girls in Dwarka Sector 137 Noida (Call Girls) Delhidelhimodel235
 
2k Shot Call girls Karol Bagh Delhi 9205541914
2k Shot Call girls Karol Bagh Delhi 92055419142k Shot Call girls Karol Bagh Delhi 9205541914
2k Shot Call girls Karol Bagh Delhi 9205541914Delhi Call girls
 
Majestique Viman Nagar Pune Brochure.pdf
Majestique Viman Nagar Pune Brochure.pdfMajestique Viman Nagar Pune Brochure.pdf
Majestique Viman Nagar Pune Brochure.pdfBabyrudram
 
Listing Turkey Sylvana Istanbul - Bahcesehir
Listing Turkey Sylvana Istanbul - BahcesehirListing Turkey Sylvana Istanbul - Bahcesehir
Listing Turkey Sylvana Istanbul - BahcesehirListing Turkey
 
Premium Villa Projects in Sarjapur Road Bengaluru
Premium Villa Projects in Sarjapur Road BengaluruPremium Villa Projects in Sarjapur Road Bengaluru
Premium Villa Projects in Sarjapur Road BengaluruShivaSeo3
 
Call Girls in Noida Sector 12 Noida 💯Call Us 🔝 9582086666 🔝 South Delhi Escor...
Call Girls in Noida Sector 12 Noida 💯Call Us 🔝 9582086666 🔝 South Delhi Escor...Call Girls in Noida Sector 12 Noida 💯Call Us 🔝 9582086666 🔝 South Delhi Escor...
Call Girls in Noida Sector 12 Noida 💯Call Us 🔝 9582086666 🔝 South Delhi Escor...delhimodel235
 
Low Rate ↬Call Girls in Trilokpuri Delhi ↫8447779280}Escorts Service In Delhi
Low Rate ↬Call Girls in Trilokpuri Delhi ↫8447779280}Escorts Service In DelhiLow Rate ↬Call Girls in Trilokpuri Delhi ↫8447779280}Escorts Service In Delhi
Low Rate ↬Call Girls in Trilokpuri Delhi ↫8447779280}Escorts Service In Delhiasmaqueen5
 
M3M 129 E Brochure Noida Expressway, Sector 129, Noida
M3M 129 E Brochure Noida Expressway, Sector 129, NoidaM3M 129 E Brochure Noida Expressway, Sector 129, Noida
M3M 129 E Brochure Noida Expressway, Sector 129, Noidasarak0han45400
 
9990771857 Call Girls in Dwarka Sector 3 Delhi (Call Girls) Delhi
9990771857 Call Girls in Dwarka Sector 3 Delhi (Call Girls) Delhi9990771857 Call Girls in Dwarka Sector 3 Delhi (Call Girls) Delhi
9990771857 Call Girls in Dwarka Sector 3 Delhi (Call Girls) Delhidelhimodel235
 

KĂĽrzlich hochgeladen (20)

Call Girls In Laxmi Nagar Delhi +91-8447779280! !Best Woman Seeking Man Escor...
Call Girls In Laxmi Nagar Delhi +91-8447779280! !Best Woman Seeking Man Escor...Call Girls In Laxmi Nagar Delhi +91-8447779280! !Best Woman Seeking Man Escor...
Call Girls In Laxmi Nagar Delhi +91-8447779280! !Best Woman Seeking Man Escor...
 
Maha Mauka Squarefeet Brochure |Maha Mauka Squarefeet PDF Brochure|
Maha Mauka Squarefeet Brochure |Maha Mauka Squarefeet PDF Brochure|Maha Mauka Squarefeet Brochure |Maha Mauka Squarefeet PDF Brochure|
Maha Mauka Squarefeet Brochure |Maha Mauka Squarefeet PDF Brochure|
 
Properties for Sale in Istanbul with Schools and Parks | Antalya Development
Properties for Sale in Istanbul with Schools and Parks | Antalya DevelopmentProperties for Sale in Istanbul with Schools and Parks | Antalya Development
Properties for Sale in Istanbul with Schools and Parks | Antalya Development
 
BDSM⚡Call Girls in Sector 57 Noida Escorts >༒8448380779 Escort Service
BDSM⚡Call Girls in Sector 57 Noida Escorts >༒8448380779 Escort ServiceBDSM⚡Call Girls in Sector 57 Noida Escorts >༒8448380779 Escort Service
BDSM⚡Call Girls in Sector 57 Noida Escorts >༒8448380779 Escort Service
 
9990771857 Call Girls in Dwarka Sector 2 Delhi (Call Girls) Delhi
9990771857 Call Girls in Dwarka Sector 2 Delhi (Call Girls) Delhi9990771857 Call Girls in Dwarka Sector 2 Delhi (Call Girls) Delhi
9990771857 Call Girls in Dwarka Sector 2 Delhi (Call Girls) Delhi
 
9990771857 Call Girls in Dwarka Sector 1 Delhi (Call Girls) Delhi
9990771857 Call Girls in Dwarka Sector 1 Delhi (Call Girls) Delhi9990771857 Call Girls in Dwarka Sector 1 Delhi (Call Girls) Delhi
9990771857 Call Girls in Dwarka Sector 1 Delhi (Call Girls) Delhi
 
Shapoorji Pallonji Joyville Vista Pune | Spend Your Family Time Together
Shapoorji Pallonji Joyville Vista Pune | Spend Your Family Time TogetherShapoorji Pallonji Joyville Vista Pune | Spend Your Family Time Together
Shapoorji Pallonji Joyville Vista Pune | Spend Your Family Time Together
 
Call Girls In Vasant Vihar Delhi 💯Call Us 🔝8264348440🔝
Call Girls In Vasant Vihar Delhi 💯Call Us 🔝8264348440🔝Call Girls In Vasant Vihar Delhi 💯Call Us 🔝8264348440🔝
Call Girls In Vasant Vihar Delhi 💯Call Us 🔝8264348440🔝
 
Call Girls in shastri nagar Delhi 8264348440 ✅ call girls ❤️
Call Girls in shastri nagar Delhi 8264348440 ✅ call girls ❤️Call Girls in shastri nagar Delhi 8264348440 ✅ call girls ❤️
Call Girls in shastri nagar Delhi 8264348440 ✅ call girls ❤️
 
M3M The Line Brochure - Premium Investment Opportunity for Commercial Ventures
M3M The Line Brochure - Premium Investment Opportunity for Commercial VenturesM3M The Line Brochure - Premium Investment Opportunity for Commercial Ventures
M3M The Line Brochure - Premium Investment Opportunity for Commercial Ventures
 
Call Girls In Chand Nagar (Delhi)+918447779280 Welcome To Vip Women Seeking M...
Call Girls In Chand Nagar (Delhi)+918447779280 Welcome To Vip Women Seeking M...Call Girls In Chand Nagar (Delhi)+918447779280 Welcome To Vip Women Seeking M...
Call Girls In Chand Nagar (Delhi)+918447779280 Welcome To Vip Women Seeking M...
 
9990771857 Call Girls in Dwarka Sector 137 Noida (Call Girls) Delhi
9990771857 Call Girls in Dwarka Sector 137 Noida (Call Girls) Delhi9990771857 Call Girls in Dwarka Sector 137 Noida (Call Girls) Delhi
9990771857 Call Girls in Dwarka Sector 137 Noida (Call Girls) Delhi
 
2k Shot Call girls Karol Bagh Delhi 9205541914
2k Shot Call girls Karol Bagh Delhi 92055419142k Shot Call girls Karol Bagh Delhi 9205541914
2k Shot Call girls Karol Bagh Delhi 9205541914
 
Majestique Viman Nagar Pune Brochure.pdf
Majestique Viman Nagar Pune Brochure.pdfMajestique Viman Nagar Pune Brochure.pdf
Majestique Viman Nagar Pune Brochure.pdf
 
Listing Turkey Sylvana Istanbul - Bahcesehir
Listing Turkey Sylvana Istanbul - BahcesehirListing Turkey Sylvana Istanbul - Bahcesehir
Listing Turkey Sylvana Istanbul - Bahcesehir
 
Premium Villa Projects in Sarjapur Road Bengaluru
Premium Villa Projects in Sarjapur Road BengaluruPremium Villa Projects in Sarjapur Road Bengaluru
Premium Villa Projects in Sarjapur Road Bengaluru
 
Call Girls in Noida Sector 12 Noida 💯Call Us 🔝 9582086666 🔝 South Delhi Escor...
Call Girls in Noida Sector 12 Noida 💯Call Us 🔝 9582086666 🔝 South Delhi Escor...Call Girls in Noida Sector 12 Noida 💯Call Us 🔝 9582086666 🔝 South Delhi Escor...
Call Girls in Noida Sector 12 Noida 💯Call Us 🔝 9582086666 🔝 South Delhi Escor...
 
Low Rate ↬Call Girls in Trilokpuri Delhi ↫8447779280}Escorts Service In Delhi
Low Rate ↬Call Girls in Trilokpuri Delhi ↫8447779280}Escorts Service In DelhiLow Rate ↬Call Girls in Trilokpuri Delhi ↫8447779280}Escorts Service In Delhi
Low Rate ↬Call Girls in Trilokpuri Delhi ↫8447779280}Escorts Service In Delhi
 
M3M 129 E Brochure Noida Expressway, Sector 129, Noida
M3M 129 E Brochure Noida Expressway, Sector 129, NoidaM3M 129 E Brochure Noida Expressway, Sector 129, Noida
M3M 129 E Brochure Noida Expressway, Sector 129, Noida
 
9990771857 Call Girls in Dwarka Sector 3 Delhi (Call Girls) Delhi
9990771857 Call Girls in Dwarka Sector 3 Delhi (Call Girls) Delhi9990771857 Call Girls in Dwarka Sector 3 Delhi (Call Girls) Delhi
9990771857 Call Girls in Dwarka Sector 3 Delhi (Call Girls) Delhi
 

San Francisco Market Report July 2022.pdf

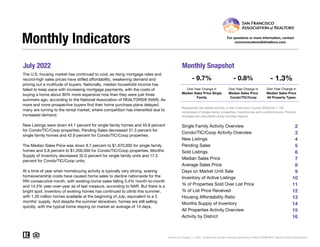
  • 1. July 2022 Monthly Snapshot One-Year Change in One-Year Change in Median Sales Price Single Family Median Sales Price Condo/TIC/Coop 2 3 4 5 6 7 8 9 10 11 12 13 14 15 16 Current as of August 11, 2022. All data from the San Francisco Association of REALTORS® MLS. Report © 2022 ShowingTime. Condo/TIC/Coop Activity Overview Inventory of Active Listings % of Properties Sold Over List Price % of List Price Received Housing Affordability Ratio All Properties Activity Overview New Listings Pending Sales Sold Listings Median Sales Price Average Sales Price Days on Market Until Sale Activity by District Monthly Indicators - 9.7% - 0.8% - 1.3% One-Year Change in The U.S. housing market has continued to cool, as rising mortgage rates and record-high sales prices have stifled affordability, weakening demand and pricing out a multitude of buyers. Nationally, median household income has failed to keep pace with increasing mortgage payments, with the costs of buying a home about 80% more expensive now than they were just three summers ago, according to the National Association of REALTORS® (NAR). As more and more prospective buyers find their home purchase plans delayed, many are turning to the rental market, where competition has intensified due to increased demand. New Listings were down 44.1 percent for single family homes and 40.8 percent for Condo/TIC/Coop properties. Pending Sales decreased 31.3 percent for single family homes and 42.9 percent for Condo/TIC/Coop properties. The Median Sales Price was down 9.7 percent to $1,670,000 for single family homes and 0.8 percent to $1,200,000 for Condo/TIC/Coop properties. Months Supply of Inventory decreased 32.0 percent for single family units and 17.5 percent for Condo/TIC/Coop units. At a time of year when homebuying activity is typically very strong, soaring homeownership costs have caused home sales to decline nationwide for the fifth consecutive month, with existing-home sales falling 5.4% month-to-month and 14.2% year-over-year as of last measure, according to NAR. But there is a bright spot. Inventory of existing homes has continued to climb this summer, with 1.26 million homes available at the beginning of July, equivalent to a 3 months’ supply. And despite the summer slowdown, homes are still selling quickly, with the typical home staying on market an average of 14 days. Median Sales Price All Property Types Residential real estate activity in San Francisco County (Districts 1-10) composed of single-family properties, townhomes and condominiums. Percent changes are calculated using rounded figures. Single Family Activity Overview Months Supply of Inventory For questions or more information, contact communications@sfrealtors.com.
  • 2. Single Family Activity Overview Key metrics by report month and for year-to-date (YTD) starting from the first of the year. Key Metrics Historical Sparkbars 7-2021 7-2022 Percent Change YTD 2021 YTD 2022 Percent Change - 13.5% 1,909 1,513 - 12.5% $1,900,000 + 5.6% + 1.2% Pending Sales 259 178 - 31.3% - 14.9% 1,810 1,540 New Listings 304 170 - 44.1% 2,207 Sold Listings 255 181 - 29.0% 1,730 Median Sales Price $1,850,000 $1,670,000 - 9.7% $1,800,000 19 - 13.6% $2,363,930 -- -- Days on Market 18 20 + 11.1% 22 Avg. Sales Price $2,292,230 $2,071,125 - 9.6% $2,335,930 Active Listings 652 393 - 39.7% -- % of Properties Sold Over List Price 83.5% 77.9% - 6.7% 76.1% 31 85.0% + 11.7% + 4.5% 24 - 22.6% 119.1% % of List Price Received 118.5% 110.9% - 6.4% 114.0% Current as of August 11, 2022. All data from the San Francisco Association of REALTORS® MLS. Report © 2022 ShowingTime. | 2 Months Supply 2.5 1.7 - 32.0% -- -- -- Affordability Ratio 30 27 - 10.0% 7-2019 7-2020 7-2021 7-2022 7-2019 7-2020 7-2021 7-2022 7-2019 7-2020 7-2021 7-2022 7-2019 7-2020 7-2021 7-2022 7-2019 7-2020 7-2021 7-2022 7-2019 7-2020 7-2021 7-2022 7-2019 7-2020 7-2021 7-2022 7-2019 7-2020 7-2021 7-2022 7-2019 7-2020 7-2021 7-2022 7-2019 7-2020 7-2021 7-2022 7-2019 7-2020 7-2021 7-2022
  • 3. Condo/TIC/Coop Activity Overview Key metrics by report month and for year-to-date (YTD) starting from the first of the year. Key Metrics Historical Sparkbars 7-2021 7-2022 Percent Change YTD 2021 YTD 2022 Percent Change - 11.8% Pending Sales 364 208 - 42.9% 2,840 2,126 - 25.1% New Listings 429 254 - 40.8% 3,625 3,199 Sold Listings 369 229 - 37.9% 2,750 2,111 - 23.2% Median Sales Price $1,210,000 $1,200,000 - 0.8% $1,200,000 $1,240,000 + 3.3% + 4.3% 37 - 17.8% $1,409,278 -- -- Days on Market 40 48 + 20.0% 45 Avg. Sales Price $1,357,053 $1,469,174 + 8.3% $1,350,944 Active Listings 1,460 1,044 - 28.5% -- % of Properties Sold Over List Price 55.6% 40.6% - 27.0% 45.8% 55 54.8% + 19.7% + 1.8% 42 - 23.6% 105.3% % of List Price Received 104.8% 101.5% - 3.1% 103.4% Current as of August 11, 2022. All data from the San Francisco Association of REALTORS® MLS. Report © 2022 ShowingTime. | 3 Months Supply 4.0 3.3 - 17.5% -- -- -- Affordability Ratio 54 43 - 20.4% 7-2019 7-2020 7-2021 7-2022 7-2019 7-2020 7-2021 7-2022 7-2019 7-2020 7-2021 7-2022 7-2019 7-2020 7-2021 7-2022 7-2019 7-2020 7-2021 7-2022 7-2019 7-2020 7-2021 7-2022 7-2019 7-2020 7-2021 7-2022 7-2019 7-2020 7-2021 7-2022 7-2019 7-2020 7-2021 7-2022 7-2019 7-2020 7-2021 7-2022 7-2019 7-2020 7-2021 7-2022
  • 4. New Listings New Listings Single Family Year-Over-Year Change Condo/TIC/ Coop Year-Over-Year Change Aug-2021 303 -14.4% 440 -32.5% Sep-2021 379 +6.8% 587 -11.9% Oct-2021 275 -26.1% 463 -11.3% Nov-2021 165 -31.5% 281 +10.2% Dec-2021 110 -25.2% 219 -11.7% Jan-2022 270 +4.7% 518 -3.2% Feb-2022 298 -2.6% 531 +5.8% Mar-2022 349 +0.6% 589 -5.2% Apr-2022 298 -15.8% 513 -0.6% May-2022 288 -8.3% 449 -14.8% Jun-2022 236 -27.2% 345 -30.3% Jul-2022 170 -44.1% 254 -40.8% 12-Month Avg 262 -14.6% 432 -13.1% Historical New Listings by Month Current as of August 11, 2022. All data from the San Francisco Association of REALTORS® MLS. Report © 2022 ShowingTime. | 4 A count of the properties that have been newly listed on the market in a given month. 408 699 304 429 170 254 Single Family Condo/TIC/Coop July 0 200 400 600 800 1-2005 1-2006 1-2007 1-2008 1-2009 1-2010 1-2011 1-2012 1-2013 1-2014 1-2015 1-2016 1-2017 1-2018 1-2019 1-2020 1-2021 1-2022 Single Family Condo/TIC/Coop 1,924 3,056 2,207 3,625 1,909 3,199 Single Family Condo/TIC/Coop Year to Date 2020 2021 2022 - 40.8% - 38.6% - 44.1% - 25.5% + 18.6% - 13.5% + 14.7% - 11.8% 2020 2021 2022 2020 2021 2022 2020 2021 2022 + 75.9% + 6.2% + 25.5% + 113.8%
  • 5. Pending Sales Pending Sales Single Family Year-Over-Year Change Condo/TIC/ Coop Year-Over-Year Change Aug-2021 226 -3.8% 316 -1.9% Sep-2021 330 +17.4% 336 +9.8% Oct-2021 273 -12.2% 403 +21.0% Nov-2021 260 -15.3% 362 +20.7% Dec-2021 129 -36.8% 226 -26.4% Jan-2022 145 -14.7% 251 -14.0% Feb-2022 216 -4.0% 294 -22.8% Mar-2022 288 -0.3% 439 -7.4% Apr-2022 268 -6.3% 344 -28.3% May-2022 248 -19.2% 330 -28.4% Jun-2022 197 -28.1% 260 -33.0% Jul-2022 178 -31.3% 208 -42.9% 12-Month Avg 230 -12.4% 314 -14.5% Historical Pending Sales by Month Current as of August 11, 2022. All data from the San Francisco Association of REALTORS® MLS. Report © 2022 ShowingTime. | 5 A count of the properties on which offers have been accepted in a given month. 276 242 259 364 178 208 Single Family Condo/TIC/Coop July 0 100 200 300 400 500 600 1-2005 1-2006 1-2007 1-2008 1-2009 1-2010 1-2011 1-2012 1-2013 1-2014 1-2015 1-2016 1-2017 1-2018 1-2019 1-2020 1-2021 1-2022 Single Family Condo/TIC/Coop 1,182 1,282 1,810 2,840 1,540 2,126 Single Family Condo/TIC/Coop Year to Date 2020 2021 2022 - 42.9% + 50.4% - 31.3% - 6.2% + 121.5% - 14.9% + 53.1% - 25.1% 2020 2021 2022 2020 2021 2022 2020 2021 2022 + 29.6% - 17.9% - 27.3% + 12.6%
  • 6. Sold Listings Sold Listings Single Family Year-Over-Year Change Condo/TIC/ Coop Year-Over-Year Change Aug-2021 256 +5.3% 348 +45.0% Sep-2021 245 -4.7% 291 -9.9% Oct-2021 310 +1.6% 362 +24.0% Nov-2021 293 +3.2% 423 +24.0% Dec-2021 216 -28.5% 325 -7.9% Jan-2022 129 -19.9% 186 -31.1% Feb-2022 159 -2.5% 250 -10.1% Mar-2022 257 -4.8% 394 -13.8% Apr-2022 257 -11.1% 377 -18.4% May-2022 282 +6.0% 368 -16.9% Jun-2022 248 -23.9% 307 -34.8% Jul-2022 181 -29.0% 229 -37.9% 12-Month Avg 236 -9.2% 322 -10.2% Historical Sold Listings by Month Current as of August 11, 2022. All data from the San Francisco Association of REALTORS® MLS. Report © 2022 ShowingTime. | 6 A count of the actual sales that closed in a given month. 238 266 255 369 181 229 Single Family Condo/TIC/Coop July 0 100 200 300 400 500 1-2005 1-2006 1-2007 1-2008 1-2009 1-2010 1-2011 1-2012 1-2013 1-2014 1-2015 1-2016 1-2017 1-2018 1-2019 1-2020 1-2021 1-2022 Single Family Condo/TIC/Coop 1,072 1,239 1,730 2,750 1,513 2,111 Single Family Condo/TIC/Coop Year to Date 2020 2021 2022 - 37.9% + 38.7% - 29.0% + 7.1% + 122.0% - 12.5% + 61.4% - 23.2% 2020 2021 2022 2020 2021 2022 2020 2021 2022 - 0.4% - 23.0% - 28.0% + 6.8%
  • 7. Median Sales Price Median Sales Price Single Family Year-Over-Year Change Condo/TIC/ Coop Year-Over-Year Change Aug-2021 $1,847,500 +13.7% $1,150,000 -5.0% Sep-2021 $1,750,000 +6.1% $1,200,000 +2.1% Oct-2021 $1,805,000 +12.5% $1,242,500 +7.8% Nov-2021 $1,880,000 +14.8% $1,260,000 +7.5% Dec-2021 $1,690,000 +9.0% $1,300,000 +18.2% Jan-2022 $1,630,000 +3.5% $1,070,000 -0.2% Feb-2022 $1,930,000 +17.0% $1,227,500 +2.6% Mar-2022 $2,000,000 +15.9% $1,206,750 -1.2% Apr-2022 $2,050,000 +13.9% $1,365,000 +13.8% May-2022 $2,007,500 +6.4% $1,215,000 -1.0% Jun-2022 $1,865,070 -3.9% $1,240,000 -0.8% Jul-2022 $1,670,000 -9.7% $1,200,000 -0.8% 12-Month Avg* $1,850,000 +8.2% $1,235,000 +3.3% Historical Median Sales Price by Month * Median Sales Price for all properties from August 2021 through July 2022. This is not the average of the individual figures above. Current as of August 11, 2022. All data from the San Francisco Association of REALTORS® MLS. Report © 2022 ShowingTime. | 7 Point at which half of the sales sold for more and half sold for less, not accounting for seller concessions, in a given month. $1,604,000 $1,260,700 $1,850,000 $1,210,000 $1,670,000 $1,200,000 Single Family Condo/TIC/Coop July $500,000 $750,000 $1,000,000 $1,250,000 $1,500,000 $1,750,000 $2,000,000 $2,250,000 1-2005 1-2006 1-2007 1-2008 1-2009 1-2010 1-2011 1-2012 1-2013 1-2014 1-2015 1-2016 1-2017 1-2018 1-2019 1-2020 1-2021 1-2022 Single Family Condo/TIC/Coop $1,609,000 $1,220,000 $1,800,000 $1,200,000 $1,900,000 $1,240,000 Single Family Condo/TIC/Coop Year to Date 2020 2021 2022 - 0.8% - 4.0% - 9.7% + 15.3% - 1.6% + 5.6% + 11.9% + 3.3% 2020 2021 2022 2020 2021 2022 2020 2021 2022 + 3.5% + 0.9% + 1.7% + 5.1%
  • 8. Average Sales Price Average Sales Price Single Family Year-Over-Year Change Condo/TIC/ Coop Year-Over-Year Change Aug-2021 $2,128,296 +7.1% $1,425,053 +7.4% Sep-2021 $2,165,489 +14.2% $1,330,272 +1.9% Oct-2021 $2,359,157 +23.7% $1,456,361 +16.3% Nov-2021 $2,352,770 +15.6% $1,539,719 +21.1% Dec-2021 $2,365,749 +17.5% $1,488,734 +16.1% Jan-2022 $1,977,367 +1.6% $1,311,263 +8.3% Feb-2022 $2,417,245 +7.1% $1,398,389 +4.0% Mar-2022 $2,534,210 +14.4% $1,411,860 +3.1% Apr-2022 $2,515,877 +3.5% $1,466,749 +8.9% May-2022 $2,411,895 -2.7% $1,403,132 +1.7% Jun-2022 $2,356,065 -5.8% $1,366,306 -1.6% Jul-2022 $2,071,125 -9.6% $1,469,174 +8.3% 12-Month Avg* $2,323,938 +7.0% $1,430,149 +7.7% Historical Average Sales Price by Month * Avg. Sales Price for all properties from August 2021 through July 2022. This is not the average of the individual figures above. Current as of August 11, 2022. All data from the San Francisco Association of REALTORS® MLS. Report © 2022 ShowingTime. | 8 Average sales price for all closed sales, not accounting for seller concessions, in a given month. $2,013,417 $1,397,387 $2,292,230 $1,357,053 $2,071,125 $1,469,174 Single Family Condo/TIC/Coop July $500,000 $1,000,000 $1,500,000 $2,000,000 $2,500,000 $3,000,000 1-2005 1-2006 1-2007 1-2008 1-2009 1-2010 1-2011 1-2012 1-2013 1-2014 1-2015 1-2016 1-2017 1-2018 1-2019 1-2020 1-2021 1-2022 Single Family Condo/TIC/Coop $2,051,039 $1,353,553 $2,335,930 $1,350,944 $2,363,930 $1,409,278 Single Family Condo/TIC/Coop Year to Date 2020 2021 2022 + 8.3% - 2.9% - 9.6% + 13.8% - 0.2% + 1.2% + 13.9% + 4.3% 2020 2021 2022 2020 2021 2022 2020 2021 2022 + 5.5% + 2.3% + 1.9% + 8.7%
  • 9. Days on Market Until Sale Days on Market Until Sale Single Family Year-Over-Year Change Condo/TIC/ Coop Year-Over-Year Change Aug-2021 24 0.0% 40 0.0% Sep-2021 22 -12.0% 37 -17.8% Oct-2021 19 -29.6% 34 -17.1% Nov-2021 20 -39.4% 40 -20.0% Dec-2021 30 -14.3% 45 -27.4% Jan-2022 37 +2.8% 62 -11.4% Feb-2022 19 -36.7% 33 -46.8% Mar-2022 15 -34.8% 32 -28.9% Apr-2022 15 -21.1% 29 -35.6% May-2022 20 +11.1% 36 0.0% Jun-2022 16 -5.9% 38 +8.6% Jul-2022 20 +11.1% 48 +20.0% 12-Month Avg* 21 -17.5% 38 -17.5% Historical Days on Market Until Sale by Month * Days on Market for all properties from August 2021 through July 2022. This is not the average of the individual figures above. Current as of August 11, 2022. All data from the San Francisco Association of REALTORS® MLS. Report © 2022 ShowingTime. | 9 Average number of days between when a property is listed and when an offer is accepted in a given month. 25 38 18 40 20 48 Single Family Condo/TIC/Coop July 0 20 40 60 80 100 120 1-2005 1-2006 1-2007 1-2008 1-2009 1-2010 1-2011 1-2012 1-2013 1-2014 1-2015 1-2016 1-2017 1-2018 1-2019 1-2020 1-2021 1-2022 Single Family Condo/TIC/Coop 25 36 22 45 19 37 Single Family Condo/TIC/Coop Year to Date 2020 2021 2022 + 20.0% + 5.3% + 11.1% - 28.0% + 25.0% - 13.6% - 12.0% - 17.8% 2020 2021 2022 2020 2021 2022 2020 2021 2022 + 8.7% - 3.8% 0.0% + 15.2%
  • 10. Inventory of Active Listings Inventory of Active Listings Single Family Year-Over-Year Change Condo/TIC/ Coop Year-Over-Year Change Aug-2021 686 -25.9% 1,475 -30.1% Sep-2021 685 -26.3% 1,619 -30.2% Oct-2021 642 -30.8% 1,557 -33.9% Nov-2021 512 -35.4% 1,362 -35.0% Dec-2021 380 -35.3% 1,019 -32.3% Jan-2022 480 -19.6% 1,222 -23.9% Feb-2022 529 -16.2% 1,378 -13.7% Mar-2022 551 -13.9% 1,411 -11.1% Apr-2022 536 -20.6% 1,443 -5.4% May-2022 518 -19.7% 1,386 -7.8% Jun-2022 477 -25.9% 1,256 -15.6% Jul-2022 393 -39.7% 1,044 -28.5% 12-Month Avg* 532 -26.1% 1,348 -23.5% Historical Inventory of Active Listings by Month * Active Listings for all properties from August 2021 through July 2022. This is not the average of the individual figures above. Current as of August 11, 2022. All data from the San Francisco Association of REALTORS® MLS. Report © 2022 ShowingTime. | 10 The number of properties available for sale in active status at the end of a given month. 862 1,930 652 1,460 393 1,044 Single Family Condo/TIC/Coop July 0 500 1,000 1,500 2,000 2,500 1-2005 1-2006 1-2007 1-2008 1-2009 1-2010 1-2011 1-2012 1-2013 1-2014 1-2015 1-2016 1-2017 1-2018 1-2019 1-2020 1-2021 1-2022 Single Family Condo/TIC/Coop 2020 2021 2022 - 28.5% - 24.4% - 39.7% - 24.4% 2020 2021 2022 + 66.4% + 118.8%
  • 11. % of Properties Sold Over List Price % of Properties Sold Over List Price Single Family Year-Over-Year Change Condo/TIC/ Coop Year-Over-Year Change Aug-2021 84.4% +28.3% 54.6% +59.6% Sep-2021 84.5% +30.0% 54.6% +58.7% Oct-2021 84.5% +25.2% 61.0% +42.5% Nov-2021 79.5% +29.1% 55.6% +69.5% Dec-2021 78.7% +25.1% 46.5% +62.6% Jan-2022 76.0% +31.5% 38.7% +76.7% Feb-2022 86.8% +27.5% 58.4% +65.4% Mar-2022 86.4% +16.6% 58.1% +35.4% Apr-2022 88.7% +16.6% 62.9% +39.2% May-2022 86.9% +9.0% 55.3% +3.4% Jun-2022 86.3% +5.0% 57.7% +6.1% Jul-2022 77.9% -6.7% 40.6% -27.0% 12-Month Avg 83.8% +18.1% 54.8% +31.4% Historical % of Properties Sold Over List Price by Month * % of Properties Sold Over List Price for all properties from August 2021 through July 2022. This is not the average of the individual figures above. Current as of August 11, 2022. All data from the San Francisco Association of REALTORS® MLS. Report © 2022 ShowingTime. | 11 Percentage found when dividing the number of properties sold by properties sold over its original list price, not accounting for seller concessions. 64.7% 44.4% 83.5% 55.6% 77.9% 40.6% Single Family Condo/TIC/Coop July 0.0% 20.0% 40.0% 60.0% 80.0% 100.0% 1-2005 1-2006 1-2007 1-2008 1-2009 1-2010 1-2011 1-2012 1-2013 1-2014 1-2015 1-2016 1-2017 1-2018 1-2019 1-2020 1-2021 1-2022 Single Family Condo/TIC/Coop 66.6% 48.0% 76.1% 45.8% 85.0% 54.8% Single Family Condo/TIC/Coop Year to Date 2020 2021 2022 - 27.0% + 25.2% - 6.7% + 29.1% - 4.6% + 11.7% + 14.3% + 19.7% 2020 2021 2022 2020 2021 2022 2020 2021 2022 - 21.1% - 12.9% - 18.5% - 36.5%
  • 12. % of List Price Received % of List Price Received Single Family Year-Over-Year Change Condo/TIC/ Coop Year-Over-Year Change Aug-2021 116.1% +8.0% 104.3% +3.9% Sep-2021 116.3% +8.9% 105.0% +4.8% Oct-2021 117.0% +8.2% 105.6% +4.2% Nov-2021 114.9% +8.4% 104.6% +4.4% Dec-2021 114.3% +7.8% 103.5% +4.2% Jan-2022 117.7% +11.8% 101.1% +2.4% Feb-2022 121.2% +10.5% 106.1% +5.4% Mar-2022 121.9% +8.6% 106.4% +3.9% Apr-2022 123.1% +8.2% 107.3% +3.5% May-2022 119.6% +2.4% 105.9% +0.7% Jun-2022 116.9% +0.6% 105.3% 0.0% Jul-2022 110.9% -6.4% 101.5% -3.1% 12-Month Avg* 117.5% +6.1% 105.0% +2.7% Historical % of List Price Received by Month * % of List Price Received for all properties from August 2021 through July 2022. This is not the average of the individual figures above. Current as of August 11, 2022. All data from the San Francisco Association of REALTORS® MLS. Report © 2022 ShowingTime. | 12 Percentage found when dividing a property’s sales price by its most recent list price, then taking the average for all properties sold in a given month, not accounting for seller concessions. 106.0% 101.0% 118.5% 104.8% 110.9% 101.5% Single Family Condo/TIC/Coop July 108.4% 102.3% 114.0% 103.4% 119.1% 105.3% Single Family Condo/TIC/Coop Year to Date 90.0% 100.0% 110.0% 120.0% 130.0% 1-2005 1-2006 1-2007 1-2008 1-2009 1-2010 1-2011 1-2012 1-2013 1-2014 1-2015 1-2016 1-2017 1-2018 1-2019 1-2020 1-2021 1-2022 Single Family Condo/TIC/Coop 2020 2021 2022 - 3.1% + 3.8% - 6.4% + 11.8% 2020 2021 2022 - 8.0% - 6.0% 2020 2021 2022 + 1.8% + 1.1% + 4.5% + 5.2% 2020 2021 2022 - 3.6% - 3.0%
  • 13. Housing Affordability Ratio Housing Affordability Ratio Single Family Year-Over-Year Change Condo/TIC/ Coop Year-Over-Year Change Aug-2021 30 -14.3% 57 +1.8% Sep-2021 32 -8.6% 55 -3.5% Oct-2021 31 -13.9% 53 -10.2% Nov-2021 30 -14.3% 54 -8.5% Dec-2021 32 -13.5% 49 -21.0% Jan-2022 32 -11.1% 57 -9.5% Feb-2022 27 -18.2% 49 -7.5% Mar-2022 24 -25.0% 45 -13.5% Apr-2022 21 -32.3% 37 -32.7% May-2022 22 -26.7% 42 -22.2% Jun-2022 23 -17.9% 40 -23.1% Jul-2022 27 -10.0% 43 -20.4% 12-Month Avg* 28 -18.5% 48 -23.8% Historical Housing Affordability Ratio by Month * Affordability Ratio for all properties from August 2021 through July 2022. This is not the average of the individual figures above. Current as of August 11, 2022. All data from the San Francisco Association of REALTORS® MLS. Report © 2022 ShowingTime. | 13 This index measures housing affordability for the region. For example, an index of 120 means the median household income is 120% of what is necessary to qualify for the median-priced home under prevailing interest rates. A higher number means greater affordability. 35 53 30 54 27 43 Single Family Condo/TIC/Coop July 20 40 60 80 100 1-2005 1-2006 1-2007 1-2008 1-2009 1-2010 1-2011 1-2012 1-2013 1-2014 1-2015 1-2016 1-2017 1-2018 1-2019 1-2020 1-2021 1-2022 Single Family Condo/TIC/Coop 2020 2021 2022 - 20.4% + 1.9% - 10.0% - 14.3% 2020 2021 2022 + 6.1% + 6.0% 35 55 31 55 24 42 Single Family Condo/TIC/Coop Year to Date 2020 2021 2022 - 23.6% 0.0% - 22.6% - 11.4% 2020 2021 2022 + 9.4% + 10.0%
  • 14. Months Supply of Inventory Months Supply of Inventory Single Family Year-Over-Year Change Condo/TIC/ Coop Year-Over-Year Change Aug-2021 2.6 -46.9% 4.0 -60.0% Sep-2021 2.6 -45.8% 4.4 -58.5% Oct-2021 2.4 -48.9% 4.2 -60.7% Nov-2021 2.0 -48.7% 3.6 -61.3% Dec-2021 1.5 -46.4% 2.7 -57.1% Jan-2022 1.9 -32.1% 3.3 -49.2% Feb-2022 2.1 -27.6% 3.8 -37.7% Mar-2022 2.2 -21.4% 3.9 -30.4% Apr-2022 2.2 -18.5% 4.1 -14.6% May-2022 2.1 -16.0% 4.1 -6.8% Jun-2022 2.0 -16.7% 3.8 -9.5% Jul-2022 1.7 -32.0% 3.3 -17.5% 12-Month Avg* 2.1 -36.0% 3.8 -45.1% Historical Months Supply of Inventory by Month * Months Supply for all properties from August 2021 through July 2022. This is not the average of the individual figures above. Current as of August 11, 2022. All data from the San Francisco Association of REALTORS® MLS. Report © 2022 ShowingTime. | 14 The inventory of homes for sale at the end of a given month, divided by the average monthly pending sales from the last 12 months. 4.7 9.6 2.5 4.0 1.7 3.3 Single Family Condo/TIC/Coop July 0.0 2.0 4.0 6.0 8.0 10.0 12.0 1-2005 1-2006 1-2007 1-2008 1-2009 1-2010 1-2011 1-2012 1-2013 1-2014 1-2015 1-2016 1-2017 1-2018 1-2019 1-2020 1-2021 1-2022 Single Family Condo/TIC/Coop 2020 2021 2022 - 17.5% - 58.3% - 32.0% - 46.8% 2020 2021 2022 + 88.0% + 159.5%
  • 15. All Properties Activity Overview Key metrics by report month and for year-to-date (YTD) starting from the first of the year. Key Metrics Historical Sparkbars 7-2021 7-2022 Percent Change YTD 2021 YTD 2022 Percent Change - 12.7% Pending Sales 629 392 - 37.7% 4,702 3,703 - 21.2% New Listings 753 430 - 42.9% 5,923 5,170 Sold Listings 632 414 - 34.5% 4,534 3,661 - 19.3% Median Sales Price $1,462,500 $1,443,500 - 1.3% $1,400,000 $1,500,000 + 7.1% + 4.2% 30 - 16.7% $1,803,690 -- -- Days on Market 31 36 + 16.1% 36 Avg. Sales Price $1,735,274 $1,733,562 - 0.1% $1,731,813 Active Listings 2,162 1,473 - 31.9% -- % of Properties Sold Over List Price 66.9% 57.0% - 14.8% 57.5% 38 67.3% + 17.0% + 3.4% 29 - 23.7% 111.0% % of List Price Received 110.3% 105.6% - 4.3% 107.4% Current as of August 11, 2022. All data from the San Francisco Association of REALTORS® MLS. Report © 2022 ShowingTime. | 15 Months Supply 3.4 2.7 - 20.6% -- -- -- Affordability Ratio 38 30 - 21.1% 7-2019 7-2020 7-2021 7-2022 7-2019 7-2020 7-2021 7-2022 7-2019 7-2020 7-2021 7-2022 7-2019 7-2020 7-2021 7-2022 7-2019 7-2020 7-2021 7-2022 7-2019 7-2020 7-2021 7-2022 7-2019 7-2020 7-2021 7-2022 7-2019 7-2020 7-2021 7-2022 7-2019 7-2020 7-2021 7-2022 7-2019 7-2020 7-2021 7-2022 7-2019 7-2020 7-2021 7-2022
  • 16. Activity by District SF District 1: Northwest (Sea Cliff, Lake, Jordan Park / Laurel Heights, Outer Richmond, Central Richmond, Inner Richmond, Lone Mountain) SF District 2: Central West (Outer Sunset, Central Sunset, Inner Sunset, Outer Parkside, Parkside, Inner Parkside, Golden Gate Heights) SF District 3: Southwest (Pine Lake Park, Lake Shore, Merced Manor, Stonestown, Lakeside, Merced Heights, Ingleside, Ingleside Heights, Oceanview) SF District 4: Twin Peaks W (Forest Hill (& Ext), W Portal, St Francis Wd, Balboa Terr, Mt Dav Manor, Ingleside Terr, Monterey Hts, Wstwd Pk & H'lnds, Shrwd Fst, Miraloma Pk, Dmnd Hts, Mdtwn Terr) SF District 5: Central (Haight Ashbury, Cole Vly / Prnssus Hts, Clarndn Hts, Corona Hts, Twin Pks, Glen Pk, Noe Vly, Eureka Vly / Dolores Hts, Mission Dolores, Duboce Trngl, Buena Vista / Ashbury Hts) SF District 6: Central North (Lower Pacific Heights, Anza Vista, Western Addition, North Panhandle, Alamo Square, Hayes Valley) SF District 7: North (Marina, Cow Hollow, Presidio Heights, Pacific Heights) SF District 8: Northeast (North Waterfront, North Beach, Russian Hill, Telegraph Hill, Nob Hill, Financial District / Barbary Coast, Downtown, Van Ness / Civic Center, Tenderloin) SF District 9: Central East (Yerba Buena, South Beach, South of Market, Mission Bay, Inner Mission, Potrero Hill, Central Waterfront / Dogpatch, Bernal Heights) SF District 10: Southeast (Outer Mission, Mission Terr, Excelsior, Portola, Bayview, Silver Terr, Hunters Pt, Candlestick Pt, Bayview Hts, Little Hollywood, Visitation Vly, Crocker Amazon) 7-2021 7-2022 + / – 7-2021 7-2022 + / – 7-2021 7-2022 + / – 7-2021 7-2022 + / – 7-2021 7-2022 + / – Single Family 1 SF District 1 45 29 -35.6% 15 13 -13.3% $2,900,000 $2,410,000 -16.9% 8 16 +100.0% 2.4 1.4 -41.7% 2 SF District 2 83 48 -42.2% 54 41 -24.1% $1,835,000 $1,550,000 -15.5% 10 18 +80.0% 1.8 1.1 -38.9% 3 SF District 3 44 28 -36.4% 14 15 +7.1% $1,600,000 $1,460,000 -8.8% 18 17 -5.6% 2.7 1.7 -37.0% 4 SF District 4 72 54 -25.0% 29 26 -10.3% $1,910,000 $1,940,000 +1.6% 21 17 -19.0% 1.9 1.8 -5.3% 5 SF District 5 121 42 -65.3% 41 27 -34.1% $2,900,000 $2,645,000 -8.8% 17 19 +11.8% 3.0 1.2 -60.0% 6 SF District 6 18 4 -77.8% 5 1 -80.0% $4,750,000 $2,250,000 -52.6% 12 13 +8.3% 3.1 0.9 -71.0% 7 SF District 7 49 20 -59.2% 15 5 -66.7% $4,950,000 $7,030,000 +42.0% 20 16 -20.0% 3.8 2.0 -47.4% 8 SF District 8 22 13 -40.9% 3 3 0.0% $2,850,000 $2,000,000 -29.8% 55 26 -52.7% 9.0 3.7 -58.9% 9 SF District 9 83 50 -39.8% 31 14 -54.8% $1,740,000 $1,727,500 -0.7% 20 23 +15.0% 2.6 2.1 -19.2% 10 SF District 10 115 105 -8.7% 48 36 -25.0% $1,200,000 $1,187,500 -1.0% 26 28 +7.7% 2.3 2.5 +8.7% Condo/TIC/Coop 1 SF District 1 42 31 -26.2% 15 13 -13.3% $1,325,000 $1,510,000 +14.0% 10 22 +120.0% 2.1 2.0 -4.8% 2 SF District 2 16 10 -37.5% 7 2 -71.4% $1,372,500 $1,400,000 +2.0% 30 29 -3.3% 2.3 2.6 +13.0% 3 SF District 3 7 8 +14.3% 2 2 0.0% $710,000 $751,500 +5.8% 19 23 +21.1% 1.6 2.1 +31.3% 4 SF District 4 19 14 -26.3% 5 3 -40.0% $895,000 $610,000 -31.8% 24 49 +104.2% 3.7 2.6 -29.7% 5 SF District 5 152 100 -34.2% 52 35 -32.7% $1,435,000 $1,400,000 -2.4% 22 41 +86.4% 2.6 1.9 -26.9% 6 SF District 6 121 85 -29.8% 38 22 -42.1% $1,262,050 $1,337,500 +6.0% 28 44 +57.1% 2.8 2.4 -14.3% 7 SF District 7 121 73 -39.7% 46 25 -45.7% $1,625,000 $1,450,000 -10.8% 23 34 +47.8% 3.0 2.2 -26.7% 8 SF District 8 296 202 -31.8% 67 43 -35.8% $1,025,000 $1,050,000 +2.4% 44 49 +11.4% 5.0 3.7 -26.0% 9 SF District 9 635 485 -23.6% 130 76 -41.5% $1,126,500 $1,177,500 +4.5% 58 63 +8.6% 5.2 4.7 -9.6% 10 SF District 10 51 36 -29.4% 7 8 +14.3% $785,000 $734,250 -6.5% 71 39 -45.1% 6.3 5.0 -20.6% Key metrics by report month for the districts of San Fransisco. Current as of August 11, 2022. All data from the San Francisco Association of REALTORS® MLS. Report © 2022 ShowingTime. | 16 Active Listings Sold Listings Median Sales Price Days on Market Months Supply