SlideShare ist ein Scribd-Unternehmen logo
1 von 16
Downloaden Sie, um offline zu lesen
January 2022 Monthly Snapshot
One-Year Change in One-Year Change in
Median Sales Price Single
Family
Median Sales Price
Condo/TIC/Coop
2
3
4
5
6
7
8
9
10
11
12
13
14
15
16
Monthly Indicators
+ 4.1% + 2.6% + 10.2%
One-Year Change in
The 2022 real estate market begins where 2021 left off, in which existing home
sales reached their highest level since 2006, with the National Association of
REALTORS® reporting sales were up 8.5% compared to the previous year as
homebuyers rushed to take advantage of historically low mortgage rates. Home
sales would’ve been even greater were it not for soaring sales prices and a
shortage of homes for sale in many markets, forcing a multitude of buyers to
temporarily put their home purchase plans on hold.
New Listings were down 28.4 percent for single family homes and 33.4 percent
for Condo/TIC/Coop properties. Pending Sales decreased 19.4 percent for
single family homes and 16.4 percent for Condo/TIC/Coop properties.
The Median Sales Price was up 4.1 percent to $1,640,000 for single family
homes and 2.6 percent to $1,100,000 for Condo/TIC/Coop properties. Months
Supply of Inventory decreased 53.6 percent for single family units and 60.9
percent for Condo/TIC/Coop units.
For many buyers, 2022 marks a new opportunity to make their home purchase
dreams a reality. But it won’t be without its challenges. Inventory of existing
homes was at 910,000 at the start of the new year, the lowest level recorded
since 1999, according to the National Association of REALTORS®, and
competition remains fierce. Affordability continues to decline, as inflation,
soaring sales prices, and surging mortgage interest rates reduce purchasing
power. The sudden increase in rates and home prices means buyers are paying
significantly more per month compared to this time last year, which may cause
sales to slow as more buyers become priced out of the market.
Median Sales Price
All Property Types
Residential real estate activity in San Francisco County (Districts 1-10)
composed of single-family properties, townhomes and condominiums. Percent
changes are calculated using rounded figures.
Single Family Activity Overview
Months Supply of Inventory
For questions or more information, contact
communications@sfrealtors.com.
Current as of February 11, 2022. All data from the San Francisco Association of REALTORS® MLS. Report © 2021 ShowingTime.
Condo/TIC/Coop Activity Overview
Inventory of Active Listings
% of Properties Sold Over List Price
% of List Price Received
Housing Affordability Ratio
All Properties Activity Overview
New Listings
Pending Sales
Sold Listings
Median Sales Price
Average Sales Price
Days on Market Until Sale
Activity by District
Single Family Activity Overview
Key metrics by report month and for year-to-date (YTD) starting from the first of the year.
Key Metrics Historical Sparkbars 1-2021 1-2022 Percent Change YTD 2021 YTD 2022 Percent Change
Current as of February 11, 2022. All data from the San Francisco Association of REALTORS® MLS. Report © 2021 ShowingTime. | 2
Months Supply 2.8 1.3 - 53.6% -- -- --
Affordability Ratio 36 32 - 11.1%
% of List Price Received 105.3% 117.8% + 11.9% 105.3%
36
76.6% + 32.5%
+ 11.9%
32 - 11.1%
117.8%
% of Properties Sold Over List Price 57.8% 76.6% + 32.5% 57.8%
Active Listings 593 323 - 45.5% --
Avg. Sales Price $1,945,877 $1,986,955 + 2.1% $1,945,877
Days on Market 36 37 + 2.8% 36 37 + 2.8%
$1,986,955
-- --
Median Sales Price $1,575,000 $1,640,000 + 4.1% $1,575,000
Sold Listings 161 128 - 20.5% 161
New Listings 257 184 - 28.4% 257
Pending Sales 170 137 - 19.4% - 19.4%
170 137
- 28.4%
184
128 - 20.5%
$1,640,000 + 4.1%
+ 2.1%
1-2019 1-2020 1-2021 1-2022
1-2019 1-2020 1-2021 1-2022
1-2019 1-2020 1-2021 1-2022
1-2019 1-2020 1-2021 1-2022
1-2019 1-2020 1-2021 1-2022
1-2019 1-2020 1-2021 1-2022
1-2019 1-2020 1-2021 1-2022
1-2019 1-2020 1-2021 1-2022
1-2019 1-2020 1-2021 1-2022
1-2019 1-2020 1-2021 1-2022
1-2019 1-2020 1-2021 1-2022
Condo/TIC/Coop Activity Overview
Key metrics by report month and for year-to-date (YTD) starting from the first of the year.
Key Metrics Historical Sparkbars 1-2021 1-2022 Percent Change YTD 2021 YTD 2022 Percent Change
Current as of February 11, 2022. All data from the San Francisco Association of REALTORS® MLS. Report © 2021 ShowingTime. | 3
Months Supply 6.4 2.5 - 60.9% -- -- --
Affordability Ratio 63 56 - 11.1%
% of List Price Received 98.7% 101.0% + 2.3% 98.7%
63
37.6% + 71.7%
+ 2.3%
56 - 11.1%
101.0%
% of Properties Sold Over List Price 21.9% 37.6% + 71.7% 21.9%
Active Listings 1,597 932 - 41.6% --
Avg. Sales Price $1,211,039 $1,327,055 + 9.6% $1,211,039
Days on Market 70 63 - 10.0% 70
$1,100,000 + 2.6%
+ 9.6%
63 - 10.0%
$1,327,055
-- --
Sold Listings 270 181 - 33.0% 270 181 - 33.0%
Median Sales Price $1,072,500 $1,100,000 + 2.6% $1,072,500
- 33.4%
Pending Sales 292 244 - 16.4% 292 244 - 16.4%
New Listings 530 353 - 33.4% 530 353
1-2019 1-2020 1-2021 1-2022
1-2019 1-2020 1-2021 1-2022
1-2019 1-2020 1-2021 1-2022
1-2019 1-2020 1-2021 1-2022
1-2019 1-2020 1-2021 1-2022
1-2019 1-2020 1-2021 1-2022
1-2019 1-2020 1-2021 1-2022
1-2019 1-2020 1-2021 1-2022
1-2019 1-2020 1-2021 1-2022
1-2019 1-2020 1-2021 1-2022
1-2019 1-2020 1-2021 1-2022
New Listings
estate market
begins where 2021
left off, in which
Single
Family
Year-Over-Year
Change
Condo/TIC/
Coop
Year-Over-Year
Change
Feb-2021 306 +12.5% 502 +23.6%
Mar-2021 345 +98.3% 617 +142.0%
Apr-2021 351 +99.4% 514 +123.5%
May-2021 313 +13.8% 525 +4.2%
Jun-2021 324 -9.7% 493 -14.9%
Jul-2021 300 -26.3% 424 -39.3%
Aug-2021 300 -15.3% 435 -33.3%
Sep-2021 368 +3.7% 576 -13.5%
Oct-2021 261 -29.8% 441 -15.4%
Nov-2021 150 -38.0% 254 -0.4%
Dec-2021 83 -43.9% 166 -32.8%
Jan-2022 184 -28.4% 353 -33.4%
12-Month Avg 274 -3.1% 442 -4.4%
Historical New Listings by Month
Current as of February 11, 2022. All data from the San Francisco Association of REALTORS® MLS. Report © 2021 ShowingTime. | 4
A count of the properties that have been newly listed on the market in a given month.
259
382
257
530
184
353
Single Family Condo/TIC/Coop
January
0
200
400
600
800
1-2005 1-2006 1-2007 1-2008 1-2009 1-2010 1-2011 1-2012 1-2013 1-2014 1-2015 1-2016 1-2017 1-2018 1-2019 1-2020 1-2021 1-2022
Single Family Condo/TIC/Coop
259
382
257
530
184
353
Single Family Condo/TIC/Coop
Year to Date
2020 2021 2022
- 33.4%
+ 38.7%
- 28.4%
- 0.8% + 38.7%
- 28.4%
- 0.8% - 33.4%
2020 2021 2022 2020 2021 2022 2020 2021 2022
+ 6.1% + 6.1% + 3.0%
+ 3.0%
Pending Sales
estate market
begins where 2021
left off, in which
Single
Family
Year-Over-Year
Change
Condo/TIC/
Coop
Year-Over-Year
Change
Feb-2021 225 +52.0% 381 +67.8%
Mar-2021 290 +68.6% 473 +157.1%
Apr-2021 286 +262.0% 478 +419.6%
May-2021 307 +89.5% 462 +225.4%
Jun-2021 275 +21.1% 390 +66.7%
Jul-2021 259 -6.2% 364 +50.4%
Aug-2021 226 -3.8% 316 -1.9%
Sep-2021 332 +18.1% 337 +10.1%
Oct-2021 273 -12.2% 404 +21.3%
Nov-2021 261 -15.0% 360 +20.0%
Dec-2021 129 -37.7% 224 -27.0%
Jan-2022 137 -19.4% 244 -16.4%
12-Month Avg 250 +16.5% 369 +48.7%
Historical Pending Sales by Month
A count of the properties on which offers have been accepted in a given month.
Current as of February 11, 2022. All data from the San Francisco Association of REALTORS® MLS. Report © 2021 ShowingTime. | 5
118
161
170
292
137
244
Single Family Condo/TIC/Coop
January
0
100
200
300
400
500
1-2005 1-2006 1-2007 1-2008 1-2009 1-2010 1-2011 1-2012 1-2013 1-2014 1-2015 1-2016 1-2017 1-2018 1-2019 1-2020 1-2021 1-2022
Single Family Condo/TIC/Coop
118
161
170
292
137
244
Single Family Condo/TIC/Coop
Year to Date
2020 2021 2022
- 16.4%
+ 81.4%
- 19.4%
+ 44.1% + 81.4%
- 19.4%
+ 44.1% - 16.4%
2020 2021 2022 2020 2021 2022 2020 2021 2022
+ 25.5% + 25.5% + 32.0%
+ 32.0%
Sold Listings
estate market
begins where 2021
left off, in which
Single
Family
Year-Over-Year
Change
Condo/TIC/
Coop
Year-Over-Year
Change
Feb-2021 163 +24.4% 278 +56.2%
Mar-2021 270 +50.8% 457 +93.6%
Apr-2021 289 +140.8% 462 +294.9%
May-2021 266 +133.3% 442 +287.7%
Jun-2021 325 +79.6% 471 +166.1%
Jul-2021 255 +7.1% 371 +39.5%
Aug-2021 256 +5.3% 348 +45.0%
Sep-2021 245 -4.7% 291 -9.9%
Oct-2021 310 +1.6% 362 +24.0%
Nov-2021 293 +3.2% 423 +24.0%
Dec-2021 212 -29.8% 322 -8.8%
Jan-2022 128 -20.5% 181 -33.0%
12-Month Avg 251 +19.8% 367 +51.6%
Historical Sold Listings by Month
A count of the actual sales that closed in a given month.
Current as of February 11, 2022. All data from the San Francisco Association of REALTORS® MLS. Report © 2021 ShowingTime. | 6
109
151
161
270
128
181
Single Family Condo/TIC/Coop
January
0
100
200
300
400
500
1-2005 1-2006 1-2007 1-2008 1-2009 1-2010 1-2011 1-2012 1-2013 1-2014 1-2015 1-2016 1-2017 1-2018 1-2019 1-2020 1-2021 1-2022
Single Family Condo/TIC/Coop
109
151
161
270
128
181
Single Family Condo/TIC/Coop
Year to Date
2020 2021 2022
- 33.0%
+ 78.8%
- 20.5%
+ 47.7% + 78.8%
- 20.5%
+ 47.7% - 33.0%
2020 2021 2022 2020 2021 2022 2020 2021 2022
0.0% 0.0% + 25.8%
+ 25.8%
Median Sales Price
estate market
begins where 2021
left off, in which
Single
Family
Year-Over-Year
Change
Condo/TIC/
Coop
Year-Over-Year
Change
Feb-2021 $1,650,000 +2.5% $1,196,500 -5.0%
Mar-2021 $1,725,000 +9.5% $1,221,184 -2.3%
Apr-2021 $1,800,000 +12.1% $1,200,000 -5.9%
May-2021 $1,886,500 +18.8% $1,225,000 +12.6%
Jun-2021 $1,950,000 +12.7% $1,250,000 +2.0%
Jul-2021 $1,850,000 +15.3% $1,208,000 -4.2%
Aug-2021 $1,847,500 +13.7% $1,150,000 -5.0%
Sep-2021 $1,750,000 +6.1% $1,200,000 +2.1%
Oct-2021 $1,805,000 +12.5% $1,247,000 +8.2%
Nov-2021 $1,888,888 +15.4% $1,270,000 +8.4%
Dec-2021 $1,677,500 +8.2% $1,289,500 +17.2%
Jan-2022 $1,640,000 +4.1% $1,100,000 +2.6%
12-Month Avg* $1,810,000 +12.4% $1,220,000 +3.5%
Historical Median Sales Price by Month
Point at which half of the sales sold for more and half sold for less, not accounting for seller concessions, in a given month.
* Median Sales Price for all properties from February 2021 through January 2022. This is not the
average of the individual figures above.
Current as of February 11, 2022. All data from the San Francisco Association of REALTORS® MLS. Report © 2021 ShowingTime. | 7
$1,460,000
$1,155,500
$1,575,000
$1,072,500
$1,640,000
$1,100,000
Single Family Condo/TIC/Coop
January
$500,000
$750,000
$1,000,000
$1,250,000
$1,500,000
$1,750,000
$2,000,000
$2,250,000
1-2005 1-2006 1-2007 1-2008 1-2009 1-2010 1-2011 1-2012 1-2013 1-2014 1-2015 1-2016 1-2017 1-2018 1-2019 1-2020 1-2021 1-2022
Single Family Condo/TIC/Coop
$1,460,000
$1,155,500
$1,575,000
$1,072,500
$1,640,000
$1,100,000
Single Family Condo/TIC/Coop
Year to Date
2020 2021 2022
+ 2.6%
- 7.2%
+ 4.1%
+ 7.9% - 7.2%
+ 4.1%
+ 7.9% + 2.6%
2020 2021 2022 2020 2021 2022 2020 2021 2022
+ 10.2% + 10.2% + 10.0%
+ 10.0%
Average Sales Price
estate market
begins where 2021
left off, in which
Single
Family
Year-Over-Year
Change
Condo/TIC/
Coop
Year-Over-Year
Change
Feb-2021 $2,257,454 +18.2% $1,344,643 -0.5%
Mar-2021 $2,214,726 +9.2% $1,369,434 +0.2%
Apr-2021 $2,430,795 +11.3% $1,347,315 -0.0%
May-2021 $2,479,992 +32.1% $1,369,209 +9.4%
Jun-2021 $2,504,876 +13.8% $1,388,929 -1.9%
Jul-2021 $2,292,230 +13.8% $1,355,128 -3.0%
Aug-2021 $2,128,296 +7.1% $1,425,053 +7.4%
Sep-2021 $2,165,489 +14.2% $1,330,272 +1.9%
Oct-2021 $2,359,157 +23.7% $1,460,761 +16.6%
Nov-2021 $2,359,605 +15.9% $1,543,572 +21.4%
Dec-2021 $2,373,627 +17.9% $1,467,566 +14.5%
Jan-2022 $1,986,955 +2.1% $1,327,055 +9.6%
12-Month Avg* $2,318,178 +16.2% $1,397,853 +6.8%
Historical Average Sales Price by Month
Average sales price for all closed sales, not accounting for seller concessions, in a given month.
* Avg. Sales Price for all properties from February 2021 through January 2022. This is not the
average of the individual figures above.
Current as of February 11, 2022. All data from the San Francisco Association of REALTORS® MLS. Report © 2021 ShowingTime. | 8
$2,126,757
$1,268,267
$1,945,877
$1,211,039
$1,986,955
$1,327,055
Single Family Condo/TIC/Coop
January
$500,000
$1,000,000
$1,500,000
$2,000,000
$2,500,000
$3,000,000
1-2005 1-2006 1-2007 1-2008 1-2009 1-2010 1-2011 1-2012 1-2013 1-2014 1-2015 1-2016 1-2017 1-2018 1-2019 1-2020 1-2021 1-2022
Single Family Condo/TIC/Coop
$2,126,757
$1,268,267
$1,945,877
$1,211,039
$1,986,955
$1,327,055
Single Family Condo/TIC/Coop
Year to Date
2020 2021 2022
+ 9.6%
- 4.5%
+ 2.1%
- 8.5% - 4.5%
+ 2.1%
- 8.5% + 9.6%
2020 2021 2022 2020 2021 2022 2020 2021 2022
+ 27.0% + 27.0% + 8.8%
+ 8.8%
Days on Market Until Sale
estate market
begins where 2021
left off, in which
Single
Family
Year-Over-Year
Change
Condo/TIC/
Coop
Year-Over-Year
Change
Feb-2021 30 +20.0% 62 +121.4%
Mar-2021 23 +9.5% 45 +66.7%
Apr-2021 19 -5.0% 45 +40.6%
May-2021 18 -25.0% 36 -10.0%
Jun-2021 17 -34.6% 35 +2.9%
Jul-2021 18 -28.0% 40 +5.3%
Aug-2021 24 0.0% 40 0.0%
Sep-2021 22 -12.0% 37 -17.8%
Oct-2021 19 -29.6% 34 -17.1%
Nov-2021 20 -39.4% 40 -20.0%
Dec-2021 29 -17.1% 45 -27.4%
Jan-2022 37 +2.8% 63 -10.0%
12-Month Avg* 22 -20.4% 42 -5.8%
Historical Days on Market Until Sale by Month
Average number of days between when a property is listed and when an offer is accepted in a given month.
* Days on Market for all properties from February 2021 through January 2022. This is not the
average of the individual figures above.
Current as of February 11, 2022. All data from the San Francisco Association of REALTORS® MLS. Report © 2021 ShowingTime. | 9
36
61
36
70
37
63
Single Family Condo/TIC/Coop
January
0
20
40
60
80
100
120
1-2005 1-2006 1-2007 1-2008 1-2009 1-2010 1-2011 1-2012 1-2013 1-2014 1-2015 1-2016 1-2017 1-2018 1-2019 1-2020 1-2021 1-2022
Single Family Condo/TIC/Coop
36
61
36
70
37
63
Single Family Condo/TIC/Coop
Year to Date
2020 2021 2022
- 10.0%
+ 14.8%
+ 2.8%
0.0% + 14.8%
+ 2.8%
0.0% - 10.0%
2020 2021 2022 2020 2021 2022 2020 2021 2022
- 10.0% - 10.0% + 7.0%
+ 7.0%
Inventory of Active Listings
estate market
begins where 2021
left off, in which
Single
Family
Year-Over-Year
Change
Condo/TIC/
Coop
Year-Over-Year
Change
Feb-2021 627 +7.4% 1,587 +60.3%
Mar-2021 633 +14.9% 1,576 +58.1%
Apr-2021 666 +9.5% 1,515 +41.5%
May-2021 635 -7.7% 1,490 +11.0%
Jun-2021 633 -19.2% 1,470 -6.2%
Jul-2021 637 -25.9% 1,438 -25.5%
Aug-2021 668 -27.7% 1,449 -31.3%
Sep-2021 657 -29.3% 1,581 -31.8%
Oct-2021 601 -35.2% 1,498 -36.3%
Nov-2021 457 -42.3% 1,279 -38.9%
Dec-2021 299 -48.9% 886 -41.0%
Jan-2022 323 -45.5% 932 -41.6%
12-Month Avg* 570 -22.5% 1,392 -15.9%
Historical Inventory of Active Listings by Month
The number of properties available for sale in active status at the end of a given month.
* Active Listings for all properties from February 2021 through January 2022. This is not the
average of the individual figures above.
Current as of February 11, 2022. All data from the San Francisco Association of REALTORS® MLS. Report © 2021 ShowingTime. | 10
490
870
593
1,597
323
932
Single Family Condo/TIC/Coop
January
0
500
1,000
1,500
2,000
2,500
1-2005 1-2006 1-2007 1-2008 1-2009 1-2010 1-2011 1-2012 1-2013 1-2014 1-2015 1-2016 1-2017 1-2018 1-2019 1-2020 1-2021 1-2022
Single Family Condo/TIC/Coop
2020 2021 2022
- 41.6%
+ 83.6%
- 45.5%
+ 21.0%
2020 2021 2022
- 7.2% + 6.2%
% of Properties Sold Over List Price
estate market
begins where 2021
left off, in which
Single
Family
Year-Over-Year
Change
Condo/TIC/
Coop
Year-Over-Year
Change
Feb-2021 68.1% -7.1% 35.3% -44.4%
Mar-2021 74.1% -5.2% 42.9% -28.7%
Apr-2021 76.1% +8.7% 45.0% -24.7%
May-2021 79.7% +26.1% 53.6% +27.3%
Jun-2021 82.5% +49.5% 54.4% +74.9%
Jul-2021 83.5% +29.1% 55.8% +25.7%
Aug-2021 84.4% +28.3% 54.6% +59.6%
Sep-2021 84.5% +30.0% 54.6% +58.7%
Oct-2021 84.5% +25.2% 61.0% +42.5%
Nov-2021 79.5% +29.1% 55.3% +68.6%
Dec-2021 79.7% +26.7% 46.6% +62.9%
Jan-2022 76.6% +32.5% 37.6% +71.7%
12-Month Avg 80.0% +22.9% 50.5% +29.1%
Historical % of Properties Sold Over List Price by Month
Percentage found when dividing the number of properties sold by properties sold over its original list price, not accounting for seller
concessions.
* % of Properties Sold Over List Price for all properties from February 2021 through January
2022. This is not the average of the individual figures above.
Current as of February 11, 2022. All data from the San Francisco Association of REALTORS® MLS. Report © 2021 ShowingTime. | 11
62.6%
32.5%
57.8%
21.9%
76.6%
37.6%
Single Family Condo/TIC/Coop
January
0.0%
20.0%
40.0%
60.0%
80.0%
100.0%
1-2005 1-2006 1-2007 1-2008 1-2009 1-2010 1-2011 1-2012 1-2013 1-2014 1-2015 1-2016 1-2017 1-2018 1-2019 1-2020 1-2021 1-2022
Single Family Condo/TIC/Coop
62.6%
32.5%
57.8%
21.9%
76.6%
37.6%
Single Family Condo/TIC/Coop
Year to Date
2020 2021 2022
+ 71.7%
- 32.6%
+ 32.5%
- 7.7% - 32.6%
+ 32.5%
- 7.7% + 71.7%
2020 2021 2022 2020 2021 2022 2020 2021 2022
+ 3.3% + 3.3% - 20.3%
- 20.3%
% of List Price Received
estate market
begins where 2021
left off, in which
Single
Family
Year-Over-Year
Change
Condo/TIC/
Coop
Year-Over-Year
Change
Feb-2021 109.7% -1.7% 100.7% -4.3%
Mar-2021 112.2% -1.7% 102.4% -1.6%
Apr-2021 113.8% +4.6% 103.7% -1.5%
May-2021 116.8% +10.4% 105.2% +4.8%
Jun-2021 116.3% +10.1% 105.3% +5.4%
Jul-2021 118.5% +11.8% 104.8% +3.8%
Aug-2021 116.1% +8.0% 104.3% +3.9%
Sep-2021 116.3% +8.9% 105.0% +4.8%
Oct-2021 117.0% +8.2% 105.5% +4.1%
Nov-2021 114.9% +8.4% 104.6% +4.4%
Dec-2021 114.5% +8.0% 103.5% +4.2%
Jan-2022 117.8% +11.9% 101.0% +2.3%
12-Month Avg* 115.4% +7.5% 104.0% +3.0%
Historical % of List Price Received by Month
Percentage found when dividing a property’s sales price by its most recent list price, then taking the average for all properties sold in a given
month, not accounting for seller concessions.
* % of List Price Received for all properties from February 2021 through January 2022. This is not
the average of the individual figures above.
Current as of February 11, 2022. All data from the San Francisco Association of REALTORS® MLS. Report © 2021 ShowingTime. | 12
107.0%
100.4%
105.3%
98.7%
117.8%
101.0%
Single Family Condo/TIC/Coop
January
107.0%
100.4%
105.3%
98.7%
117.8%
101.0%
Single Family Condo/TIC/Coop
Year to Date
90.0%
100.0%
110.0%
120.0%
130.0%
1-2005 1-2006 1-2007 1-2008 1-2009 1-2010 1-2011 1-2012 1-2013 1-2014 1-2015 1-2016 1-2017 1-2018 1-2019 1-2020 1-2021 1-2022
Single Family Condo/TIC/Coop
2020 2021 2022
+ 2.3%
- 1.7%
+ 11.9%
- 1.6%
2020 2021 2022
+ 1.2% - 0.7%
2020 2021 2022
+ 2.3%
- 1.7%
+ 11.9%
- 1.6%
2020 2021 2022
+ 1.2% - 0.7%
Housing Affordability Ratio
estate market
begins where 2021
left off, in which
Single
Family
Year-Over-Year
Change
Condo/TIC/
Coop
Year-Over-Year
Change
Feb-2021 33 -2.9% 53 +3.9%
Mar-2021 32 -3.0% 52 +6.1%
Apr-2021 31 -8.8% 55 +7.8%
May-2021 30 -14.3% 54 -8.5%
Jun-2021 28 -12.5% 52 -3.7%
Jul-2021 30 -14.3% 55 +3.8%
Aug-2021 30 -14.3% 57 +1.8%
Sep-2021 32 -8.6% 55 -3.5%
Oct-2021 31 -13.9% 53 -10.2%
Nov-2021 30 -14.3% 53 -10.2%
Dec-2021 32 -13.5% 49 -21.0%
Jan-2022 32 -11.1% 56 -11.1%
12-Month Avg* 31 -8.0% 35 -0.2%
Historical Housing Affordability Ratio by Month
This index measures housing affordability for the region. For example, an index of 120 means the median household income is 120% of what is
necessary to qualify for the median-priced home under prevailing interest rates. A higher number means greater affordability.
* Affordability Ratio for all properties from February 2021 through January 2022. This is not the
average of the individual figures above.
Current as of February 11, 2022. All data from the San Francisco Association of REALTORS® MLS. Report © 2021 ShowingTime. | 13
37
55
36
63
32
56
Single Family Condo/TIC/Coop
January
20
40
60
80
100
1-2005 1-2006 1-2007 1-2008 1-2009 1-2010 1-2011 1-2012 1-2013 1-2014 1-2015 1-2016 1-2017 1-2018 1-2019 1-2020 1-2021 1-2022
Single Family Condo/TIC/Coop
2020 2021 2022
- 11.1%
+ 14.5%
- 11.1%
- 2.7%
2020 2021 2022
0.0% + 1.9%
37
55
36
63
32
56
Single Family Condo/TIC/Coop
Year to Date
2020 2021 2022
- 11.1%
+ 14.5%
- 11.1%
- 2.7%
2020 2021 2022
0.0% + 1.9%
Months Supply of Inventory
estate market
begins where 2021
left off, in which
Single
Family
Year-Over-Year
Change
Condo/TIC/
Coop
Year-Over-Year
Change
Feb-2021 2.8 -3.4% 6.1 +52.5%
Mar-2021 2.7 -3.6% 5.5 +31.0%
Apr-2021 2.7 -18.2% 4.8 -2.0%
May-2021 2.4 -38.5% 4.3 -35.8%
Jun-2021 2.4 -45.5% 4.1 -47.4%
Jul-2021 2.4 -48.9% 3.9 -58.9%
Aug-2021 2.5 -49.0% 4.0 -60.0%
Sep-2021 2.5 -47.9% 4.3 -59.4%
Oct-2021 2.3 -51.1% 4.0 -62.6%
Nov-2021 1.8 -53.8% 3.4 -63.4%
Dec-2021 1.2 -57.1% 2.4 -61.9%
Jan-2022 1.3 -53.6% 2.5 -60.9%
12-Month Avg* 2.3 -40.9% 4.1 -45.7%
Historical Months Supply of Inventory by Month
The inventory of homes for sale at the end of a given month, divided by the average monthly pending sales from the last 12 months.
* Months Supply for all properties from February 2021 through January 2022. This is not the
average of the individual figures above.
Current as of February 11, 2022. All data from the San Francisco Association of REALTORS® MLS. Report © 2021 ShowingTime. | 14
2.4
3.5
2.8
6.4
1.3
2.5
Single Family Condo/TIC/Coop
January
0.0
2.0
4.0
6.0
8.0
10.0
12.0
1-2005 1-2006 1-2007 1-2008 1-2009 1-2010 1-2011 1-2012 1-2013 1-2014 1-2015 1-2016 1-2017 1-2018 1-2019 1-2020 1-2021 1-2022
Single Family Condo/TIC/Coop
2020 2021 2022
- 60.9%
+ 82.9%
- 53.6%
+ 16.7%
2020 2021 2022
- 4.0% + 6.1%
All Properties Activity Overview
Key metrics by report month and for year-to-date (YTD) starting from the first of the year.
Key Metrics Historical Sparkbars 1-2021 1-2022 Percent Change YTD 2021 YTD 2022 Percent Change
Current as of February 11, 2022. All data from the San Francisco Association of REALTORS® MLS. Report © 2021 ShowingTime. | 15
Months Supply 4.7 2.1 - 55.3% -- -- --
Affordability Ratio 46 39 - 15.2%
% of List Price Received 101.1% 107.9% + 6.7% 101.1%
46
53.7% + 51.7%
+ 6.7%
39 - 15.2%
107.9%
% of Properties Sold Over List Price 35.4% 53.7% + 51.7% 35.4%
Active Listings 2,223 1,288 - 42.1% --
Avg. Sales Price $1,499,223 $1,595,807 + 6.4% $1,499,223
Days on Market 58 52 - 10.3% 58
$1,350,000 + 10.2%
+ 6.4%
52 - 10.3%
$1,595,807
-- --
Sold Listings 443 315 - 28.9% 443 315 - 28.9%
Median Sales Price $1,225,000 $1,350,000 + 10.2% $1,225,000
- 32.0%
Pending Sales 474 385 - 18.8% 474 385 - 18.8%
New Listings 794 540 - 32.0% 794 540
1-2019 1-2020 1-2021 1-2022
1-2019 1-2020 1-2021 1-2022
1-2019 1-2020 1-2021 1-2022
1-2019 1-2020 1-2021 1-2022
1-2019 1-2020 1-2021 1-2022
1-2019 1-2020 1-2021 1-2022
1-2019 1-2020 1-2021 1-2022
1-2019 1-2020 1-2021 1-2022
1-2019 1-2020 1-2021 1-2022
1-2019 1-2020 1-2021 1-2022
1-2019 1-2020 1-2021 1-2022
Activity by District
SF District 1: Northwest (Sea Cliff, Lake, Jordan Park / Laurel Heights, Outer Richmond, Central Ric The 2022
SF District 2: Central West (Outer Sunset, Central Sunset, Inner Sunset, Outer Parkside, Parkside, Inner Parkside, Golden Gate Heights)
SF District 3: Southwest (Pine Lake Park, Lake Shore, Merced Manor, Stonestown, Lakeside, Merced Heights, Ingleside, Ingleside Heights, Oceanview)
SF District 4: Twin Peaks W (Forest Hill (& Ext), W Portal, St Francis Wd, Balboa Terr, Mt Dav Manor, Ingleside Terr, Monterey Hts, Wstwd Pk & H'lnds, Shrwd Fst, Miraloma Pk, Dmnd Hts, Mdtwn Terr)
SF District 5: Central (Haight Ashbury, Cole Vly / Prnssus Hts, Clarndn Hts, Corona Hts, Twin Pks, Glen Pk, Noe Vly, Eureka Vly / Dolores Hts, Mission Dolores, Duboce Trngl, Buena Vista / Ashbury Hts)
SF District 6: Central North (Lower Pacific Heights, Anza Vista, Western Addition, North Panhandle, Alamo Square, Hayes Valley)
SF District 7: North (Marina, Cow Hollow, Presidio Heights, Pacific Heights)
SF District 8: Northeast (North Waterfront, North Beach, Russian Hill, Telegraph Hill, Nob Hill, Financial District / Barbary Coast, Downtown, Van Ness / Civic Center, Tenderloin)
SF District 9: Central East (Yerba Buena, South Beach, South of Market, Mission Bay, Inner Mission, Potrero Hill, Central Waterfront / Dogpatch, Bernal Heights)
SF District 10: Southeast (Outer Mission, Mission Terr, Excelsior, Portola, Bayview, Silver Terr, Hunters Pt, Candlestick Pt, Bayview Hts, Little Hollywood, Visitation Vly, Crocker Amazon)
1-2021 1-2022 + / – 1-2021 1-2022 + / – 1-2021 1-2022 + / – 1-2021 1-2022 + / – 1-2021 1-2022 + / –
Single Family
1 SF District 1 32 30 -6.3% 9 15 +66.7% $1,800,000 $2,350,000 +30.6% 42 17 -59.5% 1.7 1.5 -11.8%
2 SF District 2 58 34 -41.4% 25 22 -12.0% $1,550,000 $1,615,000 +4.2% 29 37 +27.6% 1.6 0.7 -56.3%
3 SF District 3 36 22 -38.9% 10 10 0.0% $1,465,908 $1,319,000 -10.0% 54 41 -24.1% 2.6 1.3 -50.0%
4 SF District 4 53 26 -50.9% 30 12 -60.0% $1,875,000 $1,766,500 -5.8% 26 27 +3.8% 1.7 0.7 -58.8%
5 SF District 5 110 41 -62.7% 14 10 -28.6% $2,437,500 $2,475,000 +1.5% 44 48 +9.1% 3.4 1.1 -67.6%
6 SF District 6 16 8 -50.0% 4 8 +100.0% $2,080,000 $2,827,500 +35.9% 37 47 +27.0% 3.1 1.7 -45.2%
7 SF District 7 58 36 -37.9% 6 3 -50.0% $3,500,000 $4,200,000 +20.0% 44 61 +38.6% 7.5 2.8 -62.7%
8 SF District 8 19 21 +10.5% 5 3 -40.0% $2,360,000 $3,637,500 +54.1% 62 172 +177.4% 8.1 7.3 -9.9%
9 SF District 9 99 47 -52.5% 17 14 -17.6% $1,540,000 $1,955,000 +26.9% 44 15 -65.9% 4.0 1.7 -57.5%
10 SF District 10 112 58 -48.2% 41 31 -24.4% $1,020,000 $1,180,000 +15.7% 32 38 +18.8% 2.6 1.3 -50.0%
Condo/TIC/Coop
1 SF District 1 63 32 -49.2% 13 7 -46.2% $1,299,900 $1,250,000 -3.8% 42 28 -33.3% 4.1 1.8 -56.1%
2 SF District 2 14 14 0.0% 4 2 -50.0% $839,500 $1,348,000 +60.6% 135 38 -71.9% 2.5 2.7 +8.0%
3 SF District 3 12 2 -83.3% 3 4 +33.3% $770,000 $797,500 +3.6% 63 41 -34.9% 4.3 0.5 -88.4%
4 SF District 4 16 14 -12.5% 5 5 0.0% $855,125 $550,000 -35.7% 85 76 -10.6% 3.5 2.8 -20.0%
5 SF District 5 154 75 -51.3% 49 19 -61.2% $1,200,000 $1,400,000 +16.7% 55 40 -27.3% 3.5 1.4 -60.0%
6 SF District 6 129 89 -31.0% 34 22 -35.3% $1,140,000 $1,150,000 +0.9% 67 49 -26.9% 4.5 2.2 -51.1%
7 SF District 7 152 54 -64.5% 22 21 -4.5% $1,187,500 $1,500,000 +26.3% 60 73 +21.7% 5.6 1.3 -76.8%
8 SF District 8 322 192 -40.4% 43 35 -18.6% $1,075,000 $958,500 -10.8% 92 64 -30.4% 8.5 3.0 -64.7%
9 SF District 9 690 419 -39.3% 87 63 -27.6% $960,000 $1,050,000 +9.4% 70 74 +5.7% 8.7 3.3 -62.1%
10 SF District 10 45 41 -8.9% 10 3 -70.0% $710,000 $785,000 +10.6% 83 91 +9.6% 7.8 5.0 -35.9%
Key metrics by report month for the districts of San Fransisco.
Current as of February 11, 2022. All data from the San Francisco Association of REALTORS® MLS. Report © 2021 ShowingTime. | 16
Active Listings Sold Listings Median Sales Price Days on Market Months Supply

Weitere ähnliche Inhalte

Was ist angesagt?

San Francisco Market Report May 2021
San Francisco Market Report May 2021San Francisco Market Report May 2021
San Francisco Market Report May 2021Ronny Budiutama
 
San Francisco Market Report April 2021
San Francisco Market Report April 2021San Francisco Market Report April 2021
San Francisco Market Report April 2021Ronny Budiutama
 
San Francisco Market Report March 2021
San Francisco Market Report March 2021San Francisco Market Report March 2021
San Francisco Market Report March 2021Ronny Budiutama
 
San Francisco market focus report December 2019
San Francisco market focus report December 2019San Francisco market focus report December 2019
San Francisco market focus report December 2019Ronny Budiutama
 
San Francisco Market Report January 2021
San Francisco Market Report January 2021San Francisco Market Report January 2021
San Francisco Market Report January 2021Ronny Budiutama
 
San Francisco Market Focus February 2014
San Francisco Market Focus February 2014San Francisco Market Focus February 2014
San Francisco Market Focus February 2014Ronny Budiutama
 
2013 Annual Historical Data
2013 Annual Historical Data2013 Annual Historical Data
2013 Annual Historical DataRonny Budiutama
 
San Francisco Market Focus December 2013
San Francisco Market Focus December 2013San Francisco Market Focus December 2013
San Francisco Market Focus December 2013Ronny Budiutama
 
Gbar monthly-market-insight-report-jan20
Gbar monthly-market-insight-report-jan20Gbar monthly-market-insight-report-jan20
Gbar monthly-market-insight-report-jan20Joe Schutt
 
San Francisco Market Focus Report Nov 2020
San Francisco Market Focus Report Nov 2020San Francisco Market Focus Report Nov 2020
San Francisco Market Focus Report Nov 2020Ronny Budiutama
 
Victoria Real Estate Board Statistics Package January 2022
Victoria Real Estate Board Statistics Package January 2022Victoria Real Estate Board Statistics Package January 2022
Victoria Real Estate Board Statistics Package January 2022VickyAulakh1
 
Real Estate Board of Greater Vancouver Statistics Package February 2022
Real Estate Board of Greater Vancouver Statistics Package February 2022Real Estate Board of Greater Vancouver Statistics Package February 2022
Real Estate Board of Greater Vancouver Statistics Package February 2022Vicky Aulakh
 
San Francisco Market Focus Report Jan 2020
San Francisco Market Focus Report Jan 2020San Francisco Market Focus Report Jan 2020
San Francisco Market Focus Report Jan 2020Ronny Budiutama
 
San francisco residential apr 2011 apr 2013
San francisco residential apr 2011   apr 2013San francisco residential apr 2011   apr 2013
San francisco residential apr 2011 apr 2013Ronny Budiutama
 
San Francisco Market Data October 2020
San Francisco Market Data October 2020San Francisco Market Data October 2020
San Francisco Market Data October 2020Ronny Budiutama
 
Gbar monthly-market-insights-report-november20
Gbar monthly-market-insights-report-november20Gbar monthly-market-insights-report-november20
Gbar monthly-market-insights-report-november20Joe Schutt
 
San Francisco Market Focus April 2018
San Francisco Market Focus April 2018San Francisco Market Focus April 2018
San Francisco Market Focus April 2018Ronny Budiutama
 
San Francisco Market Focus Report Aug 2018
San Francisco Market Focus Report Aug 2018San Francisco Market Focus Report Aug 2018
San Francisco Market Focus Report Aug 2018Ronny Budiutama
 
San Francisco market report September 2020
San Francisco market report September 2020San Francisco market report September 2020
San Francisco market report September 2020Ronny Budiutama
 
San Francisco Market Focus August 2013
San Francisco Market Focus August 2013San Francisco Market Focus August 2013
San Francisco Market Focus August 2013Ronny Budiutama
 

Was ist angesagt? (20)

San Francisco Market Report May 2021
San Francisco Market Report May 2021San Francisco Market Report May 2021
San Francisco Market Report May 2021
 
San Francisco Market Report April 2021
San Francisco Market Report April 2021San Francisco Market Report April 2021
San Francisco Market Report April 2021
 
San Francisco Market Report March 2021
San Francisco Market Report March 2021San Francisco Market Report March 2021
San Francisco Market Report March 2021
 
San Francisco market focus report December 2019
San Francisco market focus report December 2019San Francisco market focus report December 2019
San Francisco market focus report December 2019
 
San Francisco Market Report January 2021
San Francisco Market Report January 2021San Francisco Market Report January 2021
San Francisco Market Report January 2021
 
San Francisco Market Focus February 2014
San Francisco Market Focus February 2014San Francisco Market Focus February 2014
San Francisco Market Focus February 2014
 
2013 Annual Historical Data
2013 Annual Historical Data2013 Annual Historical Data
2013 Annual Historical Data
 
San Francisco Market Focus December 2013
San Francisco Market Focus December 2013San Francisco Market Focus December 2013
San Francisco Market Focus December 2013
 
Gbar monthly-market-insight-report-jan20
Gbar monthly-market-insight-report-jan20Gbar monthly-market-insight-report-jan20
Gbar monthly-market-insight-report-jan20
 
San Francisco Market Focus Report Nov 2020
San Francisco Market Focus Report Nov 2020San Francisco Market Focus Report Nov 2020
San Francisco Market Focus Report Nov 2020
 
Victoria Real Estate Board Statistics Package January 2022
Victoria Real Estate Board Statistics Package January 2022Victoria Real Estate Board Statistics Package January 2022
Victoria Real Estate Board Statistics Package January 2022
 
Real Estate Board of Greater Vancouver Statistics Package February 2022
Real Estate Board of Greater Vancouver Statistics Package February 2022Real Estate Board of Greater Vancouver Statistics Package February 2022
Real Estate Board of Greater Vancouver Statistics Package February 2022
 
San Francisco Market Focus Report Jan 2020
San Francisco Market Focus Report Jan 2020San Francisco Market Focus Report Jan 2020
San Francisco Market Focus Report Jan 2020
 
San francisco residential apr 2011 apr 2013
San francisco residential apr 2011   apr 2013San francisco residential apr 2011   apr 2013
San francisco residential apr 2011 apr 2013
 
San Francisco Market Data October 2020
San Francisco Market Data October 2020San Francisco Market Data October 2020
San Francisco Market Data October 2020
 
Gbar monthly-market-insights-report-november20
Gbar monthly-market-insights-report-november20Gbar monthly-market-insights-report-november20
Gbar monthly-market-insights-report-november20
 
San Francisco Market Focus April 2018
San Francisco Market Focus April 2018San Francisco Market Focus April 2018
San Francisco Market Focus April 2018
 
San Francisco Market Focus Report Aug 2018
San Francisco Market Focus Report Aug 2018San Francisco Market Focus Report Aug 2018
San Francisco Market Focus Report Aug 2018
 
San Francisco market report September 2020
San Francisco market report September 2020San Francisco market report September 2020
San Francisco market report September 2020
 
San Francisco Market Focus August 2013
San Francisco Market Focus August 2013San Francisco Market Focus August 2013
San Francisco Market Focus August 2013
 

Ähnlich wie San Francisco Market Report January 2022

San Francisco Market Report February 2022
San Francisco Market Report February 2022San Francisco Market Report February 2022
San Francisco Market Report February 2022Ronny Budiutama
 
San Francisco Market Report April 2022.pdf
San Francisco Market Report April 2022.pdfSan Francisco Market Report April 2022.pdf
San Francisco Market Report April 2022.pdfRonny Budiutama
 
San Francisco Market Report May 2022.
San Francisco Market Report May 2022.San Francisco Market Report May 2022.
San Francisco Market Report May 2022.Ronny Budiutama
 
San Francisco Market Report March 2022
San Francisco Market Report March 2022San Francisco Market Report March 2022
San Francisco Market Report March 2022Ronny Budiutama
 
San Francisco Market Report June 2022.pdf
San Francisco Market Report June 2022.pdfSan Francisco Market Report June 2022.pdf
San Francisco Market Report June 2022.pdfRonny Budiutama
 
San Francisco Market Report July 2022.pdf
San Francisco Market Report July 2022.pdfSan Francisco Market Report July 2022.pdf
San Francisco Market Report July 2022.pdfRonny Budiutama
 
San Francisco Market Report October 2022.pdf
San Francisco Market Report October 2022.pdfSan Francisco Market Report October 2022.pdf
San Francisco Market Report October 2022.pdfRonny Budiutama
 
San Francisco Market Report November 2022.pdf
San Francisco Market Report November 2022.pdfSan Francisco Market Report November 2022.pdf
San Francisco Market Report November 2022.pdfRonny Budiutama
 
San Francisco Market Report December 2022.pdf
San Francisco Market Report December 2022.pdfSan Francisco Market Report December 2022.pdf
San Francisco Market Report December 2022.pdfRonny Budiutama
 
San Francisco Market Report August 2022.pdf
San Francisco Market Report August 2022.pdfSan Francisco Market Report August 2022.pdf
San Francisco Market Report August 2022.pdfRonny Budiutama
 
San Francisco Market Report September 2022.pdf
San Francisco Market Report September 2022.pdfSan Francisco Market Report September 2022.pdf
San Francisco Market Report September 2022.pdfRonny Budiutama
 
San Francisco Market Report February 2023
San Francisco Market Report February 2023San Francisco Market Report February 2023
San Francisco Market Report February 2023Ronny Budiutama
 
San Francisco Market Report January 2023.pdf
San Francisco Market Report January 2023.pdfSan Francisco Market Report January 2023.pdf
San Francisco Market Report January 2023.pdfRonny Budiutama
 
San Francisco January 2024 Market Report
San Francisco January 2024 Market ReportSan Francisco January 2024 Market Report
San Francisco January 2024 Market ReportRonny Budiutama
 
San Francisco December 2023 Market Report
San Francisco December 2023 Market ReportSan Francisco December 2023 Market Report
San Francisco December 2023 Market ReportRonny Budiutama
 
San Francisco May 2023 Market Report.pdf
San Francisco May 2023 Market Report.pdfSan Francisco May 2023 Market Report.pdf
San Francisco May 2023 Market Report.pdfRonny Budiutama
 
San Francisco June 2023 Market Report.pdf
San Francisco June 2023 Market Report.pdfSan Francisco June 2023 Market Report.pdf
San Francisco June 2023 Market Report.pdfRonny Budiutama
 
San Francisco Market Report March 2023.pdf
San Francisco Market Report March 2023.pdfSan Francisco Market Report March 2023.pdf
San Francisco Market Report March 2023.pdfRonny Budiutama
 
October 2023 Report: San Francisco Real Estate Market Insights
October 2023 Report: San Francisco Real Estate Market InsightsOctober 2023 Report: San Francisco Real Estate Market Insights
October 2023 Report: San Francisco Real Estate Market InsightsRonny Budiutama
 
San Francisco November 2023 Market Report
San Francisco November 2023 Market ReportSan Francisco November 2023 Market Report
San Francisco November 2023 Market ReportRonny Budiutama
 

Ähnlich wie San Francisco Market Report January 2022 (20)

San Francisco Market Report February 2022
San Francisco Market Report February 2022San Francisco Market Report February 2022
San Francisco Market Report February 2022
 
San Francisco Market Report April 2022.pdf
San Francisco Market Report April 2022.pdfSan Francisco Market Report April 2022.pdf
San Francisco Market Report April 2022.pdf
 
San Francisco Market Report May 2022.
San Francisco Market Report May 2022.San Francisco Market Report May 2022.
San Francisco Market Report May 2022.
 
San Francisco Market Report March 2022
San Francisco Market Report March 2022San Francisco Market Report March 2022
San Francisco Market Report March 2022
 
San Francisco Market Report June 2022.pdf
San Francisco Market Report June 2022.pdfSan Francisco Market Report June 2022.pdf
San Francisco Market Report June 2022.pdf
 
San Francisco Market Report July 2022.pdf
San Francisco Market Report July 2022.pdfSan Francisco Market Report July 2022.pdf
San Francisco Market Report July 2022.pdf
 
San Francisco Market Report October 2022.pdf
San Francisco Market Report October 2022.pdfSan Francisco Market Report October 2022.pdf
San Francisco Market Report October 2022.pdf
 
San Francisco Market Report November 2022.pdf
San Francisco Market Report November 2022.pdfSan Francisco Market Report November 2022.pdf
San Francisco Market Report November 2022.pdf
 
San Francisco Market Report December 2022.pdf
San Francisco Market Report December 2022.pdfSan Francisco Market Report December 2022.pdf
San Francisco Market Report December 2022.pdf
 
San Francisco Market Report August 2022.pdf
San Francisco Market Report August 2022.pdfSan Francisco Market Report August 2022.pdf
San Francisco Market Report August 2022.pdf
 
San Francisco Market Report September 2022.pdf
San Francisco Market Report September 2022.pdfSan Francisco Market Report September 2022.pdf
San Francisco Market Report September 2022.pdf
 
San Francisco Market Report February 2023
San Francisco Market Report February 2023San Francisco Market Report February 2023
San Francisco Market Report February 2023
 
San Francisco Market Report January 2023.pdf
San Francisco Market Report January 2023.pdfSan Francisco Market Report January 2023.pdf
San Francisco Market Report January 2023.pdf
 
San Francisco January 2024 Market Report
San Francisco January 2024 Market ReportSan Francisco January 2024 Market Report
San Francisco January 2024 Market Report
 
San Francisco December 2023 Market Report
San Francisco December 2023 Market ReportSan Francisco December 2023 Market Report
San Francisco December 2023 Market Report
 
San Francisco May 2023 Market Report.pdf
San Francisco May 2023 Market Report.pdfSan Francisco May 2023 Market Report.pdf
San Francisco May 2023 Market Report.pdf
 
San Francisco June 2023 Market Report.pdf
San Francisco June 2023 Market Report.pdfSan Francisco June 2023 Market Report.pdf
San Francisco June 2023 Market Report.pdf
 
San Francisco Market Report March 2023.pdf
San Francisco Market Report March 2023.pdfSan Francisco Market Report March 2023.pdf
San Francisco Market Report March 2023.pdf
 
October 2023 Report: San Francisco Real Estate Market Insights
October 2023 Report: San Francisco Real Estate Market InsightsOctober 2023 Report: San Francisco Real Estate Market Insights
October 2023 Report: San Francisco Real Estate Market Insights
 
San Francisco November 2023 Market Report
San Francisco November 2023 Market ReportSan Francisco November 2023 Market Report
San Francisco November 2023 Market Report
 

Kürzlich hochgeladen

9990771857 Call Girls in Dwarka Sector 1 Delhi (Call Girls) Delhi
9990771857 Call Girls in Dwarka Sector 1 Delhi (Call Girls) Delhi9990771857 Call Girls in Dwarka Sector 1 Delhi (Call Girls) Delhi
9990771857 Call Girls in Dwarka Sector 1 Delhi (Call Girls) Delhidelhimodel235
 
2k Shot Call girls Karol Bagh Delhi 9205541914
2k Shot Call girls Karol Bagh Delhi 92055419142k Shot Call girls Karol Bagh Delhi 9205541914
2k Shot Call girls Karol Bagh Delhi 9205541914Delhi Call girls
 
9990771857 Call Girls Dwarka Sector 9 Delhi (Call Girls ) Delhi
9990771857 Call Girls Dwarka Sector 9 Delhi (Call Girls ) Delhi9990771857 Call Girls Dwarka Sector 9 Delhi (Call Girls ) Delhi
9990771857 Call Girls Dwarka Sector 9 Delhi (Call Girls ) Delhidelhimodel235
 
Call Girls in shastri nagar Delhi 8264348440 ✅ call girls ❤️
Call Girls in shastri nagar Delhi 8264348440 ✅ call girls ❤️Call Girls in shastri nagar Delhi 8264348440 ✅ call girls ❤️
Call Girls in shastri nagar Delhi 8264348440 ✅ call girls ❤️soniya singh
 
3D Architectural Rendering Company by Panoram CGI
3D Architectural Rendering Company by Panoram CGI3D Architectural Rendering Company by Panoram CGI
3D Architectural Rendering Company by Panoram CGIPanoram CGI
 
M3M 129 E Brochure Noida Expressway, Sector 129, Noida
M3M 129 E Brochure Noida Expressway, Sector 129, NoidaM3M 129 E Brochure Noida Expressway, Sector 129, Noida
M3M 129 E Brochure Noida Expressway, Sector 129, Noidasarak0han45400
 
Girls in Kalyanpuri }Delhi↫8447779280↬Escort Service. In Delhi NCR
Girls in Kalyanpuri }Delhi↫8447779280↬Escort Service. In Delhi NCRGirls in Kalyanpuri }Delhi↫8447779280↬Escort Service. In Delhi NCR
Girls in Kalyanpuri }Delhi↫8447779280↬Escort Service. In Delhi NCRasmaqueen5
 
Purva Soukhyam in Guduvancheri Chennai.pdf
Purva Soukhyam in Guduvancheri Chennai.pdfPurva Soukhyam in Guduvancheri Chennai.pdf
Purva Soukhyam in Guduvancheri Chennai.pdfpritika141199
 
BDSM⚡Call Girls in Sector 57 Noida Escorts >༒8448380779 Escort Service
BDSM⚡Call Girls in Sector 57 Noida Escorts >༒8448380779 Escort ServiceBDSM⚡Call Girls in Sector 57 Noida Escorts >༒8448380779 Escort Service
BDSM⚡Call Girls in Sector 57 Noida Escorts >༒8448380779 Escort ServiceDelhi Call girls
 
Call girls in new Ashok NagarDelhi꧁ 8447779280꧂ Escort Service Women Seeking ...
Call girls in new Ashok NagarDelhi꧁ 8447779280꧂ Escort Service Women Seeking ...Call girls in new Ashok NagarDelhi꧁ 8447779280꧂ Escort Service Women Seeking ...
Call girls in new Ashok NagarDelhi꧁ 8447779280꧂ Escort Service Women Seeking ...asmaqueen5
 
Premium Villa Projects in Sarjapur Road Bengaluru
Premium Villa Projects in Sarjapur Road BengaluruPremium Villa Projects in Sarjapur Road Bengaluru
Premium Villa Projects in Sarjapur Road BengaluruShivaSeo3
 
9990771857 Call Girls in Dwarka Sector 2 Delhi (Call Girls) Delhi
9990771857 Call Girls in Dwarka Sector 2 Delhi (Call Girls) Delhi9990771857 Call Girls in Dwarka Sector 2 Delhi (Call Girls) Delhi
9990771857 Call Girls in Dwarka Sector 2 Delhi (Call Girls) Delhidelhimodel235
 
Magarpatta Nova Elegance Mundhwa Pune E-Brochure.pdf
Magarpatta Nova Elegance Mundhwa Pune  E-Brochure.pdfMagarpatta Nova Elegance Mundhwa Pune  E-Brochure.pdf
Magarpatta Nova Elegance Mundhwa Pune E-Brochure.pdfManishSaxena95
 
2k Shots ≽ 9205541914 ≼ Call Girls In Sainik Farm (Delhi)
2k Shots ≽ 9205541914 ≼ Call Girls In Sainik Farm (Delhi)2k Shots ≽ 9205541914 ≼ Call Girls In Sainik Farm (Delhi)
2k Shots ≽ 9205541914 ≼ Call Girls In Sainik Farm (Delhi)Delhi Call girls
 
call girls in ganesh nagar Delhi 8264348440 ✅ call girls ❤️
call girls in ganesh nagar Delhi 8264348440 ✅ call girls ❤️call girls in ganesh nagar Delhi 8264348440 ✅ call girls ❤️
call girls in ganesh nagar Delhi 8264348440 ✅ call girls ❤️soniya singh
 
2k Shot Call girls Aiims Delhi 9205541914
2k Shot Call girls Aiims Delhi 92055419142k Shot Call girls Aiims Delhi 9205541914
2k Shot Call girls Aiims Delhi 9205541914Delhi Call girls
 
9990771857 Call Girls in Dwarka Sector 137 Noida (Call Girls) Delhi
9990771857 Call Girls in Dwarka Sector 137 Noida (Call Girls) Delhi9990771857 Call Girls in Dwarka Sector 137 Noida (Call Girls) Delhi
9990771857 Call Girls in Dwarka Sector 137 Noida (Call Girls) Delhidelhimodel235
 
Low Rate ↬Call Girls in Trilokpuri Delhi ↫8447779280}Escorts Service In Delhi
Low Rate ↬Call Girls in Trilokpuri Delhi ↫8447779280}Escorts Service In DelhiLow Rate ↬Call Girls in Trilokpuri Delhi ↫8447779280}Escorts Service In Delhi
Low Rate ↬Call Girls in Trilokpuri Delhi ↫8447779280}Escorts Service In Delhiasmaqueen5
 
Call Girls In Vasant Vihar Delhi 💯Call Us 🔝8264348440🔝
Call Girls In Vasant Vihar Delhi 💯Call Us 🔝8264348440🔝Call Girls In Vasant Vihar Delhi 💯Call Us 🔝8264348440🔝
Call Girls In Vasant Vihar Delhi 💯Call Us 🔝8264348440🔝soniya singh
 
Kohinoor Hinjewadi Phase 2 Pune E-Brochure.pdf
Kohinoor Hinjewadi Phase 2 Pune  E-Brochure.pdfKohinoor Hinjewadi Phase 2 Pune  E-Brochure.pdf
Kohinoor Hinjewadi Phase 2 Pune E-Brochure.pdfManishSaxena95
 

Kürzlich hochgeladen (20)

9990771857 Call Girls in Dwarka Sector 1 Delhi (Call Girls) Delhi
9990771857 Call Girls in Dwarka Sector 1 Delhi (Call Girls) Delhi9990771857 Call Girls in Dwarka Sector 1 Delhi (Call Girls) Delhi
9990771857 Call Girls in Dwarka Sector 1 Delhi (Call Girls) Delhi
 
2k Shot Call girls Karol Bagh Delhi 9205541914
2k Shot Call girls Karol Bagh Delhi 92055419142k Shot Call girls Karol Bagh Delhi 9205541914
2k Shot Call girls Karol Bagh Delhi 9205541914
 
9990771857 Call Girls Dwarka Sector 9 Delhi (Call Girls ) Delhi
9990771857 Call Girls Dwarka Sector 9 Delhi (Call Girls ) Delhi9990771857 Call Girls Dwarka Sector 9 Delhi (Call Girls ) Delhi
9990771857 Call Girls Dwarka Sector 9 Delhi (Call Girls ) Delhi
 
Call Girls in shastri nagar Delhi 8264348440 ✅ call girls ❤️
Call Girls in shastri nagar Delhi 8264348440 ✅ call girls ❤️Call Girls in shastri nagar Delhi 8264348440 ✅ call girls ❤️
Call Girls in shastri nagar Delhi 8264348440 ✅ call girls ❤️
 
3D Architectural Rendering Company by Panoram CGI
3D Architectural Rendering Company by Panoram CGI3D Architectural Rendering Company by Panoram CGI
3D Architectural Rendering Company by Panoram CGI
 
M3M 129 E Brochure Noida Expressway, Sector 129, Noida
M3M 129 E Brochure Noida Expressway, Sector 129, NoidaM3M 129 E Brochure Noida Expressway, Sector 129, Noida
M3M 129 E Brochure Noida Expressway, Sector 129, Noida
 
Girls in Kalyanpuri }Delhi↫8447779280↬Escort Service. In Delhi NCR
Girls in Kalyanpuri }Delhi↫8447779280↬Escort Service. In Delhi NCRGirls in Kalyanpuri }Delhi↫8447779280↬Escort Service. In Delhi NCR
Girls in Kalyanpuri }Delhi↫8447779280↬Escort Service. In Delhi NCR
 
Purva Soukhyam in Guduvancheri Chennai.pdf
Purva Soukhyam in Guduvancheri Chennai.pdfPurva Soukhyam in Guduvancheri Chennai.pdf
Purva Soukhyam in Guduvancheri Chennai.pdf
 
BDSM⚡Call Girls in Sector 57 Noida Escorts >༒8448380779 Escort Service
BDSM⚡Call Girls in Sector 57 Noida Escorts >༒8448380779 Escort ServiceBDSM⚡Call Girls in Sector 57 Noida Escorts >༒8448380779 Escort Service
BDSM⚡Call Girls in Sector 57 Noida Escorts >༒8448380779 Escort Service
 
Call girls in new Ashok NagarDelhi꧁ 8447779280꧂ Escort Service Women Seeking ...
Call girls in new Ashok NagarDelhi꧁ 8447779280꧂ Escort Service Women Seeking ...Call girls in new Ashok NagarDelhi꧁ 8447779280꧂ Escort Service Women Seeking ...
Call girls in new Ashok NagarDelhi꧁ 8447779280꧂ Escort Service Women Seeking ...
 
Premium Villa Projects in Sarjapur Road Bengaluru
Premium Villa Projects in Sarjapur Road BengaluruPremium Villa Projects in Sarjapur Road Bengaluru
Premium Villa Projects in Sarjapur Road Bengaluru
 
9990771857 Call Girls in Dwarka Sector 2 Delhi (Call Girls) Delhi
9990771857 Call Girls in Dwarka Sector 2 Delhi (Call Girls) Delhi9990771857 Call Girls in Dwarka Sector 2 Delhi (Call Girls) Delhi
9990771857 Call Girls in Dwarka Sector 2 Delhi (Call Girls) Delhi
 
Magarpatta Nova Elegance Mundhwa Pune E-Brochure.pdf
Magarpatta Nova Elegance Mundhwa Pune  E-Brochure.pdfMagarpatta Nova Elegance Mundhwa Pune  E-Brochure.pdf
Magarpatta Nova Elegance Mundhwa Pune E-Brochure.pdf
 
2k Shots ≽ 9205541914 ≼ Call Girls In Sainik Farm (Delhi)
2k Shots ≽ 9205541914 ≼ Call Girls In Sainik Farm (Delhi)2k Shots ≽ 9205541914 ≼ Call Girls In Sainik Farm (Delhi)
2k Shots ≽ 9205541914 ≼ Call Girls In Sainik Farm (Delhi)
 
call girls in ganesh nagar Delhi 8264348440 ✅ call girls ❤️
call girls in ganesh nagar Delhi 8264348440 ✅ call girls ❤️call girls in ganesh nagar Delhi 8264348440 ✅ call girls ❤️
call girls in ganesh nagar Delhi 8264348440 ✅ call girls ❤️
 
2k Shot Call girls Aiims Delhi 9205541914
2k Shot Call girls Aiims Delhi 92055419142k Shot Call girls Aiims Delhi 9205541914
2k Shot Call girls Aiims Delhi 9205541914
 
9990771857 Call Girls in Dwarka Sector 137 Noida (Call Girls) Delhi
9990771857 Call Girls in Dwarka Sector 137 Noida (Call Girls) Delhi9990771857 Call Girls in Dwarka Sector 137 Noida (Call Girls) Delhi
9990771857 Call Girls in Dwarka Sector 137 Noida (Call Girls) Delhi
 
Low Rate ↬Call Girls in Trilokpuri Delhi ↫8447779280}Escorts Service In Delhi
Low Rate ↬Call Girls in Trilokpuri Delhi ↫8447779280}Escorts Service In DelhiLow Rate ↬Call Girls in Trilokpuri Delhi ↫8447779280}Escorts Service In Delhi
Low Rate ↬Call Girls in Trilokpuri Delhi ↫8447779280}Escorts Service In Delhi
 
Call Girls In Vasant Vihar Delhi 💯Call Us 🔝8264348440🔝
Call Girls In Vasant Vihar Delhi 💯Call Us 🔝8264348440🔝Call Girls In Vasant Vihar Delhi 💯Call Us 🔝8264348440🔝
Call Girls In Vasant Vihar Delhi 💯Call Us 🔝8264348440🔝
 
Kohinoor Hinjewadi Phase 2 Pune E-Brochure.pdf
Kohinoor Hinjewadi Phase 2 Pune  E-Brochure.pdfKohinoor Hinjewadi Phase 2 Pune  E-Brochure.pdf
Kohinoor Hinjewadi Phase 2 Pune E-Brochure.pdf
 

San Francisco Market Report January 2022

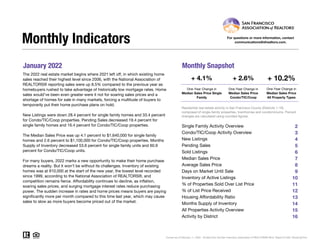
  • 1. January 2022 Monthly Snapshot One-Year Change in One-Year Change in Median Sales Price Single Family Median Sales Price Condo/TIC/Coop 2 3 4 5 6 7 8 9 10 11 12 13 14 15 16 Monthly Indicators + 4.1% + 2.6% + 10.2% One-Year Change in The 2022 real estate market begins where 2021 left off, in which existing home sales reached their highest level since 2006, with the National Association of REALTORS® reporting sales were up 8.5% compared to the previous year as homebuyers rushed to take advantage of historically low mortgage rates. Home sales would’ve been even greater were it not for soaring sales prices and a shortage of homes for sale in many markets, forcing a multitude of buyers to temporarily put their home purchase plans on hold. New Listings were down 28.4 percent for single family homes and 33.4 percent for Condo/TIC/Coop properties. Pending Sales decreased 19.4 percent for single family homes and 16.4 percent for Condo/TIC/Coop properties. The Median Sales Price was up 4.1 percent to $1,640,000 for single family homes and 2.6 percent to $1,100,000 for Condo/TIC/Coop properties. Months Supply of Inventory decreased 53.6 percent for single family units and 60.9 percent for Condo/TIC/Coop units. For many buyers, 2022 marks a new opportunity to make their home purchase dreams a reality. But it won’t be without its challenges. Inventory of existing homes was at 910,000 at the start of the new year, the lowest level recorded since 1999, according to the National Association of REALTORS®, and competition remains fierce. Affordability continues to decline, as inflation, soaring sales prices, and surging mortgage interest rates reduce purchasing power. The sudden increase in rates and home prices means buyers are paying significantly more per month compared to this time last year, which may cause sales to slow as more buyers become priced out of the market. Median Sales Price All Property Types Residential real estate activity in San Francisco County (Districts 1-10) composed of single-family properties, townhomes and condominiums. Percent changes are calculated using rounded figures. Single Family Activity Overview Months Supply of Inventory For questions or more information, contact communications@sfrealtors.com. Current as of February 11, 2022. All data from the San Francisco Association of REALTORS® MLS. Report © 2021 ShowingTime. Condo/TIC/Coop Activity Overview Inventory of Active Listings % of Properties Sold Over List Price % of List Price Received Housing Affordability Ratio All Properties Activity Overview New Listings Pending Sales Sold Listings Median Sales Price Average Sales Price Days on Market Until Sale Activity by District
  • 2. Single Family Activity Overview Key metrics by report month and for year-to-date (YTD) starting from the first of the year. Key Metrics Historical Sparkbars 1-2021 1-2022 Percent Change YTD 2021 YTD 2022 Percent Change Current as of February 11, 2022. All data from the San Francisco Association of REALTORS® MLS. Report © 2021 ShowingTime. | 2 Months Supply 2.8 1.3 - 53.6% -- -- -- Affordability Ratio 36 32 - 11.1% % of List Price Received 105.3% 117.8% + 11.9% 105.3% 36 76.6% + 32.5% + 11.9% 32 - 11.1% 117.8% % of Properties Sold Over List Price 57.8% 76.6% + 32.5% 57.8% Active Listings 593 323 - 45.5% -- Avg. Sales Price $1,945,877 $1,986,955 + 2.1% $1,945,877 Days on Market 36 37 + 2.8% 36 37 + 2.8% $1,986,955 -- -- Median Sales Price $1,575,000 $1,640,000 + 4.1% $1,575,000 Sold Listings 161 128 - 20.5% 161 New Listings 257 184 - 28.4% 257 Pending Sales 170 137 - 19.4% - 19.4% 170 137 - 28.4% 184 128 - 20.5% $1,640,000 + 4.1% + 2.1% 1-2019 1-2020 1-2021 1-2022 1-2019 1-2020 1-2021 1-2022 1-2019 1-2020 1-2021 1-2022 1-2019 1-2020 1-2021 1-2022 1-2019 1-2020 1-2021 1-2022 1-2019 1-2020 1-2021 1-2022 1-2019 1-2020 1-2021 1-2022 1-2019 1-2020 1-2021 1-2022 1-2019 1-2020 1-2021 1-2022 1-2019 1-2020 1-2021 1-2022 1-2019 1-2020 1-2021 1-2022
  • 3. Condo/TIC/Coop Activity Overview Key metrics by report month and for year-to-date (YTD) starting from the first of the year. Key Metrics Historical Sparkbars 1-2021 1-2022 Percent Change YTD 2021 YTD 2022 Percent Change Current as of February 11, 2022. All data from the San Francisco Association of REALTORS® MLS. Report © 2021 ShowingTime. | 3 Months Supply 6.4 2.5 - 60.9% -- -- -- Affordability Ratio 63 56 - 11.1% % of List Price Received 98.7% 101.0% + 2.3% 98.7% 63 37.6% + 71.7% + 2.3% 56 - 11.1% 101.0% % of Properties Sold Over List Price 21.9% 37.6% + 71.7% 21.9% Active Listings 1,597 932 - 41.6% -- Avg. Sales Price $1,211,039 $1,327,055 + 9.6% $1,211,039 Days on Market 70 63 - 10.0% 70 $1,100,000 + 2.6% + 9.6% 63 - 10.0% $1,327,055 -- -- Sold Listings 270 181 - 33.0% 270 181 - 33.0% Median Sales Price $1,072,500 $1,100,000 + 2.6% $1,072,500 - 33.4% Pending Sales 292 244 - 16.4% 292 244 - 16.4% New Listings 530 353 - 33.4% 530 353 1-2019 1-2020 1-2021 1-2022 1-2019 1-2020 1-2021 1-2022 1-2019 1-2020 1-2021 1-2022 1-2019 1-2020 1-2021 1-2022 1-2019 1-2020 1-2021 1-2022 1-2019 1-2020 1-2021 1-2022 1-2019 1-2020 1-2021 1-2022 1-2019 1-2020 1-2021 1-2022 1-2019 1-2020 1-2021 1-2022 1-2019 1-2020 1-2021 1-2022 1-2019 1-2020 1-2021 1-2022
  • 4. New Listings estate market begins where 2021 left off, in which Single Family Year-Over-Year Change Condo/TIC/ Coop Year-Over-Year Change Feb-2021 306 +12.5% 502 +23.6% Mar-2021 345 +98.3% 617 +142.0% Apr-2021 351 +99.4% 514 +123.5% May-2021 313 +13.8% 525 +4.2% Jun-2021 324 -9.7% 493 -14.9% Jul-2021 300 -26.3% 424 -39.3% Aug-2021 300 -15.3% 435 -33.3% Sep-2021 368 +3.7% 576 -13.5% Oct-2021 261 -29.8% 441 -15.4% Nov-2021 150 -38.0% 254 -0.4% Dec-2021 83 -43.9% 166 -32.8% Jan-2022 184 -28.4% 353 -33.4% 12-Month Avg 274 -3.1% 442 -4.4% Historical New Listings by Month Current as of February 11, 2022. All data from the San Francisco Association of REALTORS® MLS. Report © 2021 ShowingTime. | 4 A count of the properties that have been newly listed on the market in a given month. 259 382 257 530 184 353 Single Family Condo/TIC/Coop January 0 200 400 600 800 1-2005 1-2006 1-2007 1-2008 1-2009 1-2010 1-2011 1-2012 1-2013 1-2014 1-2015 1-2016 1-2017 1-2018 1-2019 1-2020 1-2021 1-2022 Single Family Condo/TIC/Coop 259 382 257 530 184 353 Single Family Condo/TIC/Coop Year to Date 2020 2021 2022 - 33.4% + 38.7% - 28.4% - 0.8% + 38.7% - 28.4% - 0.8% - 33.4% 2020 2021 2022 2020 2021 2022 2020 2021 2022 + 6.1% + 6.1% + 3.0% + 3.0%
  • 5. Pending Sales estate market begins where 2021 left off, in which Single Family Year-Over-Year Change Condo/TIC/ Coop Year-Over-Year Change Feb-2021 225 +52.0% 381 +67.8% Mar-2021 290 +68.6% 473 +157.1% Apr-2021 286 +262.0% 478 +419.6% May-2021 307 +89.5% 462 +225.4% Jun-2021 275 +21.1% 390 +66.7% Jul-2021 259 -6.2% 364 +50.4% Aug-2021 226 -3.8% 316 -1.9% Sep-2021 332 +18.1% 337 +10.1% Oct-2021 273 -12.2% 404 +21.3% Nov-2021 261 -15.0% 360 +20.0% Dec-2021 129 -37.7% 224 -27.0% Jan-2022 137 -19.4% 244 -16.4% 12-Month Avg 250 +16.5% 369 +48.7% Historical Pending Sales by Month A count of the properties on which offers have been accepted in a given month. Current as of February 11, 2022. All data from the San Francisco Association of REALTORS® MLS. Report © 2021 ShowingTime. | 5 118 161 170 292 137 244 Single Family Condo/TIC/Coop January 0 100 200 300 400 500 1-2005 1-2006 1-2007 1-2008 1-2009 1-2010 1-2011 1-2012 1-2013 1-2014 1-2015 1-2016 1-2017 1-2018 1-2019 1-2020 1-2021 1-2022 Single Family Condo/TIC/Coop 118 161 170 292 137 244 Single Family Condo/TIC/Coop Year to Date 2020 2021 2022 - 16.4% + 81.4% - 19.4% + 44.1% + 81.4% - 19.4% + 44.1% - 16.4% 2020 2021 2022 2020 2021 2022 2020 2021 2022 + 25.5% + 25.5% + 32.0% + 32.0%
  • 6. Sold Listings estate market begins where 2021 left off, in which Single Family Year-Over-Year Change Condo/TIC/ Coop Year-Over-Year Change Feb-2021 163 +24.4% 278 +56.2% Mar-2021 270 +50.8% 457 +93.6% Apr-2021 289 +140.8% 462 +294.9% May-2021 266 +133.3% 442 +287.7% Jun-2021 325 +79.6% 471 +166.1% Jul-2021 255 +7.1% 371 +39.5% Aug-2021 256 +5.3% 348 +45.0% Sep-2021 245 -4.7% 291 -9.9% Oct-2021 310 +1.6% 362 +24.0% Nov-2021 293 +3.2% 423 +24.0% Dec-2021 212 -29.8% 322 -8.8% Jan-2022 128 -20.5% 181 -33.0% 12-Month Avg 251 +19.8% 367 +51.6% Historical Sold Listings by Month A count of the actual sales that closed in a given month. Current as of February 11, 2022. All data from the San Francisco Association of REALTORS® MLS. Report © 2021 ShowingTime. | 6 109 151 161 270 128 181 Single Family Condo/TIC/Coop January 0 100 200 300 400 500 1-2005 1-2006 1-2007 1-2008 1-2009 1-2010 1-2011 1-2012 1-2013 1-2014 1-2015 1-2016 1-2017 1-2018 1-2019 1-2020 1-2021 1-2022 Single Family Condo/TIC/Coop 109 151 161 270 128 181 Single Family Condo/TIC/Coop Year to Date 2020 2021 2022 - 33.0% + 78.8% - 20.5% + 47.7% + 78.8% - 20.5% + 47.7% - 33.0% 2020 2021 2022 2020 2021 2022 2020 2021 2022 0.0% 0.0% + 25.8% + 25.8%
  • 7. Median Sales Price estate market begins where 2021 left off, in which Single Family Year-Over-Year Change Condo/TIC/ Coop Year-Over-Year Change Feb-2021 $1,650,000 +2.5% $1,196,500 -5.0% Mar-2021 $1,725,000 +9.5% $1,221,184 -2.3% Apr-2021 $1,800,000 +12.1% $1,200,000 -5.9% May-2021 $1,886,500 +18.8% $1,225,000 +12.6% Jun-2021 $1,950,000 +12.7% $1,250,000 +2.0% Jul-2021 $1,850,000 +15.3% $1,208,000 -4.2% Aug-2021 $1,847,500 +13.7% $1,150,000 -5.0% Sep-2021 $1,750,000 +6.1% $1,200,000 +2.1% Oct-2021 $1,805,000 +12.5% $1,247,000 +8.2% Nov-2021 $1,888,888 +15.4% $1,270,000 +8.4% Dec-2021 $1,677,500 +8.2% $1,289,500 +17.2% Jan-2022 $1,640,000 +4.1% $1,100,000 +2.6% 12-Month Avg* $1,810,000 +12.4% $1,220,000 +3.5% Historical Median Sales Price by Month Point at which half of the sales sold for more and half sold for less, not accounting for seller concessions, in a given month. * Median Sales Price for all properties from February 2021 through January 2022. This is not the average of the individual figures above. Current as of February 11, 2022. All data from the San Francisco Association of REALTORS® MLS. Report © 2021 ShowingTime. | 7 $1,460,000 $1,155,500 $1,575,000 $1,072,500 $1,640,000 $1,100,000 Single Family Condo/TIC/Coop January $500,000 $750,000 $1,000,000 $1,250,000 $1,500,000 $1,750,000 $2,000,000 $2,250,000 1-2005 1-2006 1-2007 1-2008 1-2009 1-2010 1-2011 1-2012 1-2013 1-2014 1-2015 1-2016 1-2017 1-2018 1-2019 1-2020 1-2021 1-2022 Single Family Condo/TIC/Coop $1,460,000 $1,155,500 $1,575,000 $1,072,500 $1,640,000 $1,100,000 Single Family Condo/TIC/Coop Year to Date 2020 2021 2022 + 2.6% - 7.2% + 4.1% + 7.9% - 7.2% + 4.1% + 7.9% + 2.6% 2020 2021 2022 2020 2021 2022 2020 2021 2022 + 10.2% + 10.2% + 10.0% + 10.0%
  • 8. Average Sales Price estate market begins where 2021 left off, in which Single Family Year-Over-Year Change Condo/TIC/ Coop Year-Over-Year Change Feb-2021 $2,257,454 +18.2% $1,344,643 -0.5% Mar-2021 $2,214,726 +9.2% $1,369,434 +0.2% Apr-2021 $2,430,795 +11.3% $1,347,315 -0.0% May-2021 $2,479,992 +32.1% $1,369,209 +9.4% Jun-2021 $2,504,876 +13.8% $1,388,929 -1.9% Jul-2021 $2,292,230 +13.8% $1,355,128 -3.0% Aug-2021 $2,128,296 +7.1% $1,425,053 +7.4% Sep-2021 $2,165,489 +14.2% $1,330,272 +1.9% Oct-2021 $2,359,157 +23.7% $1,460,761 +16.6% Nov-2021 $2,359,605 +15.9% $1,543,572 +21.4% Dec-2021 $2,373,627 +17.9% $1,467,566 +14.5% Jan-2022 $1,986,955 +2.1% $1,327,055 +9.6% 12-Month Avg* $2,318,178 +16.2% $1,397,853 +6.8% Historical Average Sales Price by Month Average sales price for all closed sales, not accounting for seller concessions, in a given month. * Avg. Sales Price for all properties from February 2021 through January 2022. This is not the average of the individual figures above. Current as of February 11, 2022. All data from the San Francisco Association of REALTORS® MLS. Report © 2021 ShowingTime. | 8 $2,126,757 $1,268,267 $1,945,877 $1,211,039 $1,986,955 $1,327,055 Single Family Condo/TIC/Coop January $500,000 $1,000,000 $1,500,000 $2,000,000 $2,500,000 $3,000,000 1-2005 1-2006 1-2007 1-2008 1-2009 1-2010 1-2011 1-2012 1-2013 1-2014 1-2015 1-2016 1-2017 1-2018 1-2019 1-2020 1-2021 1-2022 Single Family Condo/TIC/Coop $2,126,757 $1,268,267 $1,945,877 $1,211,039 $1,986,955 $1,327,055 Single Family Condo/TIC/Coop Year to Date 2020 2021 2022 + 9.6% - 4.5% + 2.1% - 8.5% - 4.5% + 2.1% - 8.5% + 9.6% 2020 2021 2022 2020 2021 2022 2020 2021 2022 + 27.0% + 27.0% + 8.8% + 8.8%
  • 9. Days on Market Until Sale estate market begins where 2021 left off, in which Single Family Year-Over-Year Change Condo/TIC/ Coop Year-Over-Year Change Feb-2021 30 +20.0% 62 +121.4% Mar-2021 23 +9.5% 45 +66.7% Apr-2021 19 -5.0% 45 +40.6% May-2021 18 -25.0% 36 -10.0% Jun-2021 17 -34.6% 35 +2.9% Jul-2021 18 -28.0% 40 +5.3% Aug-2021 24 0.0% 40 0.0% Sep-2021 22 -12.0% 37 -17.8% Oct-2021 19 -29.6% 34 -17.1% Nov-2021 20 -39.4% 40 -20.0% Dec-2021 29 -17.1% 45 -27.4% Jan-2022 37 +2.8% 63 -10.0% 12-Month Avg* 22 -20.4% 42 -5.8% Historical Days on Market Until Sale by Month Average number of days between when a property is listed and when an offer is accepted in a given month. * Days on Market for all properties from February 2021 through January 2022. This is not the average of the individual figures above. Current as of February 11, 2022. All data from the San Francisco Association of REALTORS® MLS. Report © 2021 ShowingTime. | 9 36 61 36 70 37 63 Single Family Condo/TIC/Coop January 0 20 40 60 80 100 120 1-2005 1-2006 1-2007 1-2008 1-2009 1-2010 1-2011 1-2012 1-2013 1-2014 1-2015 1-2016 1-2017 1-2018 1-2019 1-2020 1-2021 1-2022 Single Family Condo/TIC/Coop 36 61 36 70 37 63 Single Family Condo/TIC/Coop Year to Date 2020 2021 2022 - 10.0% + 14.8% + 2.8% 0.0% + 14.8% + 2.8% 0.0% - 10.0% 2020 2021 2022 2020 2021 2022 2020 2021 2022 - 10.0% - 10.0% + 7.0% + 7.0%
  • 10. Inventory of Active Listings estate market begins where 2021 left off, in which Single Family Year-Over-Year Change Condo/TIC/ Coop Year-Over-Year Change Feb-2021 627 +7.4% 1,587 +60.3% Mar-2021 633 +14.9% 1,576 +58.1% Apr-2021 666 +9.5% 1,515 +41.5% May-2021 635 -7.7% 1,490 +11.0% Jun-2021 633 -19.2% 1,470 -6.2% Jul-2021 637 -25.9% 1,438 -25.5% Aug-2021 668 -27.7% 1,449 -31.3% Sep-2021 657 -29.3% 1,581 -31.8% Oct-2021 601 -35.2% 1,498 -36.3% Nov-2021 457 -42.3% 1,279 -38.9% Dec-2021 299 -48.9% 886 -41.0% Jan-2022 323 -45.5% 932 -41.6% 12-Month Avg* 570 -22.5% 1,392 -15.9% Historical Inventory of Active Listings by Month The number of properties available for sale in active status at the end of a given month. * Active Listings for all properties from February 2021 through January 2022. This is not the average of the individual figures above. Current as of February 11, 2022. All data from the San Francisco Association of REALTORS® MLS. Report © 2021 ShowingTime. | 10 490 870 593 1,597 323 932 Single Family Condo/TIC/Coop January 0 500 1,000 1,500 2,000 2,500 1-2005 1-2006 1-2007 1-2008 1-2009 1-2010 1-2011 1-2012 1-2013 1-2014 1-2015 1-2016 1-2017 1-2018 1-2019 1-2020 1-2021 1-2022 Single Family Condo/TIC/Coop 2020 2021 2022 - 41.6% + 83.6% - 45.5% + 21.0% 2020 2021 2022 - 7.2% + 6.2%
  • 11. % of Properties Sold Over List Price estate market begins where 2021 left off, in which Single Family Year-Over-Year Change Condo/TIC/ Coop Year-Over-Year Change Feb-2021 68.1% -7.1% 35.3% -44.4% Mar-2021 74.1% -5.2% 42.9% -28.7% Apr-2021 76.1% +8.7% 45.0% -24.7% May-2021 79.7% +26.1% 53.6% +27.3% Jun-2021 82.5% +49.5% 54.4% +74.9% Jul-2021 83.5% +29.1% 55.8% +25.7% Aug-2021 84.4% +28.3% 54.6% +59.6% Sep-2021 84.5% +30.0% 54.6% +58.7% Oct-2021 84.5% +25.2% 61.0% +42.5% Nov-2021 79.5% +29.1% 55.3% +68.6% Dec-2021 79.7% +26.7% 46.6% +62.9% Jan-2022 76.6% +32.5% 37.6% +71.7% 12-Month Avg 80.0% +22.9% 50.5% +29.1% Historical % of Properties Sold Over List Price by Month Percentage found when dividing the number of properties sold by properties sold over its original list price, not accounting for seller concessions. * % of Properties Sold Over List Price for all properties from February 2021 through January 2022. This is not the average of the individual figures above. Current as of February 11, 2022. All data from the San Francisco Association of REALTORS® MLS. Report © 2021 ShowingTime. | 11 62.6% 32.5% 57.8% 21.9% 76.6% 37.6% Single Family Condo/TIC/Coop January 0.0% 20.0% 40.0% 60.0% 80.0% 100.0% 1-2005 1-2006 1-2007 1-2008 1-2009 1-2010 1-2011 1-2012 1-2013 1-2014 1-2015 1-2016 1-2017 1-2018 1-2019 1-2020 1-2021 1-2022 Single Family Condo/TIC/Coop 62.6% 32.5% 57.8% 21.9% 76.6% 37.6% Single Family Condo/TIC/Coop Year to Date 2020 2021 2022 + 71.7% - 32.6% + 32.5% - 7.7% - 32.6% + 32.5% - 7.7% + 71.7% 2020 2021 2022 2020 2021 2022 2020 2021 2022 + 3.3% + 3.3% - 20.3% - 20.3%
  • 12. % of List Price Received estate market begins where 2021 left off, in which Single Family Year-Over-Year Change Condo/TIC/ Coop Year-Over-Year Change Feb-2021 109.7% -1.7% 100.7% -4.3% Mar-2021 112.2% -1.7% 102.4% -1.6% Apr-2021 113.8% +4.6% 103.7% -1.5% May-2021 116.8% +10.4% 105.2% +4.8% Jun-2021 116.3% +10.1% 105.3% +5.4% Jul-2021 118.5% +11.8% 104.8% +3.8% Aug-2021 116.1% +8.0% 104.3% +3.9% Sep-2021 116.3% +8.9% 105.0% +4.8% Oct-2021 117.0% +8.2% 105.5% +4.1% Nov-2021 114.9% +8.4% 104.6% +4.4% Dec-2021 114.5% +8.0% 103.5% +4.2% Jan-2022 117.8% +11.9% 101.0% +2.3% 12-Month Avg* 115.4% +7.5% 104.0% +3.0% Historical % of List Price Received by Month Percentage found when dividing a property’s sales price by its most recent list price, then taking the average for all properties sold in a given month, not accounting for seller concessions. * % of List Price Received for all properties from February 2021 through January 2022. This is not the average of the individual figures above. Current as of February 11, 2022. All data from the San Francisco Association of REALTORS® MLS. Report © 2021 ShowingTime. | 12 107.0% 100.4% 105.3% 98.7% 117.8% 101.0% Single Family Condo/TIC/Coop January 107.0% 100.4% 105.3% 98.7% 117.8% 101.0% Single Family Condo/TIC/Coop Year to Date 90.0% 100.0% 110.0% 120.0% 130.0% 1-2005 1-2006 1-2007 1-2008 1-2009 1-2010 1-2011 1-2012 1-2013 1-2014 1-2015 1-2016 1-2017 1-2018 1-2019 1-2020 1-2021 1-2022 Single Family Condo/TIC/Coop 2020 2021 2022 + 2.3% - 1.7% + 11.9% - 1.6% 2020 2021 2022 + 1.2% - 0.7% 2020 2021 2022 + 2.3% - 1.7% + 11.9% - 1.6% 2020 2021 2022 + 1.2% - 0.7%
  • 13. Housing Affordability Ratio estate market begins where 2021 left off, in which Single Family Year-Over-Year Change Condo/TIC/ Coop Year-Over-Year Change Feb-2021 33 -2.9% 53 +3.9% Mar-2021 32 -3.0% 52 +6.1% Apr-2021 31 -8.8% 55 +7.8% May-2021 30 -14.3% 54 -8.5% Jun-2021 28 -12.5% 52 -3.7% Jul-2021 30 -14.3% 55 +3.8% Aug-2021 30 -14.3% 57 +1.8% Sep-2021 32 -8.6% 55 -3.5% Oct-2021 31 -13.9% 53 -10.2% Nov-2021 30 -14.3% 53 -10.2% Dec-2021 32 -13.5% 49 -21.0% Jan-2022 32 -11.1% 56 -11.1% 12-Month Avg* 31 -8.0% 35 -0.2% Historical Housing Affordability Ratio by Month This index measures housing affordability for the region. For example, an index of 120 means the median household income is 120% of what is necessary to qualify for the median-priced home under prevailing interest rates. A higher number means greater affordability. * Affordability Ratio for all properties from February 2021 through January 2022. This is not the average of the individual figures above. Current as of February 11, 2022. All data from the San Francisco Association of REALTORS® MLS. Report © 2021 ShowingTime. | 13 37 55 36 63 32 56 Single Family Condo/TIC/Coop January 20 40 60 80 100 1-2005 1-2006 1-2007 1-2008 1-2009 1-2010 1-2011 1-2012 1-2013 1-2014 1-2015 1-2016 1-2017 1-2018 1-2019 1-2020 1-2021 1-2022 Single Family Condo/TIC/Coop 2020 2021 2022 - 11.1% + 14.5% - 11.1% - 2.7% 2020 2021 2022 0.0% + 1.9% 37 55 36 63 32 56 Single Family Condo/TIC/Coop Year to Date 2020 2021 2022 - 11.1% + 14.5% - 11.1% - 2.7% 2020 2021 2022 0.0% + 1.9%
  • 14. Months Supply of Inventory estate market begins where 2021 left off, in which Single Family Year-Over-Year Change Condo/TIC/ Coop Year-Over-Year Change Feb-2021 2.8 -3.4% 6.1 +52.5% Mar-2021 2.7 -3.6% 5.5 +31.0% Apr-2021 2.7 -18.2% 4.8 -2.0% May-2021 2.4 -38.5% 4.3 -35.8% Jun-2021 2.4 -45.5% 4.1 -47.4% Jul-2021 2.4 -48.9% 3.9 -58.9% Aug-2021 2.5 -49.0% 4.0 -60.0% Sep-2021 2.5 -47.9% 4.3 -59.4% Oct-2021 2.3 -51.1% 4.0 -62.6% Nov-2021 1.8 -53.8% 3.4 -63.4% Dec-2021 1.2 -57.1% 2.4 -61.9% Jan-2022 1.3 -53.6% 2.5 -60.9% 12-Month Avg* 2.3 -40.9% 4.1 -45.7% Historical Months Supply of Inventory by Month The inventory of homes for sale at the end of a given month, divided by the average monthly pending sales from the last 12 months. * Months Supply for all properties from February 2021 through January 2022. This is not the average of the individual figures above. Current as of February 11, 2022. All data from the San Francisco Association of REALTORS® MLS. Report © 2021 ShowingTime. | 14 2.4 3.5 2.8 6.4 1.3 2.5 Single Family Condo/TIC/Coop January 0.0 2.0 4.0 6.0 8.0 10.0 12.0 1-2005 1-2006 1-2007 1-2008 1-2009 1-2010 1-2011 1-2012 1-2013 1-2014 1-2015 1-2016 1-2017 1-2018 1-2019 1-2020 1-2021 1-2022 Single Family Condo/TIC/Coop 2020 2021 2022 - 60.9% + 82.9% - 53.6% + 16.7% 2020 2021 2022 - 4.0% + 6.1%
  • 15. All Properties Activity Overview Key metrics by report month and for year-to-date (YTD) starting from the first of the year. Key Metrics Historical Sparkbars 1-2021 1-2022 Percent Change YTD 2021 YTD 2022 Percent Change Current as of February 11, 2022. All data from the San Francisco Association of REALTORS® MLS. Report © 2021 ShowingTime. | 15 Months Supply 4.7 2.1 - 55.3% -- -- -- Affordability Ratio 46 39 - 15.2% % of List Price Received 101.1% 107.9% + 6.7% 101.1% 46 53.7% + 51.7% + 6.7% 39 - 15.2% 107.9% % of Properties Sold Over List Price 35.4% 53.7% + 51.7% 35.4% Active Listings 2,223 1,288 - 42.1% -- Avg. Sales Price $1,499,223 $1,595,807 + 6.4% $1,499,223 Days on Market 58 52 - 10.3% 58 $1,350,000 + 10.2% + 6.4% 52 - 10.3% $1,595,807 -- -- Sold Listings 443 315 - 28.9% 443 315 - 28.9% Median Sales Price $1,225,000 $1,350,000 + 10.2% $1,225,000 - 32.0% Pending Sales 474 385 - 18.8% 474 385 - 18.8% New Listings 794 540 - 32.0% 794 540 1-2019 1-2020 1-2021 1-2022 1-2019 1-2020 1-2021 1-2022 1-2019 1-2020 1-2021 1-2022 1-2019 1-2020 1-2021 1-2022 1-2019 1-2020 1-2021 1-2022 1-2019 1-2020 1-2021 1-2022 1-2019 1-2020 1-2021 1-2022 1-2019 1-2020 1-2021 1-2022 1-2019 1-2020 1-2021 1-2022 1-2019 1-2020 1-2021 1-2022 1-2019 1-2020 1-2021 1-2022
  • 16. Activity by District SF District 1: Northwest (Sea Cliff, Lake, Jordan Park / Laurel Heights, Outer Richmond, Central Ric The 2022 SF District 2: Central West (Outer Sunset, Central Sunset, Inner Sunset, Outer Parkside, Parkside, Inner Parkside, Golden Gate Heights) SF District 3: Southwest (Pine Lake Park, Lake Shore, Merced Manor, Stonestown, Lakeside, Merced Heights, Ingleside, Ingleside Heights, Oceanview) SF District 4: Twin Peaks W (Forest Hill (& Ext), W Portal, St Francis Wd, Balboa Terr, Mt Dav Manor, Ingleside Terr, Monterey Hts, Wstwd Pk & H'lnds, Shrwd Fst, Miraloma Pk, Dmnd Hts, Mdtwn Terr) SF District 5: Central (Haight Ashbury, Cole Vly / Prnssus Hts, Clarndn Hts, Corona Hts, Twin Pks, Glen Pk, Noe Vly, Eureka Vly / Dolores Hts, Mission Dolores, Duboce Trngl, Buena Vista / Ashbury Hts) SF District 6: Central North (Lower Pacific Heights, Anza Vista, Western Addition, North Panhandle, Alamo Square, Hayes Valley) SF District 7: North (Marina, Cow Hollow, Presidio Heights, Pacific Heights) SF District 8: Northeast (North Waterfront, North Beach, Russian Hill, Telegraph Hill, Nob Hill, Financial District / Barbary Coast, Downtown, Van Ness / Civic Center, Tenderloin) SF District 9: Central East (Yerba Buena, South Beach, South of Market, Mission Bay, Inner Mission, Potrero Hill, Central Waterfront / Dogpatch, Bernal Heights) SF District 10: Southeast (Outer Mission, Mission Terr, Excelsior, Portola, Bayview, Silver Terr, Hunters Pt, Candlestick Pt, Bayview Hts, Little Hollywood, Visitation Vly, Crocker Amazon) 1-2021 1-2022 + / – 1-2021 1-2022 + / – 1-2021 1-2022 + / – 1-2021 1-2022 + / – 1-2021 1-2022 + / – Single Family 1 SF District 1 32 30 -6.3% 9 15 +66.7% $1,800,000 $2,350,000 +30.6% 42 17 -59.5% 1.7 1.5 -11.8% 2 SF District 2 58 34 -41.4% 25 22 -12.0% $1,550,000 $1,615,000 +4.2% 29 37 +27.6% 1.6 0.7 -56.3% 3 SF District 3 36 22 -38.9% 10 10 0.0% $1,465,908 $1,319,000 -10.0% 54 41 -24.1% 2.6 1.3 -50.0% 4 SF District 4 53 26 -50.9% 30 12 -60.0% $1,875,000 $1,766,500 -5.8% 26 27 +3.8% 1.7 0.7 -58.8% 5 SF District 5 110 41 -62.7% 14 10 -28.6% $2,437,500 $2,475,000 +1.5% 44 48 +9.1% 3.4 1.1 -67.6% 6 SF District 6 16 8 -50.0% 4 8 +100.0% $2,080,000 $2,827,500 +35.9% 37 47 +27.0% 3.1 1.7 -45.2% 7 SF District 7 58 36 -37.9% 6 3 -50.0% $3,500,000 $4,200,000 +20.0% 44 61 +38.6% 7.5 2.8 -62.7% 8 SF District 8 19 21 +10.5% 5 3 -40.0% $2,360,000 $3,637,500 +54.1% 62 172 +177.4% 8.1 7.3 -9.9% 9 SF District 9 99 47 -52.5% 17 14 -17.6% $1,540,000 $1,955,000 +26.9% 44 15 -65.9% 4.0 1.7 -57.5% 10 SF District 10 112 58 -48.2% 41 31 -24.4% $1,020,000 $1,180,000 +15.7% 32 38 +18.8% 2.6 1.3 -50.0% Condo/TIC/Coop 1 SF District 1 63 32 -49.2% 13 7 -46.2% $1,299,900 $1,250,000 -3.8% 42 28 -33.3% 4.1 1.8 -56.1% 2 SF District 2 14 14 0.0% 4 2 -50.0% $839,500 $1,348,000 +60.6% 135 38 -71.9% 2.5 2.7 +8.0% 3 SF District 3 12 2 -83.3% 3 4 +33.3% $770,000 $797,500 +3.6% 63 41 -34.9% 4.3 0.5 -88.4% 4 SF District 4 16 14 -12.5% 5 5 0.0% $855,125 $550,000 -35.7% 85 76 -10.6% 3.5 2.8 -20.0% 5 SF District 5 154 75 -51.3% 49 19 -61.2% $1,200,000 $1,400,000 +16.7% 55 40 -27.3% 3.5 1.4 -60.0% 6 SF District 6 129 89 -31.0% 34 22 -35.3% $1,140,000 $1,150,000 +0.9% 67 49 -26.9% 4.5 2.2 -51.1% 7 SF District 7 152 54 -64.5% 22 21 -4.5% $1,187,500 $1,500,000 +26.3% 60 73 +21.7% 5.6 1.3 -76.8% 8 SF District 8 322 192 -40.4% 43 35 -18.6% $1,075,000 $958,500 -10.8% 92 64 -30.4% 8.5 3.0 -64.7% 9 SF District 9 690 419 -39.3% 87 63 -27.6% $960,000 $1,050,000 +9.4% 70 74 +5.7% 8.7 3.3 -62.1% 10 SF District 10 45 41 -8.9% 10 3 -70.0% $710,000 $785,000 +10.6% 83 91 +9.6% 7.8 5.0 -35.9% Key metrics by report month for the districts of San Fransisco. Current as of February 11, 2022. All data from the San Francisco Association of REALTORS® MLS. Report © 2021 ShowingTime. | 16 Active Listings Sold Listings Median Sales Price Days on Market Months Supply