SlideShare ist ein Scribd-Unternehmen logo
1 von 16
Downloaden Sie, um offline zu lesen
July 2021 Monthly Snapshot
One-Year Change in One-Year Change in
Median Sales Price Single
Family
Median Sales Price
Condo/TIC/Coop
2
3
4
5
6
7
8
9
10
11
12
13
14
15
16
Current as of August 11, 2021. All data from the San Francisco MLS. Report © 2021 ShowingTime.
Condo/TIC/Coop Activity Overview
Inventory of Active Listings
% of Properties Sold Over List Price
% of List Price Received
Housing Affordability Ratio
All Properties Activity Overview
New Listings
Pending Sales
Sold Listings
Median Sales Price
Average Sales Price
Days on Market Until Sale
Activity by District
Monthly Indicators
+ 15.3% - 4.0% + 2.5%
One-Year Change in
The White House recently announced additional measures to help struggling
homeowners avoid foreclosure as they exit forbearance, including loan
modifications and payment reductions. Borrowers with federally backed
mortgages can lock in lower interest rates and extend the length of their
mortgages. For borrowers who can’t resume their monthly mortgage, HUD will
offer lenders the ability to provide all eligible borrowers with a 25% principal and
interest reduction.
New Listings were down 46.8 percent for single family homes and 58.0 percent
for Condo/TIC/Coop properties. Pending Sales decreased 8.0 percent for single
family homes but increased 46.3 percent for Condo/TIC/Coop properties.
The Median Sales Price was up 15.3 percent to $1,850,000 for single family
homes but decreased 4.0 percent to $1,210,000 for Condo/TIC/Coop
properties. Months Supply of Inventory decreased 61.7 percent for single family
units and 67.4 percent for Condo/TIC/Coop units.
The National Association of REALTORS® reported inventory of homes for sale
nationwide rose slightly in June as more sellers list their homes, hoping to take
advantage of record-high sales prices across the country. Even with renewed
home seller interest, inventory overall remains 18.8% lower than a year ago,
according to NAR.
Median Sales Price
All Property Types
Residential real estate activity in San Francisco County (Districts 1-10)
composed of single-family properties, townhomes and condominiums. Percent
changes are calculated using rounded figures.
Single Family Activity Overview
Months Supply of Inventory
Single Family Activity Overview
Key metrics by report month and for year-to-date (YTD) starting from the first of the year.
Key Metrics Historical Sparkbars 7-2020 7-2021 Percent Change YTD 2020 YTD 2021 Percent Change
+ 5.1%
2,021
1,725 + 60.9%
$1,800,000 + 11.9%
+ 14.1%
Pending Sales 276 254 - 8.0% + 53.5%
1,182 1,814
New Listings 408 217 - 46.8% 1,923
Sold Listings 238 253 + 6.3% 1,072
Median Sales Price $1,604,000 $1,850,000 + 15.3% $1,609,000
22 - 12.0%
$2,340,538
-- --
Days on Market 25 18 - 28.0% 25
Avg. Sales Price $2,013,417 $2,308,137 + 14.6% $2,051,039
Active Listings 861 464 - 46.1% --
% of Properties Sold Over List Price 64.7% 84.2% + 30.1% 66.6%
35
76.3% + 14.6%
+ 5.2%
31 - 11.4%
114.0%
% of List Price Received 106.0% 118.6% + 11.9% 108.4%
Current as of August 11, 2021. All data from the San Francisco MLS. Report © 2021 ShowingTime. | 2
Months Supply 4.7 1.8 - 61.7% -- -- --
Affordability Ratio 35 30 - 14.3%
7-2018 7-2019 7-2020 7-2021
7-2018 7-2019 7-2020 7-2021
7-2018 7-2019 7-2020 7-2021
7-2018 7-2019 7-2020 7-2021
7-2018 7-2019 7-2020 7-2021
7-2018 7-2019 7-2020 7-2021
7-2018 7-2019 7-2020 7-2021
7-2018 7-2019 7-2020 7-2021
7-2018 7-2019 7-2020 7-2021
7-2018 7-2019 7-2020 7-2021
7-2018 7-2019 7-2020 7-2021
Condo/TIC/Coop Activity Overview
Key metrics by report month and for year-to-date (YTD) starting from the first of the year.
Key Metrics Historical Sparkbars 7-2020 7-2021 Percent Change YTD 2020 YTD 2021 Percent Change
+ 7.9%
Pending Sales 242 354 + 46.3% 1,280 2,827 + 120.9%
New Listings 696 292 - 58.0% 3,050 3,290
Sold Listings 266 365 + 37.2% 1,239 2,735 + 120.7%
Median Sales Price $1,260,700 $1,210,000 - 4.0% $1,220,000 $1,200,000 - 1.6%
- 0.3%
45 + 25.0%
$1,349,153
-- --
Days on Market 38 40 + 5.3% 36
Avg. Sales Price $1,397,387 $1,358,133 - 2.8% $1,353,553
Active Listings 1,926 1,126 - 41.5% --
% of Properties Sold Over List Price 44.4% 56.4% + 27.0% 48.0%
55
46.0% - 4.2%
+ 1.1%
55 0.0%
103.4%
% of List Price Received 101.0% 104.9% + 3.9% 102.3%
Current as of August 11, 2021. All data from the San Francisco MLS. Report © 2021 ShowingTime. | 3
Months Supply 9.5 3.1 - 67.4% -- -- --
Affordability Ratio 53 54 + 1.9%
7-2018 7-2019 7-2020 7-2021
7-2018 7-2019 7-2020 7-2021
7-2018 7-2019 7-2020 7-2021
7-2018 7-2019 7-2020 7-2021
7-2018 7-2019 7-2020 7-2021
7-2018 7-2019 7-2020 7-2021
7-2018 7-2019 7-2020 7-2021
7-2018 7-2019 7-2020 7-2021
7-2018 7-2019 7-2020 7-2021
7-2018 7-2019 7-2020 7-2021
7-2018 7-2019 7-2020 7-2021
New Listings
recently
announced
additional
Single
Family
Year-Over-Year
Change
Condo/TIC/
Coop
Year-Over-Year
Change
Aug-2020 354 +29.7% 651 +96.7%
Sep-2020 356 +1.7% 663 +27.0%
Oct-2020 372 +34.3% 519 +43.4%
Nov-2020 242 +43.2% 252 +49.1%
Dec-2020 147 +54.7% 246 +87.8%
Jan-2021 255 -1.5% 524 +37.5%
Feb-2021 305 +12.1% 495 +21.9%
Mar-2021 338 +94.3% 604 +136.9%
Apr-2021 334 +89.8% 490 +113.0%
May-2021 293 +6.5% 475 -5.6%
Jun-2021 279 -22.3% 410 -29.2%
Jul-2021 217 -46.8% 292 -58.0%
12-Month Avg 291 +13.1% 468 +23.1%
Historical New Listings by Month
Current as of August 11, 2021. All data from the San Francisco MLS. Report © 2021 ShowingTime. | 4
A count of the properties that have been newly listed on the market in a given month.
232
327
408
696
217
292
Single Family Condo/TIC/Coop
July
0
200
400
600
800
1-2005 1-2006 1-2007 1-2008 1-2009 1-2010 1-2011 1-2012 1-2013 1-2014 1-2015 1-2016 1-2017 1-2018 1-2019 1-2020 1-2021
Single Family Condo/TIC/Coop
1,812
2,436
1,923
3,050
2,021
3,290
Single Family Condo/TIC/Coop
Year to Date
2019 2020 2021
- 58.0%
+ 112.8%
- 46.8%
+ 75.9% + 25.2%
+ 5.1%
+ 6.1% + 7.9%
2019 2020 2021 2019 2020 2021 2019 2020 2021
- 18.3% - 6.6% - 2.7%
+ 20.2%
Pending Sales
recently
announced
additional
Single
Family
Year-Over-Year
Change
Condo/TIC/
Coop
Year-Over-Year
Change
Aug-2020 235 +37.4% 322 +54.8%
Sep-2020 281 +29.5% 305 +33.2%
Oct-2020 311 +17.8% 333 +5.4%
Nov-2020 307 +38.3% 299 +26.2%
Dec-2020 208 +56.4% 307 +100.7%
Jan-2021 175 +48.3% 291 +80.7%
Feb-2021 225 +52.0% 380 +67.4%
Mar-2021 290 +68.6% 472 +157.9%
Apr-2021 285 +260.8% 478 +419.6%
May-2021 309 +90.7% 459 +225.5%
Jun-2021 276 +21.6% 393 +67.9%
Jul-2021 254 -8.0% 354 +46.3%
12-Month Avg 263 +44.2% 366 +81.3%
Historical Pending Sales by Month
Current as of August 11, 2021. All data from the San Francisco MLS. Report © 2021 ShowingTime. | 5
A count of the properties on which offers have been accepted in a given month.
213 215
276
242
254
354
Single Family Condo/TIC/Coop
July
0
100
200
300
400
500
1-2005 1-2006 1-2007 1-2008 1-2009 1-2010 1-2011 1-2012 1-2013 1-2014 1-2015 1-2016 1-2017 1-2018 1-2019 1-2020 1-2021
Single Family Condo/TIC/Coop
1,438
1,764
1,182
1,280
1,814
2,827
Single Family Condo/TIC/Coop
Year to Date
2019 2020 2021
+ 46.3%
+ 12.6%
- 8.0%
+ 29.6% - 27.4%
+ 53.5%
- 17.8% + 120.9%
2019 2020 2021 2019 2020 2021 2019 2020 2021
+ 14.5% - 2.2% - 6.4%
- 14.7%
Sold Listings
recently
announced
additional
Single
Family
Year-Over-Year
Change
Condo/TIC/
Coop
Year-Over-Year
Change
Aug-2020 243 +24.6% 240 +12.1%
Sep-2020 257 +77.2% 323 +75.5%
Oct-2020 305 +10.9% 292 +8.6%
Nov-2020 284 +26.8% 341 +25.8%
Dec-2020 302 +43.8% 353 +54.1%
Jan-2021 163 +49.5% 268 +77.5%
Feb-2021 163 +24.4% 278 +56.2%
Mar-2021 269 +50.3% 457 +93.6%
Apr-2021 288 +140.0% 459 +292.3%
May-2021 266 +133.3% 440 +286.0%
Jun-2021 323 +78.5% 468 +164.4%
Jul-2021 253 +6.3% 365 +37.2%
12-Month Avg 260 +46.9% 357 +78.1%
Historical Sold Listings by Month
Current as of August 11, 2021. All data from the San Francisco MLS. Report © 2021 ShowingTime. | 6
A count of the actual sales that closed in a given month.
239 249
238
266
253
365
Single Family Condo/TIC/Coop
July
0
100
200
300
400
500
1-2005 1-2006 1-2007 1-2008 1-2009 1-2010 1-2011 1-2012 1-2013 1-2014 1-2015 1-2016 1-2017 1-2018 1-2019 1-2020 1-2021
Single Family Condo/TIC/Coop
1,392
1,722
1,072
1,239
1,725
2,735
Single Family Condo/TIC/Coop
Year to Date
2019 2020 2021
+ 37.2%
+ 6.8%
+ 6.3%
- 0.4% - 28.0%
+ 60.9%
- 23.0% + 120.7%
2019 2020 2021 2019 2020 2021 2019 2020 2021
+ 10.6% - 1.9% - 6.4%
- 10.1%
Median Sales Price
recently
announced
additional
Single
Family
Year-Over-Year
Change
Condo/TIC/
Coop
Year-Over-Year
Change
Aug-2020 $1,625,000 +1.6% $1,210,000 -2.1%
Sep-2020 $1,650,000 +8.2% $1,175,000 -9.6%
Oct-2020 $1,605,000 +0.3% $1,152,500 -11.4%
Nov-2020 $1,637,500 +7.2% $1,172,125 +0.2%
Dec-2020 $1,550,000 +11.7% $1,100,000 -7.2%
Jan-2021 $1,600,000 +9.6% $1,072,500 -7.2%
Feb-2021 $1,650,000 +2.5% $1,196,500 -5.0%
Mar-2021 $1,725,000 +9.5% $1,221,184 -2.3%
Apr-2021 $1,800,000 +12.1% $1,200,000 -5.9%
May-2021 $1,886,500 +18.8% $1,226,000 +12.7%
Jun-2021 $1,950,000 +12.7% $1,250,000 +2.0%
Jul-2021 $1,850,000 +15.3% $1,210,000 -4.0%
12-Month Avg* $1,715,000 +9.2% $1,195,000 -2.4%
Historical Median Sales Price by Month
* Median Sales Price for all properties from August 2020 through July 2021. This is not the
average of the individual figures above.
Current as of August 11, 2021. All data from the San Francisco MLS. Report © 2021 ShowingTime. | 7
Point at which half of the sales sold for more and half sold for less, not accounting for seller concessions, in a given month.
$1,550,000
$1,200,000
$1,604,000
$1,260,700
$1,850,000
$1,210,000
Single Family Condo/TIC/Coop
July
$500,000
$750,000
$1,000,000
$1,250,000
$1,500,000
$1,750,000
$2,000,000
$2,250,000
1-2005 1-2006 1-2007 1-2008 1-2009 1-2010 1-2011 1-2012 1-2013 1-2014 1-2015 1-2016 1-2017 1-2018 1-2019 1-2020 1-2021
Single Family Condo/TIC/Coop
$1,597,500
$1,200,000
$1,609,000
$1,220,000
$1,800,000
$1,200,000
Single Family Condo/TIC/Coop
Year to Date
2019 2020 2021
- 4.0%
+ 5.1%
+ 15.3%
+ 3.5% + 1.7%
+ 11.9%
+ 0.7% - 1.6%
2019 2020 2021 2019 2020 2021 2019 2020 2021
- 3.1% - 0.2% + 2.7%
+ 8.1%
Average Sales Price
recently
announced
additional
Single
Family
Year-Over-Year
Change
Condo/TIC/
Coop
Year-Over-Year
Change
Aug-2020 $1,987,092 +8.7% $1,326,561 -2.7%
Sep-2020 $1,896,046 -4.6% $1,306,022 -9.2%
Oct-2020 $1,907,545 +1.7% $1,252,476 -12.2%
Nov-2020 $2,035,750 +6.6% $1,270,960 -3.1%
Dec-2020 $2,013,136 +9.0% $1,281,834 +2.7%
Jan-2021 $1,951,111 -8.3% $1,209,875 -4.6%
Feb-2021 $2,257,454 +18.2% $1,344,643 -0.5%
Mar-2021 $2,217,011 +9.3% $1,369,434 +0.2%
Apr-2021 $2,435,017 +11.5% $1,348,128 +0.1%
May-2021 $2,479,992 +32.1% $1,370,558 +9.5%
Jun-2021 $2,508,157 +14.0% $1,385,664 -2.1%
Jul-2021 $2,308,137 +14.6% $1,358,133 -2.8%
12-Month Avg* $2,174,421 +10.5% $1,326,275 -2.1%
Historical Average Sales Price by Month
* Avg. Sales Price for all properties from August 2020 through July 2021. This is not the average
of the individual figures above.
Current as of August 11, 2021. All data from the San Francisco MLS. Report © 2021 ShowingTime. | 8
Average sales price for all closed sales, not accounting for seller concessions, in a given month.
$1,908,662
$1,284,998
$2,013,417
$1,397,387
$2,308,137
$1,358,133
Single Family Condo/TIC/Coop
July
$500,000
$1,000,000
$1,500,000
$2,000,000
$2,500,000
$3,000,000
1-2005 1-2006 1-2007 1-2008 1-2009 1-2010 1-2011 1-2012 1-2013 1-2014 1-2015 1-2016 1-2017 1-2018 1-2019 1-2020 1-2021
Single Family Condo/TIC/Coop
$2,005,170
$1,328,631
$2,051,039
$1,353,553
$2,340,538
$1,349,153
Single Family Condo/TIC/Coop
Year to Date
2019 2020 2021
- 2.8%
+ 8.7%
+ 14.6%
+ 5.5% + 1.9%
+ 14.1%
+ 2.3% - 0.3%
2019 2020 2021 2019 2020 2021 2019 2020 2021
+ 0.2% + 3.4% + 1.8%
+ 5.5%
Days on Market Until Sale
recently
announced
additional
Single
Family
Year-Over-Year
Change
Condo/TIC/
Coop
Year-Over-Year
Change
Aug-2020 24 -7.7% 40 +17.6%
Sep-2020 25 -7.4% 45 +32.4%
Oct-2020 27 +22.7% 41 +41.4%
Nov-2020 33 +37.5% 50 +51.5%
Dec-2020 35 +16.7% 62 +29.2%
Jan-2021 37 +2.8% 70 +14.8%
Feb-2021 30 +20.0% 62 +121.4%
Mar-2021 23 +9.5% 45 +66.7%
Apr-2021 19 -5.0% 45 +40.6%
May-2021 18 -25.0% 36 -10.0%
Jun-2021 17 -34.6% 35 +2.9%
Jul-2021 18 -28.0% 40 +5.3%
12-Month Avg* 25 -0.8% 46 +28.7%
Historical Days on Market Until Sale by Month
* Days on Market for all properties from August 2020 through July 2021. This is not the average
of the individual figures above.
Current as of August 11, 2021. All data from the San Francisco MLS. Report © 2021 ShowingTime. | 9
Average number of days between when a property is listed and when an offer is accepted in a given month.
23
33
25
38
18
40
Single Family Condo/TIC/Coop
July
0
20
40
60
80
100
120
1-2005 1-2006 1-2007 1-2008 1-2009 1-2010 1-2011 1-2012 1-2013 1-2014 1-2015 1-2016 1-2017 1-2018 1-2019 1-2020 1-2021
Single Family Condo/TIC/Coop
26
36
25
36
22
45
Single Family Condo/TIC/Coop
Year to Date
2019 2020 2021
+ 5.3%
+ 15.2%
- 28.0%
+ 8.7% 0.0%
- 12.0%
- 3.8% + 25.0%
2019 2020 2021 2019 2020 2021 2019 2020 2021
+ 9.5% + 23.8% + 16.1%
+ 10.0%
Inventory of Active Listings
recently
announced
additional
Single
Family
Year-Over-Year
Change
Condo/TIC/
Coop
Year-Over-Year
Change
Aug-2020 925 +56.8% 2,104 +125.3%
Sep-2020 931 +36.9% 2,314 +103.9%
Oct-2020 929 +44.3% 2,345 +114.5%
Nov-2020 794 +44.4% 2,082 +123.6%
Dec-2020 585 +48.9% 1,491 +108.2%
Jan-2021 586 +19.6% 1,581 +81.9%
Feb-2021 619 +6.0% 1,565 +58.2%
Mar-2021 618 +12.2% 1,542 +54.8%
Apr-2021 635 +4.4% 1,456 +36.1%
May-2021 582 -15.4% 1,384 +3.2%
Jun-2021 538 -31.3% 1,279 -18.3%
Jul-2021 464 -46.1% 1,126 -41.5%
12-Month Avg* 684 +10.6% 1,689 +49.4%
Historical Inventory of Active Listings by Month
* Active Listings for all properties from August 2020 through July 2021. This is not the average of
the individual figures above.
Current as of August 11, 2021. All data from the San Francisco MLS. Report © 2021 ShowingTime. | 10
The number of properties available for sale in active status at the end of a given month.
519
882
861
1,926
464
1,126
Single Family Condo/TIC/Coop
July
0
500
1,000
1,500
2,000
2,500
1-2005 1-2006 1-2007 1-2008 1-2009 1-2010 1-2011 1-2012 1-2013 1-2014 1-2015 1-2016 1-2017 1-2018 1-2019 1-2020 1-2021
Single Family Condo/TIC/Coop
2019 2020 2021
- 41.5%
+ 118.4%
- 46.1%
+ 65.9%
2019 2020 2021
- 7.0% + 9.8%
% of Properties Sold Over List Price
recently
announced
additional
Single
Family
Year-Over-Year
Change
Condo/TIC/
Coop
Year-Over-Year
Change
Aug-2020 65.8% -20.3% 34.2% -40.5%
Sep-2020 65.0% -12.8% 34.4% -41.4%
Oct-2020 67.5% -16.0% 42.8% -33.8%
Nov-2020 61.6% -20.2% 32.8% -49.2%
Dec-2020 62.9% -7.9% 28.6% -38.8%
Jan-2021 58.3% -6.9% 21.6% -33.5%
Feb-2021 68.1% -7.1% 35.3% -44.4%
Mar-2021 74.0% -5.4% 42.9% -28.7%
Apr-2021 76.4% +9.1% 45.1% -24.6%
May-2021 79.7% +26.1% 53.9% +28.0%
Jun-2021 82.7% +49.8% 54.5% +75.2%
Jul-2021 84.2% +30.1% 56.4% +27.0%
12-Month Avg 71.1% -0.9% 41.7% -21.7%
Historical % of Properties Sold Over List Price by Month
* % of Properties Sold Over List Price for all properties from August 2020 through July 2021. This
is not the average of the individual figures above.
Current as of August 11, 2021. All data from the San Francisco MLS. Report © 2021 ShowingTime. | 11
Percentage found when dividing the number of properties sold by properties sold over its original list price, not accounting for seller
concessions.
82.0%
69.9%
64.7%
44.4%
84.2%
56.4%
Single Family Condo/TIC/Coop
July
0.0%
20.0%
40.0%
60.0%
80.0%
100.0%
1-2005 1-2006 1-2007 1-2008 1-2009 1-2010 1-2011 1-2012 1-2013 1-2014 1-2015 1-2016 1-2017 1-2018 1-2019 1-2020 1-2021
Single Family Condo/TIC/Coop
76.5%
58.9%
66.6%
48.0%
76.3%
46.0%
Single Family Condo/TIC/Coop
Year to Date
2019 2020 2021
+ 27.0%
- 36.5%
+ 30.1%
- 21.1% - 18.5%
+ 14.6%
- 12.9% - 4.2%
2019 2020 2021 2019 2020 2021 2019 2020 2021
- 3.8% - 6.6% - 4.4%
+ 11.3%
% of List Price Received
recently
announced
additional
Single
Family
Year-Over-Year
Change
Condo/TIC/
Coop
Year-Over-Year
Change
Aug-2020 107.5% -6.1% 100.4% -4.7%
Sep-2020 106.8% -5.2% 100.2% -4.5%
Oct-2020 108.1% -4.8% 101.3% -4.3%
Nov-2020 106.0% -5.3% 100.2% -4.7%
Dec-2020 106.0% -3.5% 99.3% -3.6%
Jan-2021 105.3% -1.6% 98.6% -1.8%
Feb-2021 109.7% -1.7% 100.7% -4.3%
Mar-2021 112.2% -1.7% 102.4% -1.6%
Apr-2021 113.9% +4.7% 103.7% -1.5%
May-2021 116.8% +10.4% 105.3% +4.9%
Jun-2021 116.3% +10.1% 105.3% +5.4%
Jul-2021 118.6% +11.9% 104.9% +3.9%
12-Month Avg* 110.8% +0.4% 102.2% -1.3%
Historical % of List Price Received by Month
* % of List Price Received for all properties from August 2020 through July 2021. This is not the
average of the individual figures above.
Current as of August 11, 2021. All data from the San Francisco MLS. Report © 2021 ShowingTime. | 12
Percentage found when dividing a property’s sales price by its most recent list price, then taking the average for all properties sold in a given
month, not accounting for seller concessions.
115.2%
107.5%
106.0%
101.0%
118.6%
104.9%
Single Family Condo/TIC/Coop
July
112.5%
105.5%
108.4%
102.3%
114.0%
103.4%
Single Family Condo/TIC/Coop
Year to Date
90.0%
100.0%
110.0%
120.0%
130.0%
1-2005 1-2006 1-2007 1-2008 1-2009 1-2010 1-2011 1-2012 1-2013 1-2014 1-2015 1-2016 1-2017 1-2018 1-2019 1-2020 1-2021
Single Family Condo/TIC/Coop
2019 2020 2021
+ 3.9%
- 6.0%
+ 11.9%
- 8.0%
2019 2020 2021
- 1.8% + 0.7%
2019 2020 2021
+ 1.1%
- 3.0%
+ 5.2%
- 3.6%
2019 2020 2021
- 4.6% - 1.2%
Housing Affordability Ratio
recently
announced
additional
Single
Family
Year-Over-Year
Change
Condo/TIC/
Coop
Year-Over-Year
Change
Aug-2020 35 +2.9% 56 +9.8%
Sep-2020 35 0.0% 57 +18.8%
Oct-2020 36 +5.9% 59 +20.4%
Nov-2020 35 +2.9% 59 +13.5%
Dec-2020 37 -2.6% 62 +19.2%
Jan-2021 36 -2.7% 63 +14.5%
Feb-2021 33 -2.9% 53 +3.9%
Mar-2021 32 -3.0% 52 +6.1%
Apr-2021 31 -8.8% 55 +7.8%
May-2021 30 -14.3% 54 -8.5%
Jun-2021 28 -12.5% 52 -3.7%
Jul-2021 30 -14.3% 54 +1.9%
12-Month Avg* 33 -13.1% 35 +3.9%
Historical Housing Affordability Ratio by Month
* Affordability Ratio for all properties from August 2020 through July 2021. This is not the average
of the individual figures above.
Current as of August 11, 2021. All data from the San Francisco MLS. Report © 2021 ShowingTime. | 13
This index measures housing affordability for the region. For example, an index of 120 means the median household income is 120% of what is
necessary to qualify for the median-priced home under prevailing interest rates. A higher number means greater affordability.
33
50
35
53
30
54
Single Family Condo/TIC/Coop
July
20
40
60
80
100
1-2005 1-2006 1-2007 1-2008 1-2009 1-2010 1-2011 1-2012 1-2013 1-2014 1-2015 1-2016 1-2017 1-2018 1-2019 1-2020 1-2021
Single Family Condo/TIC/Coop
2019 2020 2021
+ 1.9%
+ 6.0%
- 14.3%
+ 6.1%
2019 2020 2021
+ 10.0% - 2.0%
32
50
35
55
31
55
Single Family Condo/TIC/Coop
Year to Date
2019 2020 2021
0.0%
+ 10.0%
- 11.4%
+ 9.4%
2019 2020 2021
+ 6.7% + 4.2%
Months Supply of Inventory
recently
announced
additional
Single
Family
Year-Over-Year
Change
Condo/TIC/
Coop
Year-Over-Year
Change
Aug-2020 4.9 +69.0% 10.0 +156.4%
Sep-2020 4.8 +45.5% 10.6 +125.5%
Oct-2020 4.7 +46.9% 10.7 +137.8%
Nov-2020 3.9 +44.4% 9.3 +144.7%
Dec-2020 2.8 +47.4% 6.3 +110.0%
Jan-2021 2.7 +12.5% 6.4 +82.9%
Feb-2021 2.8 -3.4% 6.0 +50.0%
Mar-2021 2.7 -3.6% 5.4 +28.6%
Apr-2021 2.6 -21.2% 4.6 -6.1%
May-2021 2.2 -43.6% 4.0 -40.3%
Jun-2021 2.0 -54.5% 3.6 -53.8%
Jul-2021 1.8 -61.7% 3.1 -67.4%
12-Month Avg* 3.2 -1.3% 6.7 +31.4%
Historical Months Supply of Inventory by Month
* Months Supply for all properties from August 2020 through July 2021. This is not the average of
the individual figures above.
Current as of August 11, 2021. All data from the San Francisco MLS. Report © 2021 ShowingTime. | 14
The inventory of homes for sale at the end of a given month, divided by the average monthly pending sales from the last 12 months.
2.5
3.7
4.7
9.5
1.8
3.1
Single Family Condo/TIC/Coop
July
0.0
2.0
4.0
6.0
8.0
10.0
12.0
1-2005 1-2006 1-2007 1-2008 1-2009 1-2010 1-2011 1-2012 1-2013 1-2014 1-2015 1-2016 1-2017 1-2018 1-2019 1-2020 1-2021
Single Family Condo/TIC/Coop
2019 2020 2021
- 67.4%
+ 156.8%
- 61.7%
+ 88.0%
2019 2020 2021
- 3.8% + 19.4%
All Properties Activity Overview
Key metrics by report month and for year-to-date (YTD) starting from the first of the year.
Key Metrics Historical Sparkbars 7-2020 7-2021 Percent Change YTD 2020 YTD 2021 Percent Change
+ 6.3%
Pending Sales 527 615 + 16.7% 2,508 4,694 + 87.2%
New Listings 1,126 524 - 53.5% 5,073 5,393
Sold Listings 512 625 + 22.1% 2,356 4,513 + 91.6%
Median Sales Price $1,425,000 $1,460,000 + 2.5% $1,400,000 $1,400,000 0.0%
+ 3.4%
36 + 16.1%
$1,732,872
-- --
Days on Market 32 31 - 3.1% 31
Avg. Sales Price $1,683,994 $1,741,439 + 3.4% $1,675,184
Active Listings 2,839 1,630 - 42.6% --
% of Properties Sold Over List Price 54.3% 67.8% + 24.9% 56.8%
40
57.7% + 1.6%
+ 2.3%
38 - 5.0%
107.5%
% of List Price Received 103.4% 110.5% + 6.9% 105.1%
Current as of August 11, 2021. All data from the San Francisco MLS. Report © 2021 ShowingTime. | 15
Months Supply 7.2 2.6 - 63.9% -- -- --
Affordability Ratio 40 38 - 5.0%
7-2018 7-2019 7-2020 7-2021
7-2018 7-2019 7-2020 7-2021
7-2018 7-2019 7-2020 7-2021
7-2018 7-2019 7-2020 7-2021
7-2018 7-2019 7-2020 7-2021
7-2018 7-2019 7-2020 7-2021
7-2018 7-2019 7-2020 7-2021
7-2018 7-2019 7-2020 7-2021
7-2018 7-2019 7-2020 7-2021
7-2018 7-2019 7-2020 7-2021
7-2018 7-2019 7-2020 7-2021
Activity by District
SF District 1: Northwest (Sea Cliff, Lake, Jordan Park / Laurel Heights, Outer Richmond, Central Ric The White
SF District 2: Central West (Outer Sunset, Central Sunset, Inner Sunset, Outer Parkside, Parkside, Inner Parkside, Golden Gate Heights)
SF District 3: Southwest (Pine Lake Park, Lake Shore, Merced Manor, Stonestown, Lakeside, Merced Heights, Ingleside, Ingleside Heights, Oceanview)
SF District 4: Twin Peaks W (Forest Hill (& Ext), W Portal, St Francis Wd, Balboa Terr, Mt Dav Manor, Ingleside Terr, Monterey Hts, Wstwd Pk & H'lnds, Shrwd Fst, Miraloma Pk, Dmnd Hts, Mdtwn Terr)
SF District 5: Central (Haight Ashbury, Cole Vly / Prnssus Hts, Clarndn Hts, Corona Hts, Twin Pks, Glen Pk, Noe Vly, Eureka Vly / Dolores Hts, Mission Dolores, Duboce Trngl, Buena Vista / Ashbury Hts)
SF District 6: Central North (Lower Pacific Heights, Anza Vista, Western Addition, North Panhandle, Alamo Square, Hayes Valley)
SF District 7: North (Marina, Cow Hollow, Presidio Heights, Pacific Heights)
SF District 8: Northeast (North Waterfront, North Beach, Russian Hill, Telegraph Hill, Nob Hill, Financial District / Barbary Coast, Downtown, Van Ness / Civic Center, Tenderloin)
SF District 9: Central East (Yerba Buena, South Beach, South of Market, Mission Bay, Inner Mission, Potrero Hill, Central Waterfront / Dogpatch, Bernal Heights)
SF District 10: Southeast (Outer Mission, Mission Terr, Excelsior, Portola, Bayview, Silver Terr, Hunters Pt, Candlestick Pt, Bayview Hts, Little Hollywood, Visitation Vly, Crocker Amazon)
7-2020 7-2021 + / – 7-2020 7-2021 + / – 7-2020 7-2021 + / – 7-2020 7-2021 + / – 7-2020 7-2021 + / –
Single Family
1 SF District 1 82 29 -64.6% 24 15 -37.5% $2,049,000 $2,900,000 +41.5% 33 8 -75.8% 4.7 1.5 -68.1%
2 SF District 2 97 59 -39.2% 31 53 +71.0% $1,442,000 $1,820,000 +26.2% 14 11 -21.4% 3.0 1.3 -56.7%
3 SF District 3 53 33 -37.7% 17 14 -17.6% $1,170,000 $1,600,000 +36.8% 22 18 -18.2% 4.1 2.0 -51.2%
4 SF District 4 84 41 -51.2% 34 28 -17.6% $1,599,000 $1,912,500 +19.6% 20 20 0.0% 3.7 1.1 -70.3%
5 SF District 5 159 71 -55.3% 45 39 -13.3% $2,364,412 $2,900,000 +22.7% 24 17 -29.2% 5.9 1.8 -69.5%
6 SF District 6 24 13 -45.8% 7 5 -28.6% $2,900,000 $4,750,000 +63.8% 23 12 -47.8% 6.4 2.3 -64.1%
7 SF District 7 66 39 -40.9% 11 17 +54.5% $4,267,500 $4,800,000 +12.5% 66 24 -63.6% 9.1 3.0 -67.0%
8 SF District 8 32 18 -43.8% 2 3 +50.0% $4,212,500 $2,850,000 -32.3% 30 55 +83.3% 14.5 6.8 -53.1%
9 SF District 9 102 65 -36.3% 25 31 +24.0% $1,725,000 $1,740,000 +0.9% 15 20 +33.3% 5.6 2.0 -64.3%
10 SF District 10 162 96 -40.7% 42 48 +14.3% $1,212,500 $1,200,000 -1.0% 31 26 -16.1% 4.2 1.9 -54.8%
Condo/TIC/Coop
1 SF District 1 53 26 -50.9% 20 17 -15.0% $1,290,000 $1,320,000 +2.3% 36 10 -72.2% 4.5 1.3 -71.1%
2 SF District 2 27 11 -59.3% 6 7 +16.7% $1,357,500 $1,372,500 +1.1% 30 30 0.0% 6.2 1.6 -74.2%
3 SF District 3 16 7 -56.3% 1 2 +100.0% $685,000 $710,000 +3.6% 23 19 -17.4% 5.3 1.6 -69.8%
4 SF District 4 23 16 -30.4% 6 5 -16.7% $645,000 $895,000 +38.8% 14 24 +71.4% 4.6 3.1 -32.6%
5 SF District 5 232 98 -57.8% 52 51 -1.9% $1,407,500 $1,425,000 +1.2% 32 22 -31.3% 7.1 1.7 -76.1%
6 SF District 6 165 81 -50.9% 24 38 +58.3% $1,125,000 $1,262,050 +12.2% 39 28 -28.2% 8.3 1.9 -77.1%
7 SF District 7 189 81 -57.1% 31 44 +41.9% $1,605,000 $1,625,000 +1.2% 27 24 -11.1% 8.5 2.0 -76.5%
8 SF District 8 371 236 -36.4% 40 69 +72.5% $1,217,500 $1,025,000 -15.8% 51 48 -5.9% 11.2 4.0 -64.3%
9 SF District 9 786 524 -33.3% 83 127 +53.0% $1,100,000 $1,125,000 +2.3% 42 56 +33.3% 11.6 4.3 -62.9%
10 SF District 10 64 46 -28.1% 3 5 +66.7% $973,000 $915,000 -6.0% 44 80 +81.8% 14.8 5.6 -62.2%
Key metrics by report month for the districts of San Fransisco.
Current as of August 11, 2021. All data from the San Francisco MLS. Report © 2021 ShowingTime. | 16
Active Listings Sold Listings Median Sales Price Days on Market Months Supply

Weitere ähnliche Inhalte

Was ist angesagt?

Was ist angesagt? (19)

San Francisco market focus report December 2019
San Francisco market focus report December 2019San Francisco market focus report December 2019
San Francisco market focus report December 2019
 
San Francisco Market Report December 2021
San Francisco Market Report December 2021San Francisco Market Report December 2021
San Francisco Market Report December 2021
 
San Francisco Market Report January 2022
San Francisco Market Report January 2022San Francisco Market Report January 2022
San Francisco Market Report January 2022
 
San Francisco Market Report January 2021
San Francisco Market Report January 2021San Francisco Market Report January 2021
San Francisco Market Report January 2021
 
San Francisco Market Report December 2020
San Francisco Market Report December 2020San Francisco Market Report December 2020
San Francisco Market Report December 2020
 
San Francisco Market Focus Report Nov 2020
San Francisco Market Focus Report Nov 2020San Francisco Market Focus Report Nov 2020
San Francisco Market Focus Report Nov 2020
 
San Francisco Market Data October 2020
San Francisco Market Data October 2020San Francisco Market Data October 2020
San Francisco Market Data October 2020
 
San Francisco Market Focus Report Jan 2020
San Francisco Market Focus Report Jan 2020San Francisco Market Focus Report Jan 2020
San Francisco Market Focus Report Jan 2020
 
San Francisco market report September 2020
San Francisco market report September 2020San Francisco market report September 2020
San Francisco market report September 2020
 
San Francisco market report July 2020
San Francisco market report July 2020San Francisco market report July 2020
San Francisco market report July 2020
 
San Francisco Market Focus Report December 2018
San Francisco Market Focus Report December 2018San Francisco Market Focus Report December 2018
San Francisco Market Focus Report December 2018
 
San Francisco Market Focus February 2014
San Francisco Market Focus February 2014San Francisco Market Focus February 2014
San Francisco Market Focus February 2014
 
San Francisco Market Focus Report Feb 2020
San Francisco Market Focus Report Feb 2020San Francisco Market Focus Report Feb 2020
San Francisco Market Focus Report Feb 2020
 
San Francisco market report August 2020
San Francisco market report August 2020San Francisco market report August 2020
San Francisco market report August 2020
 
Gbar monthly-market-insights-report-november20
Gbar monthly-market-insights-report-november20Gbar monthly-market-insights-report-november20
Gbar monthly-market-insights-report-november20
 
San Francisco Market Focus December 2013
San Francisco Market Focus December 2013San Francisco Market Focus December 2013
San Francisco Market Focus December 2013
 
Gbar monthly-market-insight-report-jan20
Gbar monthly-market-insight-report-jan20Gbar monthly-market-insight-report-jan20
Gbar monthly-market-insight-report-jan20
 
San Francisco Market Focus Report October 2018
San Francisco Market Focus Report October 2018San Francisco Market Focus Report October 2018
San Francisco Market Focus Report October 2018
 
San Francisco market report April 2020
San Francisco market report April 2020San Francisco market report April 2020
San Francisco market report April 2020
 

Ähnlich wie San Francisco Market Report For July 2021

Ähnlich wie San Francisco Market Report For July 2021 (18)

San Francisco Market Report August 2021
San Francisco Market Report August 2021San Francisco Market Report August 2021
San Francisco Market Report August 2021
 
San Francisco Market Report October 2022.pdf
San Francisco Market Report October 2022.pdfSan Francisco Market Report October 2022.pdf
San Francisco Market Report October 2022.pdf
 
San Francisco market report June 2020
San Francisco market report June 2020San Francisco market report June 2020
San Francisco market report June 2020
 
San Francisco Market Report March 2022
San Francisco Market Report March 2022San Francisco Market Report March 2022
San Francisco Market Report March 2022
 
San Francisco Market Report for March 2020
San Francisco Market Report for March 2020San Francisco Market Report for March 2020
San Francisco Market Report for March 2020
 
San Francisco Market Report September 2022.pdf
San Francisco Market Report September 2022.pdfSan Francisco Market Report September 2022.pdf
San Francisco Market Report September 2022.pdf
 
San Francisco Market Report February 2022
San Francisco Market Report February 2022San Francisco Market Report February 2022
San Francisco Market Report February 2022
 
San Francisco Market Report June 2022.pdf
San Francisco Market Report June 2022.pdfSan Francisco Market Report June 2022.pdf
San Francisco Market Report June 2022.pdf
 
San Francisco Market Report July 2022.pdf
San Francisco Market Report July 2022.pdfSan Francisco Market Report July 2022.pdf
San Francisco Market Report July 2022.pdf
 
San Francisco market report May 2020
San Francisco market report May 2020San Francisco market report May 2020
San Francisco market report May 2020
 
San Francisco Market Focus August 2013
San Francisco Market Focus August 2013San Francisco Market Focus August 2013
San Francisco Market Focus August 2013
 
San Francisco Market Report February 2023
San Francisco Market Report February 2023San Francisco Market Report February 2023
San Francisco Market Report February 2023
 
San Francisco Market Report November 2022.pdf
San Francisco Market Report November 2022.pdfSan Francisco Market Report November 2022.pdf
San Francisco Market Report November 2022.pdf
 
San Francisco January 2024 Market Report
San Francisco January 2024 Market ReportSan Francisco January 2024 Market Report
San Francisco January 2024 Market Report
 
San Francisco Market Focus May 2013
San Francisco Market Focus May 2013San Francisco Market Focus May 2013
San Francisco Market Focus May 2013
 
San Francisco Market Report April 2022.pdf
San Francisco Market Report April 2022.pdfSan Francisco Market Report April 2022.pdf
San Francisco Market Report April 2022.pdf
 
San Francisco Market Focus Report May
San Francisco Market Focus Report MaySan Francisco Market Focus Report May
San Francisco Market Focus Report May
 
San Francisco Market Report December 2022.pdf
San Francisco Market Report December 2022.pdfSan Francisco Market Report December 2022.pdf
San Francisco Market Report December 2022.pdf
 

Mehr von Ronny Budiutama

Mehr von Ronny Budiutama (13)

San Francisco December 2023 Market Report
San Francisco December 2023 Market ReportSan Francisco December 2023 Market Report
San Francisco December 2023 Market Report
 
San Francisco November 2023 Market Report
San Francisco November 2023 Market ReportSan Francisco November 2023 Market Report
San Francisco November 2023 Market Report
 
2023 Annual San Francisco Housing Market
2023 Annual San Francisco Housing Market2023 Annual San Francisco Housing Market
2023 Annual San Francisco Housing Market
 
October 2023 Report: San Francisco Real Estate Market Insights
October 2023 Report: San Francisco Real Estate Market InsightsOctober 2023 Report: San Francisco Real Estate Market Insights
October 2023 Report: San Francisco Real Estate Market Insights
 
CA Weekly MLS Market Data Report - August 2023
CA Weekly MLS Market Data Report - August 2023CA Weekly MLS Market Data Report - August 2023
CA Weekly MLS Market Data Report - August 2023
 
San Francisco Market Report July 2023.pdf
San Francisco Market Report July 2023.pdfSan Francisco Market Report July 2023.pdf
San Francisco Market Report July 2023.pdf
 
San Francisco May 2023 Market Report.pdf
San Francisco May 2023 Market Report.pdfSan Francisco May 2023 Market Report.pdf
San Francisco May 2023 Market Report.pdf
 
San Francisco June 2023 Market Report.pdf
San Francisco June 2023 Market Report.pdfSan Francisco June 2023 Market Report.pdf
San Francisco June 2023 Market Report.pdf
 
San Francisco Market Report March 2023.pdf
San Francisco Market Report March 2023.pdfSan Francisco Market Report March 2023.pdf
San Francisco Market Report March 2023.pdf
 
San Francisco Market Report January 2023.pdf
San Francisco Market Report January 2023.pdfSan Francisco Market Report January 2023.pdf
San Francisco Market Report January 2023.pdf
 
Annual Report on the San Francisco County Housing Market.pdf
Annual Report on the San Francisco County Housing Market.pdfAnnual Report on the San Francisco County Housing Market.pdf
Annual Report on the San Francisco County Housing Market.pdf
 
San Francisco Market Report August 2022.pdf
San Francisco Market Report August 2022.pdfSan Francisco Market Report August 2022.pdf
San Francisco Market Report August 2022.pdf
 
San Francisco Market Report May 2022.
San Francisco Market Report May 2022.San Francisco Market Report May 2022.
San Francisco Market Report May 2022.
 

Kürzlich hochgeladen

Call Girls In Krishna Nagar Delhi (Escort)↫8447779280↬@SHOT 1500- NIGHT 5500→...
Call Girls In Krishna Nagar Delhi (Escort)↫8447779280↬@SHOT 1500- NIGHT 5500→...Call Girls In Krishna Nagar Delhi (Escort)↫8447779280↬@SHOT 1500- NIGHT 5500→...
Call Girls In Krishna Nagar Delhi (Escort)↫8447779280↬@SHOT 1500- NIGHT 5500→...
asmaqueen5
 
Call Girls In Seelampur Delhi ↬8447779280}Seelampur Escorts Service In Delhi...
Call Girls In Seelampur  Delhi ↬8447779280}Seelampur Escorts Service In Delhi...Call Girls In Seelampur  Delhi ↬8447779280}Seelampur Escorts Service In Delhi...
Call Girls In Seelampur Delhi ↬8447779280}Seelampur Escorts Service In Delhi...
asmaqueen5
 
9990771857 Call Girls in Dwarka Sector 6 Delhi (Call Girls) Delhi
9990771857 Call Girls in Dwarka Sector 6 Delhi (Call Girls) Delhi9990771857 Call Girls in Dwarka Sector 6 Delhi (Call Girls) Delhi
9990771857 Call Girls in Dwarka Sector 6 Delhi (Call Girls) Delhi
delhimodel235
 
BPTP THE AMAARIO Luxury Project Invest Like Royalty in Sector 37D Gurgaon Dwa...
BPTP THE AMAARIO Luxury Project Invest Like Royalty in Sector 37D Gurgaon Dwa...BPTP THE AMAARIO Luxury Project Invest Like Royalty in Sector 37D Gurgaon Dwa...
BPTP THE AMAARIO Luxury Project Invest Like Royalty in Sector 37D Gurgaon Dwa...
ApartmentWala1
 
Best Deal Virtual Space in Satya The Hive Tata Zudio 750 Sqft 1.89 Cr All inc...
Best Deal Virtual Space in Satya The Hive Tata Zudio 750 Sqft 1.89 Cr All inc...Best Deal Virtual Space in Satya The Hive Tata Zudio 750 Sqft 1.89 Cr All inc...
Best Deal Virtual Space in Satya The Hive Tata Zudio 750 Sqft 1.89 Cr All inc...
ApartmentWala1
 
9990771857 Call Girls in Dwarka Sector 08 Delhi (Call Girls) Delhi
9990771857 Call Girls in Dwarka Sector 08 Delhi (Call Girls) Delhi9990771857 Call Girls in Dwarka Sector 08 Delhi (Call Girls) Delhi
9990771857 Call Girls in Dwarka Sector 08 Delhi (Call Girls) Delhi
delhimodel235
 
9990771857 Call Girls in Dwarka Sector 2 Delhi (Call Girls) Delhi
9990771857 Call Girls in Dwarka Sector 2 Delhi (Call Girls) Delhi9990771857 Call Girls in Dwarka Sector 2 Delhi (Call Girls) Delhi
9990771857 Call Girls in Dwarka Sector 2 Delhi (Call Girls) Delhi
delhimodel235
 
Call Girls In Vasant Vihar Delhi 💯Call Us 🔝8264348440🔝
Call Girls In Vasant Vihar Delhi 💯Call Us 🔝8264348440🔝Call Girls In Vasant Vihar Delhi 💯Call Us 🔝8264348440🔝
Call Girls In Vasant Vihar Delhi 💯Call Us 🔝8264348440🔝
soniya singh
 

Kürzlich hochgeladen (20)

Call Girls In Krishna Nagar Delhi (Escort)↫8447779280↬@SHOT 1500- NIGHT 5500→...
Call Girls In Krishna Nagar Delhi (Escort)↫8447779280↬@SHOT 1500- NIGHT 5500→...Call Girls In Krishna Nagar Delhi (Escort)↫8447779280↬@SHOT 1500- NIGHT 5500→...
Call Girls In Krishna Nagar Delhi (Escort)↫8447779280↬@SHOT 1500- NIGHT 5500→...
 
Kohinoor Hinjewadi Phase 2 Pune E-Brochure.pdf
Kohinoor Hinjewadi Phase 2 Pune  E-Brochure.pdfKohinoor Hinjewadi Phase 2 Pune  E-Brochure.pdf
Kohinoor Hinjewadi Phase 2 Pune E-Brochure.pdf
 
Call Girls In Seelampur Delhi ↬8447779280}Seelampur Escorts Service In Delhi...
Call Girls In Seelampur  Delhi ↬8447779280}Seelampur Escorts Service In Delhi...Call Girls In Seelampur  Delhi ↬8447779280}Seelampur Escorts Service In Delhi...
Call Girls In Seelampur Delhi ↬8447779280}Seelampur Escorts Service In Delhi...
 
9990771857 Call Girls in Dwarka Sector 6 Delhi (Call Girls) Delhi
9990771857 Call Girls in Dwarka Sector 6 Delhi (Call Girls) Delhi9990771857 Call Girls in Dwarka Sector 6 Delhi (Call Girls) Delhi
9990771857 Call Girls in Dwarka Sector 6 Delhi (Call Girls) Delhi
 
BPTP THE AMAARIO Luxury Project Invest Like Royalty in Sector 37D Gurgaon Dwa...
BPTP THE AMAARIO Luxury Project Invest Like Royalty in Sector 37D Gurgaon Dwa...BPTP THE AMAARIO Luxury Project Invest Like Royalty in Sector 37D Gurgaon Dwa...
BPTP THE AMAARIO Luxury Project Invest Like Royalty in Sector 37D Gurgaon Dwa...
 
Premium Villa Projects in Sarjapur Road Bengaluru
Premium Villa Projects in Sarjapur Road BengaluruPremium Villa Projects in Sarjapur Road Bengaluru
Premium Villa Projects in Sarjapur Road Bengaluru
 
Enjoy Night ≽ 8448380779 ≼ Call Girls In Huda City Centre (Gurgaon)
Enjoy Night ≽ 8448380779 ≼ Call Girls In Huda City Centre (Gurgaon)Enjoy Night ≽ 8448380779 ≼ Call Girls In Huda City Centre (Gurgaon)
Enjoy Night ≽ 8448380779 ≼ Call Girls In Huda City Centre (Gurgaon)
 
Best Deal Virtual Space in Satya The Hive Tata Zudio 750 Sqft 1.89 Cr All inc...
Best Deal Virtual Space in Satya The Hive Tata Zudio 750 Sqft 1.89 Cr All inc...Best Deal Virtual Space in Satya The Hive Tata Zudio 750 Sqft 1.89 Cr All inc...
Best Deal Virtual Space in Satya The Hive Tata Zudio 750 Sqft 1.89 Cr All inc...
 
Parksville 96 Surrey Floor Plans May 2024
Parksville 96 Surrey Floor Plans May 2024Parksville 96 Surrey Floor Plans May 2024
Parksville 96 Surrey Floor Plans May 2024
 
M3M 129 E Brochure Noida Expressway, Sector 129, Noida
M3M 129 E Brochure Noida Expressway, Sector 129, NoidaM3M 129 E Brochure Noida Expressway, Sector 129, Noida
M3M 129 E Brochure Noida Expressway, Sector 129, Noida
 
Purva Soukhyam in Guduvancheri Chennai.pdf
Purva Soukhyam in Guduvancheri Chennai.pdfPurva Soukhyam in Guduvancheri Chennai.pdf
Purva Soukhyam in Guduvancheri Chennai.pdf
 
BDSM⚡Call Girls in Sector 55 Noida Escorts >༒8448380779 Escort Service
BDSM⚡Call Girls in Sector 55 Noida Escorts >༒8448380779 Escort ServiceBDSM⚡Call Girls in Sector 55 Noida Escorts >༒8448380779 Escort Service
BDSM⚡Call Girls in Sector 55 Noida Escorts >༒8448380779 Escort Service
 
2k Shot Call girls Aiims Delhi 9205541914
2k Shot Call girls Aiims Delhi 92055419142k Shot Call girls Aiims Delhi 9205541914
2k Shot Call girls Aiims Delhi 9205541914
 
9990771857 Call Girls in Dwarka Sector 08 Delhi (Call Girls) Delhi
9990771857 Call Girls in Dwarka Sector 08 Delhi (Call Girls) Delhi9990771857 Call Girls in Dwarka Sector 08 Delhi (Call Girls) Delhi
9990771857 Call Girls in Dwarka Sector 08 Delhi (Call Girls) Delhi
 
Magarpatta Nova Elegance Mundhwa Pune E-Brochure.pdf
Magarpatta Nova Elegance Mundhwa Pune  E-Brochure.pdfMagarpatta Nova Elegance Mundhwa Pune  E-Brochure.pdf
Magarpatta Nova Elegance Mundhwa Pune E-Brochure.pdf
 
TENANT SCREENING REPORT SERVICES​ How Tenant Screening Reports Work
TENANT SCREENING REPORT SERVICES​ How Tenant Screening Reports WorkTENANT SCREENING REPORT SERVICES​ How Tenant Screening Reports Work
TENANT SCREENING REPORT SERVICES​ How Tenant Screening Reports Work
 
9990771857 Call Girls in Dwarka Sector 2 Delhi (Call Girls) Delhi
9990771857 Call Girls in Dwarka Sector 2 Delhi (Call Girls) Delhi9990771857 Call Girls in Dwarka Sector 2 Delhi (Call Girls) Delhi
9990771857 Call Girls in Dwarka Sector 2 Delhi (Call Girls) Delhi
 
Call Girls In Vasant Vihar Delhi 💯Call Us 🔝8264348440🔝
Call Girls In Vasant Vihar Delhi 💯Call Us 🔝8264348440🔝Call Girls In Vasant Vihar Delhi 💯Call Us 🔝8264348440🔝
Call Girls In Vasant Vihar Delhi 💯Call Us 🔝8264348440🔝
 
M3M The Line Brochure - Premium Investment Opportunity for Commercial Ventures
M3M The Line Brochure - Premium Investment Opportunity for Commercial VenturesM3M The Line Brochure - Premium Investment Opportunity for Commercial Ventures
M3M The Line Brochure - Premium Investment Opportunity for Commercial Ventures
 
2k Shots ≽ 9205541914 ≼ Call Girls In Sainik Farm (Delhi)
2k Shots ≽ 9205541914 ≼ Call Girls In Sainik Farm (Delhi)2k Shots ≽ 9205541914 ≼ Call Girls In Sainik Farm (Delhi)
2k Shots ≽ 9205541914 ≼ Call Girls In Sainik Farm (Delhi)
 

San Francisco Market Report For July 2021

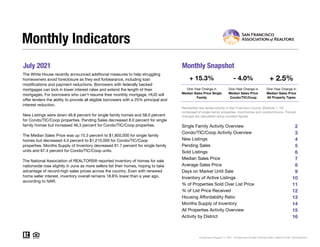
  • 1. July 2021 Monthly Snapshot One-Year Change in One-Year Change in Median Sales Price Single Family Median Sales Price Condo/TIC/Coop 2 3 4 5 6 7 8 9 10 11 12 13 14 15 16 Current as of August 11, 2021. All data from the San Francisco MLS. Report © 2021 ShowingTime. Condo/TIC/Coop Activity Overview Inventory of Active Listings % of Properties Sold Over List Price % of List Price Received Housing Affordability Ratio All Properties Activity Overview New Listings Pending Sales Sold Listings Median Sales Price Average Sales Price Days on Market Until Sale Activity by District Monthly Indicators + 15.3% - 4.0% + 2.5% One-Year Change in The White House recently announced additional measures to help struggling homeowners avoid foreclosure as they exit forbearance, including loan modifications and payment reductions. Borrowers with federally backed mortgages can lock in lower interest rates and extend the length of their mortgages. For borrowers who can’t resume their monthly mortgage, HUD will offer lenders the ability to provide all eligible borrowers with a 25% principal and interest reduction. New Listings were down 46.8 percent for single family homes and 58.0 percent for Condo/TIC/Coop properties. Pending Sales decreased 8.0 percent for single family homes but increased 46.3 percent for Condo/TIC/Coop properties. The Median Sales Price was up 15.3 percent to $1,850,000 for single family homes but decreased 4.0 percent to $1,210,000 for Condo/TIC/Coop properties. Months Supply of Inventory decreased 61.7 percent for single family units and 67.4 percent for Condo/TIC/Coop units. The National Association of REALTORS® reported inventory of homes for sale nationwide rose slightly in June as more sellers list their homes, hoping to take advantage of record-high sales prices across the country. Even with renewed home seller interest, inventory overall remains 18.8% lower than a year ago, according to NAR. Median Sales Price All Property Types Residential real estate activity in San Francisco County (Districts 1-10) composed of single-family properties, townhomes and condominiums. Percent changes are calculated using rounded figures. Single Family Activity Overview Months Supply of Inventory
  • 2. Single Family Activity Overview Key metrics by report month and for year-to-date (YTD) starting from the first of the year. Key Metrics Historical Sparkbars 7-2020 7-2021 Percent Change YTD 2020 YTD 2021 Percent Change + 5.1% 2,021 1,725 + 60.9% $1,800,000 + 11.9% + 14.1% Pending Sales 276 254 - 8.0% + 53.5% 1,182 1,814 New Listings 408 217 - 46.8% 1,923 Sold Listings 238 253 + 6.3% 1,072 Median Sales Price $1,604,000 $1,850,000 + 15.3% $1,609,000 22 - 12.0% $2,340,538 -- -- Days on Market 25 18 - 28.0% 25 Avg. Sales Price $2,013,417 $2,308,137 + 14.6% $2,051,039 Active Listings 861 464 - 46.1% -- % of Properties Sold Over List Price 64.7% 84.2% + 30.1% 66.6% 35 76.3% + 14.6% + 5.2% 31 - 11.4% 114.0% % of List Price Received 106.0% 118.6% + 11.9% 108.4% Current as of August 11, 2021. All data from the San Francisco MLS. Report © 2021 ShowingTime. | 2 Months Supply 4.7 1.8 - 61.7% -- -- -- Affordability Ratio 35 30 - 14.3% 7-2018 7-2019 7-2020 7-2021 7-2018 7-2019 7-2020 7-2021 7-2018 7-2019 7-2020 7-2021 7-2018 7-2019 7-2020 7-2021 7-2018 7-2019 7-2020 7-2021 7-2018 7-2019 7-2020 7-2021 7-2018 7-2019 7-2020 7-2021 7-2018 7-2019 7-2020 7-2021 7-2018 7-2019 7-2020 7-2021 7-2018 7-2019 7-2020 7-2021 7-2018 7-2019 7-2020 7-2021
  • 3. Condo/TIC/Coop Activity Overview Key metrics by report month and for year-to-date (YTD) starting from the first of the year. Key Metrics Historical Sparkbars 7-2020 7-2021 Percent Change YTD 2020 YTD 2021 Percent Change + 7.9% Pending Sales 242 354 + 46.3% 1,280 2,827 + 120.9% New Listings 696 292 - 58.0% 3,050 3,290 Sold Listings 266 365 + 37.2% 1,239 2,735 + 120.7% Median Sales Price $1,260,700 $1,210,000 - 4.0% $1,220,000 $1,200,000 - 1.6% - 0.3% 45 + 25.0% $1,349,153 -- -- Days on Market 38 40 + 5.3% 36 Avg. Sales Price $1,397,387 $1,358,133 - 2.8% $1,353,553 Active Listings 1,926 1,126 - 41.5% -- % of Properties Sold Over List Price 44.4% 56.4% + 27.0% 48.0% 55 46.0% - 4.2% + 1.1% 55 0.0% 103.4% % of List Price Received 101.0% 104.9% + 3.9% 102.3% Current as of August 11, 2021. All data from the San Francisco MLS. Report © 2021 ShowingTime. | 3 Months Supply 9.5 3.1 - 67.4% -- -- -- Affordability Ratio 53 54 + 1.9% 7-2018 7-2019 7-2020 7-2021 7-2018 7-2019 7-2020 7-2021 7-2018 7-2019 7-2020 7-2021 7-2018 7-2019 7-2020 7-2021 7-2018 7-2019 7-2020 7-2021 7-2018 7-2019 7-2020 7-2021 7-2018 7-2019 7-2020 7-2021 7-2018 7-2019 7-2020 7-2021 7-2018 7-2019 7-2020 7-2021 7-2018 7-2019 7-2020 7-2021 7-2018 7-2019 7-2020 7-2021
  • 4. New Listings recently announced additional Single Family Year-Over-Year Change Condo/TIC/ Coop Year-Over-Year Change Aug-2020 354 +29.7% 651 +96.7% Sep-2020 356 +1.7% 663 +27.0% Oct-2020 372 +34.3% 519 +43.4% Nov-2020 242 +43.2% 252 +49.1% Dec-2020 147 +54.7% 246 +87.8% Jan-2021 255 -1.5% 524 +37.5% Feb-2021 305 +12.1% 495 +21.9% Mar-2021 338 +94.3% 604 +136.9% Apr-2021 334 +89.8% 490 +113.0% May-2021 293 +6.5% 475 -5.6% Jun-2021 279 -22.3% 410 -29.2% Jul-2021 217 -46.8% 292 -58.0% 12-Month Avg 291 +13.1% 468 +23.1% Historical New Listings by Month Current as of August 11, 2021. All data from the San Francisco MLS. Report © 2021 ShowingTime. | 4 A count of the properties that have been newly listed on the market in a given month. 232 327 408 696 217 292 Single Family Condo/TIC/Coop July 0 200 400 600 800 1-2005 1-2006 1-2007 1-2008 1-2009 1-2010 1-2011 1-2012 1-2013 1-2014 1-2015 1-2016 1-2017 1-2018 1-2019 1-2020 1-2021 Single Family Condo/TIC/Coop 1,812 2,436 1,923 3,050 2,021 3,290 Single Family Condo/TIC/Coop Year to Date 2019 2020 2021 - 58.0% + 112.8% - 46.8% + 75.9% + 25.2% + 5.1% + 6.1% + 7.9% 2019 2020 2021 2019 2020 2021 2019 2020 2021 - 18.3% - 6.6% - 2.7% + 20.2%
  • 5. Pending Sales recently announced additional Single Family Year-Over-Year Change Condo/TIC/ Coop Year-Over-Year Change Aug-2020 235 +37.4% 322 +54.8% Sep-2020 281 +29.5% 305 +33.2% Oct-2020 311 +17.8% 333 +5.4% Nov-2020 307 +38.3% 299 +26.2% Dec-2020 208 +56.4% 307 +100.7% Jan-2021 175 +48.3% 291 +80.7% Feb-2021 225 +52.0% 380 +67.4% Mar-2021 290 +68.6% 472 +157.9% Apr-2021 285 +260.8% 478 +419.6% May-2021 309 +90.7% 459 +225.5% Jun-2021 276 +21.6% 393 +67.9% Jul-2021 254 -8.0% 354 +46.3% 12-Month Avg 263 +44.2% 366 +81.3% Historical Pending Sales by Month Current as of August 11, 2021. All data from the San Francisco MLS. Report © 2021 ShowingTime. | 5 A count of the properties on which offers have been accepted in a given month. 213 215 276 242 254 354 Single Family Condo/TIC/Coop July 0 100 200 300 400 500 1-2005 1-2006 1-2007 1-2008 1-2009 1-2010 1-2011 1-2012 1-2013 1-2014 1-2015 1-2016 1-2017 1-2018 1-2019 1-2020 1-2021 Single Family Condo/TIC/Coop 1,438 1,764 1,182 1,280 1,814 2,827 Single Family Condo/TIC/Coop Year to Date 2019 2020 2021 + 46.3% + 12.6% - 8.0% + 29.6% - 27.4% + 53.5% - 17.8% + 120.9% 2019 2020 2021 2019 2020 2021 2019 2020 2021 + 14.5% - 2.2% - 6.4% - 14.7%
  • 6. Sold Listings recently announced additional Single Family Year-Over-Year Change Condo/TIC/ Coop Year-Over-Year Change Aug-2020 243 +24.6% 240 +12.1% Sep-2020 257 +77.2% 323 +75.5% Oct-2020 305 +10.9% 292 +8.6% Nov-2020 284 +26.8% 341 +25.8% Dec-2020 302 +43.8% 353 +54.1% Jan-2021 163 +49.5% 268 +77.5% Feb-2021 163 +24.4% 278 +56.2% Mar-2021 269 +50.3% 457 +93.6% Apr-2021 288 +140.0% 459 +292.3% May-2021 266 +133.3% 440 +286.0% Jun-2021 323 +78.5% 468 +164.4% Jul-2021 253 +6.3% 365 +37.2% 12-Month Avg 260 +46.9% 357 +78.1% Historical Sold Listings by Month Current as of August 11, 2021. All data from the San Francisco MLS. Report © 2021 ShowingTime. | 6 A count of the actual sales that closed in a given month. 239 249 238 266 253 365 Single Family Condo/TIC/Coop July 0 100 200 300 400 500 1-2005 1-2006 1-2007 1-2008 1-2009 1-2010 1-2011 1-2012 1-2013 1-2014 1-2015 1-2016 1-2017 1-2018 1-2019 1-2020 1-2021 Single Family Condo/TIC/Coop 1,392 1,722 1,072 1,239 1,725 2,735 Single Family Condo/TIC/Coop Year to Date 2019 2020 2021 + 37.2% + 6.8% + 6.3% - 0.4% - 28.0% + 60.9% - 23.0% + 120.7% 2019 2020 2021 2019 2020 2021 2019 2020 2021 + 10.6% - 1.9% - 6.4% - 10.1%
  • 7. Median Sales Price recently announced additional Single Family Year-Over-Year Change Condo/TIC/ Coop Year-Over-Year Change Aug-2020 $1,625,000 +1.6% $1,210,000 -2.1% Sep-2020 $1,650,000 +8.2% $1,175,000 -9.6% Oct-2020 $1,605,000 +0.3% $1,152,500 -11.4% Nov-2020 $1,637,500 +7.2% $1,172,125 +0.2% Dec-2020 $1,550,000 +11.7% $1,100,000 -7.2% Jan-2021 $1,600,000 +9.6% $1,072,500 -7.2% Feb-2021 $1,650,000 +2.5% $1,196,500 -5.0% Mar-2021 $1,725,000 +9.5% $1,221,184 -2.3% Apr-2021 $1,800,000 +12.1% $1,200,000 -5.9% May-2021 $1,886,500 +18.8% $1,226,000 +12.7% Jun-2021 $1,950,000 +12.7% $1,250,000 +2.0% Jul-2021 $1,850,000 +15.3% $1,210,000 -4.0% 12-Month Avg* $1,715,000 +9.2% $1,195,000 -2.4% Historical Median Sales Price by Month * Median Sales Price for all properties from August 2020 through July 2021. This is not the average of the individual figures above. Current as of August 11, 2021. All data from the San Francisco MLS. Report © 2021 ShowingTime. | 7 Point at which half of the sales sold for more and half sold for less, not accounting for seller concessions, in a given month. $1,550,000 $1,200,000 $1,604,000 $1,260,700 $1,850,000 $1,210,000 Single Family Condo/TIC/Coop July $500,000 $750,000 $1,000,000 $1,250,000 $1,500,000 $1,750,000 $2,000,000 $2,250,000 1-2005 1-2006 1-2007 1-2008 1-2009 1-2010 1-2011 1-2012 1-2013 1-2014 1-2015 1-2016 1-2017 1-2018 1-2019 1-2020 1-2021 Single Family Condo/TIC/Coop $1,597,500 $1,200,000 $1,609,000 $1,220,000 $1,800,000 $1,200,000 Single Family Condo/TIC/Coop Year to Date 2019 2020 2021 - 4.0% + 5.1% + 15.3% + 3.5% + 1.7% + 11.9% + 0.7% - 1.6% 2019 2020 2021 2019 2020 2021 2019 2020 2021 - 3.1% - 0.2% + 2.7% + 8.1%
  • 8. Average Sales Price recently announced additional Single Family Year-Over-Year Change Condo/TIC/ Coop Year-Over-Year Change Aug-2020 $1,987,092 +8.7% $1,326,561 -2.7% Sep-2020 $1,896,046 -4.6% $1,306,022 -9.2% Oct-2020 $1,907,545 +1.7% $1,252,476 -12.2% Nov-2020 $2,035,750 +6.6% $1,270,960 -3.1% Dec-2020 $2,013,136 +9.0% $1,281,834 +2.7% Jan-2021 $1,951,111 -8.3% $1,209,875 -4.6% Feb-2021 $2,257,454 +18.2% $1,344,643 -0.5% Mar-2021 $2,217,011 +9.3% $1,369,434 +0.2% Apr-2021 $2,435,017 +11.5% $1,348,128 +0.1% May-2021 $2,479,992 +32.1% $1,370,558 +9.5% Jun-2021 $2,508,157 +14.0% $1,385,664 -2.1% Jul-2021 $2,308,137 +14.6% $1,358,133 -2.8% 12-Month Avg* $2,174,421 +10.5% $1,326,275 -2.1% Historical Average Sales Price by Month * Avg. Sales Price for all properties from August 2020 through July 2021. This is not the average of the individual figures above. Current as of August 11, 2021. All data from the San Francisco MLS. Report © 2021 ShowingTime. | 8 Average sales price for all closed sales, not accounting for seller concessions, in a given month. $1,908,662 $1,284,998 $2,013,417 $1,397,387 $2,308,137 $1,358,133 Single Family Condo/TIC/Coop July $500,000 $1,000,000 $1,500,000 $2,000,000 $2,500,000 $3,000,000 1-2005 1-2006 1-2007 1-2008 1-2009 1-2010 1-2011 1-2012 1-2013 1-2014 1-2015 1-2016 1-2017 1-2018 1-2019 1-2020 1-2021 Single Family Condo/TIC/Coop $2,005,170 $1,328,631 $2,051,039 $1,353,553 $2,340,538 $1,349,153 Single Family Condo/TIC/Coop Year to Date 2019 2020 2021 - 2.8% + 8.7% + 14.6% + 5.5% + 1.9% + 14.1% + 2.3% - 0.3% 2019 2020 2021 2019 2020 2021 2019 2020 2021 + 0.2% + 3.4% + 1.8% + 5.5%
  • 9. Days on Market Until Sale recently announced additional Single Family Year-Over-Year Change Condo/TIC/ Coop Year-Over-Year Change Aug-2020 24 -7.7% 40 +17.6% Sep-2020 25 -7.4% 45 +32.4% Oct-2020 27 +22.7% 41 +41.4% Nov-2020 33 +37.5% 50 +51.5% Dec-2020 35 +16.7% 62 +29.2% Jan-2021 37 +2.8% 70 +14.8% Feb-2021 30 +20.0% 62 +121.4% Mar-2021 23 +9.5% 45 +66.7% Apr-2021 19 -5.0% 45 +40.6% May-2021 18 -25.0% 36 -10.0% Jun-2021 17 -34.6% 35 +2.9% Jul-2021 18 -28.0% 40 +5.3% 12-Month Avg* 25 -0.8% 46 +28.7% Historical Days on Market Until Sale by Month * Days on Market for all properties from August 2020 through July 2021. This is not the average of the individual figures above. Current as of August 11, 2021. All data from the San Francisco MLS. Report © 2021 ShowingTime. | 9 Average number of days between when a property is listed and when an offer is accepted in a given month. 23 33 25 38 18 40 Single Family Condo/TIC/Coop July 0 20 40 60 80 100 120 1-2005 1-2006 1-2007 1-2008 1-2009 1-2010 1-2011 1-2012 1-2013 1-2014 1-2015 1-2016 1-2017 1-2018 1-2019 1-2020 1-2021 Single Family Condo/TIC/Coop 26 36 25 36 22 45 Single Family Condo/TIC/Coop Year to Date 2019 2020 2021 + 5.3% + 15.2% - 28.0% + 8.7% 0.0% - 12.0% - 3.8% + 25.0% 2019 2020 2021 2019 2020 2021 2019 2020 2021 + 9.5% + 23.8% + 16.1% + 10.0%
  • 10. Inventory of Active Listings recently announced additional Single Family Year-Over-Year Change Condo/TIC/ Coop Year-Over-Year Change Aug-2020 925 +56.8% 2,104 +125.3% Sep-2020 931 +36.9% 2,314 +103.9% Oct-2020 929 +44.3% 2,345 +114.5% Nov-2020 794 +44.4% 2,082 +123.6% Dec-2020 585 +48.9% 1,491 +108.2% Jan-2021 586 +19.6% 1,581 +81.9% Feb-2021 619 +6.0% 1,565 +58.2% Mar-2021 618 +12.2% 1,542 +54.8% Apr-2021 635 +4.4% 1,456 +36.1% May-2021 582 -15.4% 1,384 +3.2% Jun-2021 538 -31.3% 1,279 -18.3% Jul-2021 464 -46.1% 1,126 -41.5% 12-Month Avg* 684 +10.6% 1,689 +49.4% Historical Inventory of Active Listings by Month * Active Listings for all properties from August 2020 through July 2021. This is not the average of the individual figures above. Current as of August 11, 2021. All data from the San Francisco MLS. Report © 2021 ShowingTime. | 10 The number of properties available for sale in active status at the end of a given month. 519 882 861 1,926 464 1,126 Single Family Condo/TIC/Coop July 0 500 1,000 1,500 2,000 2,500 1-2005 1-2006 1-2007 1-2008 1-2009 1-2010 1-2011 1-2012 1-2013 1-2014 1-2015 1-2016 1-2017 1-2018 1-2019 1-2020 1-2021 Single Family Condo/TIC/Coop 2019 2020 2021 - 41.5% + 118.4% - 46.1% + 65.9% 2019 2020 2021 - 7.0% + 9.8%
  • 11. % of Properties Sold Over List Price recently announced additional Single Family Year-Over-Year Change Condo/TIC/ Coop Year-Over-Year Change Aug-2020 65.8% -20.3% 34.2% -40.5% Sep-2020 65.0% -12.8% 34.4% -41.4% Oct-2020 67.5% -16.0% 42.8% -33.8% Nov-2020 61.6% -20.2% 32.8% -49.2% Dec-2020 62.9% -7.9% 28.6% -38.8% Jan-2021 58.3% -6.9% 21.6% -33.5% Feb-2021 68.1% -7.1% 35.3% -44.4% Mar-2021 74.0% -5.4% 42.9% -28.7% Apr-2021 76.4% +9.1% 45.1% -24.6% May-2021 79.7% +26.1% 53.9% +28.0% Jun-2021 82.7% +49.8% 54.5% +75.2% Jul-2021 84.2% +30.1% 56.4% +27.0% 12-Month Avg 71.1% -0.9% 41.7% -21.7% Historical % of Properties Sold Over List Price by Month * % of Properties Sold Over List Price for all properties from August 2020 through July 2021. This is not the average of the individual figures above. Current as of August 11, 2021. All data from the San Francisco MLS. Report © 2021 ShowingTime. | 11 Percentage found when dividing the number of properties sold by properties sold over its original list price, not accounting for seller concessions. 82.0% 69.9% 64.7% 44.4% 84.2% 56.4% Single Family Condo/TIC/Coop July 0.0% 20.0% 40.0% 60.0% 80.0% 100.0% 1-2005 1-2006 1-2007 1-2008 1-2009 1-2010 1-2011 1-2012 1-2013 1-2014 1-2015 1-2016 1-2017 1-2018 1-2019 1-2020 1-2021 Single Family Condo/TIC/Coop 76.5% 58.9% 66.6% 48.0% 76.3% 46.0% Single Family Condo/TIC/Coop Year to Date 2019 2020 2021 + 27.0% - 36.5% + 30.1% - 21.1% - 18.5% + 14.6% - 12.9% - 4.2% 2019 2020 2021 2019 2020 2021 2019 2020 2021 - 3.8% - 6.6% - 4.4% + 11.3%
  • 12. % of List Price Received recently announced additional Single Family Year-Over-Year Change Condo/TIC/ Coop Year-Over-Year Change Aug-2020 107.5% -6.1% 100.4% -4.7% Sep-2020 106.8% -5.2% 100.2% -4.5% Oct-2020 108.1% -4.8% 101.3% -4.3% Nov-2020 106.0% -5.3% 100.2% -4.7% Dec-2020 106.0% -3.5% 99.3% -3.6% Jan-2021 105.3% -1.6% 98.6% -1.8% Feb-2021 109.7% -1.7% 100.7% -4.3% Mar-2021 112.2% -1.7% 102.4% -1.6% Apr-2021 113.9% +4.7% 103.7% -1.5% May-2021 116.8% +10.4% 105.3% +4.9% Jun-2021 116.3% +10.1% 105.3% +5.4% Jul-2021 118.6% +11.9% 104.9% +3.9% 12-Month Avg* 110.8% +0.4% 102.2% -1.3% Historical % of List Price Received by Month * % of List Price Received for all properties from August 2020 through July 2021. This is not the average of the individual figures above. Current as of August 11, 2021. All data from the San Francisco MLS. Report © 2021 ShowingTime. | 12 Percentage found when dividing a property’s sales price by its most recent list price, then taking the average for all properties sold in a given month, not accounting for seller concessions. 115.2% 107.5% 106.0% 101.0% 118.6% 104.9% Single Family Condo/TIC/Coop July 112.5% 105.5% 108.4% 102.3% 114.0% 103.4% Single Family Condo/TIC/Coop Year to Date 90.0% 100.0% 110.0% 120.0% 130.0% 1-2005 1-2006 1-2007 1-2008 1-2009 1-2010 1-2011 1-2012 1-2013 1-2014 1-2015 1-2016 1-2017 1-2018 1-2019 1-2020 1-2021 Single Family Condo/TIC/Coop 2019 2020 2021 + 3.9% - 6.0% + 11.9% - 8.0% 2019 2020 2021 - 1.8% + 0.7% 2019 2020 2021 + 1.1% - 3.0% + 5.2% - 3.6% 2019 2020 2021 - 4.6% - 1.2%
  • 13. Housing Affordability Ratio recently announced additional Single Family Year-Over-Year Change Condo/TIC/ Coop Year-Over-Year Change Aug-2020 35 +2.9% 56 +9.8% Sep-2020 35 0.0% 57 +18.8% Oct-2020 36 +5.9% 59 +20.4% Nov-2020 35 +2.9% 59 +13.5% Dec-2020 37 -2.6% 62 +19.2% Jan-2021 36 -2.7% 63 +14.5% Feb-2021 33 -2.9% 53 +3.9% Mar-2021 32 -3.0% 52 +6.1% Apr-2021 31 -8.8% 55 +7.8% May-2021 30 -14.3% 54 -8.5% Jun-2021 28 -12.5% 52 -3.7% Jul-2021 30 -14.3% 54 +1.9% 12-Month Avg* 33 -13.1% 35 +3.9% Historical Housing Affordability Ratio by Month * Affordability Ratio for all properties from August 2020 through July 2021. This is not the average of the individual figures above. Current as of August 11, 2021. All data from the San Francisco MLS. Report © 2021 ShowingTime. | 13 This index measures housing affordability for the region. For example, an index of 120 means the median household income is 120% of what is necessary to qualify for the median-priced home under prevailing interest rates. A higher number means greater affordability. 33 50 35 53 30 54 Single Family Condo/TIC/Coop July 20 40 60 80 100 1-2005 1-2006 1-2007 1-2008 1-2009 1-2010 1-2011 1-2012 1-2013 1-2014 1-2015 1-2016 1-2017 1-2018 1-2019 1-2020 1-2021 Single Family Condo/TIC/Coop 2019 2020 2021 + 1.9% + 6.0% - 14.3% + 6.1% 2019 2020 2021 + 10.0% - 2.0% 32 50 35 55 31 55 Single Family Condo/TIC/Coop Year to Date 2019 2020 2021 0.0% + 10.0% - 11.4% + 9.4% 2019 2020 2021 + 6.7% + 4.2%
  • 14. Months Supply of Inventory recently announced additional Single Family Year-Over-Year Change Condo/TIC/ Coop Year-Over-Year Change Aug-2020 4.9 +69.0% 10.0 +156.4% Sep-2020 4.8 +45.5% 10.6 +125.5% Oct-2020 4.7 +46.9% 10.7 +137.8% Nov-2020 3.9 +44.4% 9.3 +144.7% Dec-2020 2.8 +47.4% 6.3 +110.0% Jan-2021 2.7 +12.5% 6.4 +82.9% Feb-2021 2.8 -3.4% 6.0 +50.0% Mar-2021 2.7 -3.6% 5.4 +28.6% Apr-2021 2.6 -21.2% 4.6 -6.1% May-2021 2.2 -43.6% 4.0 -40.3% Jun-2021 2.0 -54.5% 3.6 -53.8% Jul-2021 1.8 -61.7% 3.1 -67.4% 12-Month Avg* 3.2 -1.3% 6.7 +31.4% Historical Months Supply of Inventory by Month * Months Supply for all properties from August 2020 through July 2021. This is not the average of the individual figures above. Current as of August 11, 2021. All data from the San Francisco MLS. Report © 2021 ShowingTime. | 14 The inventory of homes for sale at the end of a given month, divided by the average monthly pending sales from the last 12 months. 2.5 3.7 4.7 9.5 1.8 3.1 Single Family Condo/TIC/Coop July 0.0 2.0 4.0 6.0 8.0 10.0 12.0 1-2005 1-2006 1-2007 1-2008 1-2009 1-2010 1-2011 1-2012 1-2013 1-2014 1-2015 1-2016 1-2017 1-2018 1-2019 1-2020 1-2021 Single Family Condo/TIC/Coop 2019 2020 2021 - 67.4% + 156.8% - 61.7% + 88.0% 2019 2020 2021 - 3.8% + 19.4%
  • 15. All Properties Activity Overview Key metrics by report month and for year-to-date (YTD) starting from the first of the year. Key Metrics Historical Sparkbars 7-2020 7-2021 Percent Change YTD 2020 YTD 2021 Percent Change + 6.3% Pending Sales 527 615 + 16.7% 2,508 4,694 + 87.2% New Listings 1,126 524 - 53.5% 5,073 5,393 Sold Listings 512 625 + 22.1% 2,356 4,513 + 91.6% Median Sales Price $1,425,000 $1,460,000 + 2.5% $1,400,000 $1,400,000 0.0% + 3.4% 36 + 16.1% $1,732,872 -- -- Days on Market 32 31 - 3.1% 31 Avg. Sales Price $1,683,994 $1,741,439 + 3.4% $1,675,184 Active Listings 2,839 1,630 - 42.6% -- % of Properties Sold Over List Price 54.3% 67.8% + 24.9% 56.8% 40 57.7% + 1.6% + 2.3% 38 - 5.0% 107.5% % of List Price Received 103.4% 110.5% + 6.9% 105.1% Current as of August 11, 2021. All data from the San Francisco MLS. Report © 2021 ShowingTime. | 15 Months Supply 7.2 2.6 - 63.9% -- -- -- Affordability Ratio 40 38 - 5.0% 7-2018 7-2019 7-2020 7-2021 7-2018 7-2019 7-2020 7-2021 7-2018 7-2019 7-2020 7-2021 7-2018 7-2019 7-2020 7-2021 7-2018 7-2019 7-2020 7-2021 7-2018 7-2019 7-2020 7-2021 7-2018 7-2019 7-2020 7-2021 7-2018 7-2019 7-2020 7-2021 7-2018 7-2019 7-2020 7-2021 7-2018 7-2019 7-2020 7-2021 7-2018 7-2019 7-2020 7-2021
  • 16. Activity by District SF District 1: Northwest (Sea Cliff, Lake, Jordan Park / Laurel Heights, Outer Richmond, Central Ric The White SF District 2: Central West (Outer Sunset, Central Sunset, Inner Sunset, Outer Parkside, Parkside, Inner Parkside, Golden Gate Heights) SF District 3: Southwest (Pine Lake Park, Lake Shore, Merced Manor, Stonestown, Lakeside, Merced Heights, Ingleside, Ingleside Heights, Oceanview) SF District 4: Twin Peaks W (Forest Hill (& Ext), W Portal, St Francis Wd, Balboa Terr, Mt Dav Manor, Ingleside Terr, Monterey Hts, Wstwd Pk & H'lnds, Shrwd Fst, Miraloma Pk, Dmnd Hts, Mdtwn Terr) SF District 5: Central (Haight Ashbury, Cole Vly / Prnssus Hts, Clarndn Hts, Corona Hts, Twin Pks, Glen Pk, Noe Vly, Eureka Vly / Dolores Hts, Mission Dolores, Duboce Trngl, Buena Vista / Ashbury Hts) SF District 6: Central North (Lower Pacific Heights, Anza Vista, Western Addition, North Panhandle, Alamo Square, Hayes Valley) SF District 7: North (Marina, Cow Hollow, Presidio Heights, Pacific Heights) SF District 8: Northeast (North Waterfront, North Beach, Russian Hill, Telegraph Hill, Nob Hill, Financial District / Barbary Coast, Downtown, Van Ness / Civic Center, Tenderloin) SF District 9: Central East (Yerba Buena, South Beach, South of Market, Mission Bay, Inner Mission, Potrero Hill, Central Waterfront / Dogpatch, Bernal Heights) SF District 10: Southeast (Outer Mission, Mission Terr, Excelsior, Portola, Bayview, Silver Terr, Hunters Pt, Candlestick Pt, Bayview Hts, Little Hollywood, Visitation Vly, Crocker Amazon) 7-2020 7-2021 + / – 7-2020 7-2021 + / – 7-2020 7-2021 + / – 7-2020 7-2021 + / – 7-2020 7-2021 + / – Single Family 1 SF District 1 82 29 -64.6% 24 15 -37.5% $2,049,000 $2,900,000 +41.5% 33 8 -75.8% 4.7 1.5 -68.1% 2 SF District 2 97 59 -39.2% 31 53 +71.0% $1,442,000 $1,820,000 +26.2% 14 11 -21.4% 3.0 1.3 -56.7% 3 SF District 3 53 33 -37.7% 17 14 -17.6% $1,170,000 $1,600,000 +36.8% 22 18 -18.2% 4.1 2.0 -51.2% 4 SF District 4 84 41 -51.2% 34 28 -17.6% $1,599,000 $1,912,500 +19.6% 20 20 0.0% 3.7 1.1 -70.3% 5 SF District 5 159 71 -55.3% 45 39 -13.3% $2,364,412 $2,900,000 +22.7% 24 17 -29.2% 5.9 1.8 -69.5% 6 SF District 6 24 13 -45.8% 7 5 -28.6% $2,900,000 $4,750,000 +63.8% 23 12 -47.8% 6.4 2.3 -64.1% 7 SF District 7 66 39 -40.9% 11 17 +54.5% $4,267,500 $4,800,000 +12.5% 66 24 -63.6% 9.1 3.0 -67.0% 8 SF District 8 32 18 -43.8% 2 3 +50.0% $4,212,500 $2,850,000 -32.3% 30 55 +83.3% 14.5 6.8 -53.1% 9 SF District 9 102 65 -36.3% 25 31 +24.0% $1,725,000 $1,740,000 +0.9% 15 20 +33.3% 5.6 2.0 -64.3% 10 SF District 10 162 96 -40.7% 42 48 +14.3% $1,212,500 $1,200,000 -1.0% 31 26 -16.1% 4.2 1.9 -54.8% Condo/TIC/Coop 1 SF District 1 53 26 -50.9% 20 17 -15.0% $1,290,000 $1,320,000 +2.3% 36 10 -72.2% 4.5 1.3 -71.1% 2 SF District 2 27 11 -59.3% 6 7 +16.7% $1,357,500 $1,372,500 +1.1% 30 30 0.0% 6.2 1.6 -74.2% 3 SF District 3 16 7 -56.3% 1 2 +100.0% $685,000 $710,000 +3.6% 23 19 -17.4% 5.3 1.6 -69.8% 4 SF District 4 23 16 -30.4% 6 5 -16.7% $645,000 $895,000 +38.8% 14 24 +71.4% 4.6 3.1 -32.6% 5 SF District 5 232 98 -57.8% 52 51 -1.9% $1,407,500 $1,425,000 +1.2% 32 22 -31.3% 7.1 1.7 -76.1% 6 SF District 6 165 81 -50.9% 24 38 +58.3% $1,125,000 $1,262,050 +12.2% 39 28 -28.2% 8.3 1.9 -77.1% 7 SF District 7 189 81 -57.1% 31 44 +41.9% $1,605,000 $1,625,000 +1.2% 27 24 -11.1% 8.5 2.0 -76.5% 8 SF District 8 371 236 -36.4% 40 69 +72.5% $1,217,500 $1,025,000 -15.8% 51 48 -5.9% 11.2 4.0 -64.3% 9 SF District 9 786 524 -33.3% 83 127 +53.0% $1,100,000 $1,125,000 +2.3% 42 56 +33.3% 11.6 4.3 -62.9% 10 SF District 10 64 46 -28.1% 3 5 +66.7% $973,000 $915,000 -6.0% 44 80 +81.8% 14.8 5.6 -62.2% Key metrics by report month for the districts of San Fransisco. Current as of August 11, 2021. All data from the San Francisco MLS. Report © 2021 ShowingTime. | 16 Active Listings Sold Listings Median Sales Price Days on Market Months Supply