San francisco demographics report
•
0 gefällt mir•300 views

San francisco demographics report

Empfohlen
Empfohlen
Weitere ähnliche Inhalte
Andere mochten auch
Ähnlich wie San francisco demographics report
Ähnlich wie San francisco demographics report (20)
Mehr von Ronny Budiutama
Mehr von Ronny Budiutama (20)
Kürzlich hochgeladen
Kürzlich hochgeladen (20)
San francisco demographics report
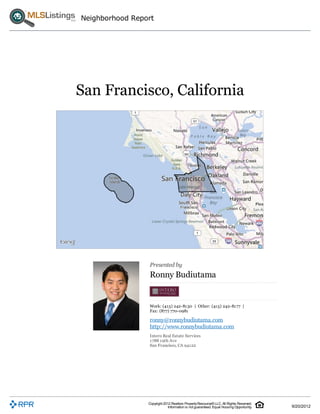
- 1. Neighborhood Report San Francisco, California Presented by Ronny Budiutama Work: (415) 242-8130 | Other: (415) 242-8177 | Fax: (877) 770-0981 ronny@ronnybudiutama.com http://www.ronnybudiutama.com Intero Real Estate Services 1788 19th Ave San Francisco, CA 94122 Copyright 2012 Realtors Property Resource® LLC. All Rights Reserved. Information is not guaranteed. Equal Housing Opportunity. 9/20/2012
- 2. Neighborhood Report San Francisco, California Neighborhood: Housing Stats and Charts San Francisco California United States Median Estimated Home Value $723,610 $302,630 – 12-Month Change 9.14% 2.32% Median List Price 699,000 269,900 159,900 List Price 1-Month Change 0.58% 2.23% 0.57% List Price 12-Month Change 7.7% 4.41% 3.16% Households 335,956 12,392,852 114,235,996 People per Household 2.31 2.89 2.59 Median Home Age 68 41 – Own 37.51% 57.39% 66.61% Rent 62.49% 42.61% 33.39% Vacancy 2.39% Median Sales Price vs. Sales Volume This chart compares the price trend and sales volume for homes in an area. Home prices typically follow sales volume, with a time lag, since sales activity is the driver behind price movements. Data Source: Public records data and MLS data where licensed from Lender Processing Services (LPS) Update Frequency: Monthly Median Sales Price Sales Volume Copyright 2012 Realtors Property Resource® LLC. All Rights Reserved. Information is not guaranteed. Equal Housing Opportunity. 9/20/2012
- 3. Neighborhood Report San Francisco, California Median Listing Price vs. Listing Volume This chart compares the listing price and listing volume for homes in an area. Listing prices often follow listing volume, with a time lag, because supply can drive price movements. Data Source: On- and off-market listings sources Update Frequency: Monthly Median List Price Listing Volume Price Range of Homes Sold This chart shows the distribution of homes reported sold in the past six months within different price ranges in the area of your search. Data Source: MLS and public records data from Lender Processing Services (LPS) Update Frequency: Monthly Sales Count By Price Range Price per Square Foot of Homes Sold This chart shows the distribution of homes reported sold in the past six months at different prices per square foot in the area of your search. Data Source: MLS and public records data from Lender Processing Services (LPS) Update Frequency: Monthly Sales Count By Price Per Sq Ft Copyright 2012 Realtors Property Resource® LLC. All Rights Reserved. Information is not guaranteed. Equal Housing Opportunity. 9/20/2012
- 4. Neighborhood Report San Francisco, California Size of Homes Sold This chart shows the distribution of homes reported sold in the past six months of different sizes in the area of your search. Data Source: MLS and public records data from Lender Processing Services (LPS) Update Frequency: Monthly Sales Count By Living Area Age Range of Homes Sold This chart shows the distribution of homes reported sold in the past six months of different age ranges in the area of your search. Data Source: MLS and public records data from Lender Processing Services (LPS) Update Frequency: Monthly Sales Count by Age of House Number of Bedrooms in Homes Sold This chart shows the distribution of homes reported sold in the past six months, according to the number of bedrooms, in the area of your search. Data Source: MLS and public records data from Lender Processing Services (LPS) Update Frequency: Monthly Sales Count by Bedroom Copyright 2012 Realtors Property Resource® LLC. All Rights Reserved. Information is not guaranteed. Equal Housing Opportunity. 9/20/2012
- 5. Neighborhood Report San Francisco, California Neighborhood: People Stats and Charts San Francisco California United States Population 789,172 36,637,290 303,965,272 Pop Density per Sq Mi 789,172 36,637,290 303,965,272 Pop Change since 2000 1.6% 8.17% 8.01% Median Age 38 35 37 Male / Female Ratio 50.65 / 49.35% 49.74 / 50.26% 49.15 / 50.85% Some High School 6% 8.93% 8.74% Ninth Grade 8.29% 10.39% 6.23% High School Graduate 14.4% 21.49% 28.99% 2 Year Degree 20.09% 29.13% 28.14% 4 Year Degree 31.48% 19.22% 17.6% Post Graduate 19.75% 10.84% 10.3% Population of Children by Age Group This chart shows the distribution of the population of children by age range — from birth to 17 — in the area of your search. Data Source: U.S. Census Update Frequency: Annually San Francisco Population of Adults by Age Group This chart shows the distribution of the population of adults by age range — from 18 to 75-plus — in the area of your search. Data Source: U.S. Census Update Frequency: Annually San Francisco Copyright 2012 Realtors Property Resource® LLC. All Rights Reserved. Information is not guaranteed. Equal Housing Opportunity. 9/20/2012
- 6. Neighborhood Report San Francisco, California Households With Children This chart shows the distribution of households with children, categorized by marital status, in the area of your search. Data Source: U.S. Census Update Frequency: Annually San Francisco Household Income Brackets This chart shows annual household income levels within an area. Data Source: U.S. Census Update Frequency: Annually San Francisco Presidential Voting Pattern This chart shows how residents of a county voted in the 2008 presidential election. Data Source: USElectionAtlas.org Update Frequency: Annually Copyright 2012 Realtors Property Resource® LLC. All Rights Reserved. Information is not guaranteed. Equal Housing Opportunity. 9/20/2012
- 7. Neighborhood Report San Francisco, California Neighborhood: Economic Stats and Charts San Francisco California United States Income per Capita $45,478 $29,188 $27,334 Median Hosehold Income $71,304 $60,883 $51,914 Unemployment Rate 7.6% 10.9% Total Building Permits – 27,178 463,440 Building Permits Change 2.14% 1.6% Value of Building Permits – 9,120,591,000 101,943,056,000 Value of Building Permits Change 17.56% 6.85% Median Sales Price vs. Unemployment This chart shows the relationship between employment and home prices in a metro area. Employment is a good measure of the strength of the local economy. Generally speaking, the better the job market, the more likely home prices are rising. Data Source: Moody's Analytics: economy.com Update Frequency: Quarterly Median Sales Price Unemployment Unemployment Rate This chart shows the unemployment trend in the area of your search. The unemployment rate is an important driver behind the housing market. Data Source: Bureau of Labor Statistics Update Frequency: Quarterly San Francisco California Copyright 2012 Realtors Property Resource® LLC. All Rights Reserved. Information is not guaranteed. Equal Housing Opportunity. 9/20/2012
- 8. Neighborhood Report San Francisco, California Renter-Occupied vs. Owner Occupied Households This chart shows the number of rental vacancies in the area of your search. Data Source: USPS Vacancy Quarterly Update Frequency: Quarterly San Francisco Occupational Categories This chart shows categories of employment within an area. Data Source: U.S. Census Update Frequency: Annually San Francisco Copyright 2012 Realtors Property Resource® LLC. All Rights Reserved. Information is not guaranteed. Equal Housing Opportunity. 9/20/2012
- 9. Neighborhood Report San Francisco, California Neighborhood: Quality of Life Stats and Charts Quality of Life in 94102 San Francisco California United States Altitude 62 – – Rainfall 25.02 24.31 – Snowfall 0.05 19.9 – Sunny Days 165 158 – Average Travel Time to Work 29 27 25 Average Commute Time This chart shows average commute times to work, in minutes, by percentage of an area's population. Data Source: U.S. Census Update Frequency: Annually San Francisco How People Get to Work This chart shows the types of transportation that residents of the area you searched use for their commute. Data Source: U.S. Census Update Frequency: Annually Average Monthly Temperature This chart shows average temperatures in the area you searched. Data Source: NOAA Update Frequency: Annually Copyright 2012 Realtors Property Resource® LLC. All Rights Reserved. Information is not guaranteed. Equal Housing Opportunity. 9/20/2012