San Fancisco Market Focus Report June 2019
•
0 gefällt mir•296 views

San Fancisco Market Focus Report June 2019

Empfohlen
Empfohlen
Weitere ähnliche Inhalte
Was ist angesagt?
Was ist angesagt? (20)
Ähnlich wie San Fancisco Market Focus Report June 2019
Ähnlich wie San Fancisco Market Focus Report June 2019 (14)
Mehr von Ronny Budiutama
Mehr von Ronny Budiutama (20)
Kürzlich hochgeladen
Kürzlich hochgeladen (20)
San Fancisco Market Focus Report June 2019
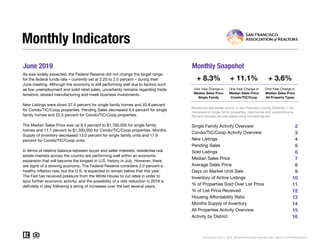
- 1. June 2019 Monthly Snapshot One-Year Change in One-Year Change in Median Sales Price Single Family Median Sales Price Condo/TIC/Coop 2 3 4 5 6 7 8 9 10 11 12 13 14 15 16 Monthly Indicators + 8.3% + 11.1% + 3.6% One-Year Change in As was widely expected, the Federal Reserve did not change the target range for the federal funds rate – currently set at 2.25 to 2.5 percent – during their June meeting. Although the economy is still performing well due to factors such as low unemployment and solid retail sales, uncertainty remains regarding trade tensions, slowed manufacturing and meek business investments. New Listings were down 37.4 percent for single family homes and 40.8 percent for Condo/TIC/Coop properties. Pending Sales decreased 5.4 percent for single family homes and 22.5 percent for Condo/TIC/Coop properties. The Median Sales Price was up 8.3 percent to $1,760,000 for single family homes and 11.1 percent to $1,300,000 for Condo/TIC/Coop properties. Months Supply of Inventory decreased 13.0 percent for single family units and 17.9 percent for Condo/TIC/Coop units. In terms of relative balance between buyer and seller interests, residential real estate markets across the country are performing well within an economic expansion that will become the longest in U.S. history in July. However, there are signs of a slowing economy. The Federal Reserve considers 2.0 percent a healthy inflation rate, but the U.S. is expected to remain below that this year. The Fed has received pressure from the White House to cut rates in order to spur further economic activity, and the possibility of a rate reduction in 2019 is definitely in play following a string of increases over the last several years. Median Sales Price All Property Types Residential real estate activity in San Francisco County (Districts 1-10) composed of single-family properties, townhomes and condominiums. Percent changes are calculated using rounded figures. Single Family Activity Overview Months Supply of Inventory Current as of July 11, 2019. All data from the San Francisco MLS. Report © 2019 ShowingTime. Condo/TIC/Coop Activity Overview Inventory of Active Listings % of Properties Sold Over List Price % of List Price Received Housing Affordability Ratio All Properties Activity Overview New Listings Pending Sales Sold Listings Median Sales Price Average Sales Price Days on Market Until Sale Activity by District
- 2. Single Family Activity Overview Key metrics by report month and for year-to-date (YTD) starting from the first of the year. Key Metrics Historical Sparkbars 6-2018 6-2019 Percent Change YTD 2018 YTD 2019 Percent Change Current as of July 11, 2019. All data from the San Francisco MLS. Report © 2019 ShowingTime. | 2 Months Supply 2.3 2.0 - 13.0% -- -- -- Affordability Ratio 30 29 - 3.3% % of List Price Received 120.1% 115.8% - 3.6% 118.2% 30 75.9% - 6.6% - 5.0% 31 + 3.3% 112.3% % of Properties Sold Over List Price 88.3% 83.4% - 5.5% 81.3% Active Listings 429 362 - 15.6% -- Avg. Sales Price $1,943,346 $2,172,580 + 11.8% $2,007,886 Days on Market 18 22 + 22.2% 21 26 + 23.8% $2,085,637 -- -- Median Sales Price $1,625,000 $1,760,000 + 8.3% $1,620,000 Sold Listings 231 181 - 21.6% 1,072 New Listings 265 166 - 37.4% 1,481 Pending Sales 204 193 - 5.4% - 3.4%1,146 1,107 - 13.0%1,288 1,029 - 4.0% $1,608,000 - 0.7% + 3.9% 6-2016 6-2017 6-2018 6-2019 6-2016 6-2017 6-2018 6-2019 6-2016 6-2017 6-2018 6-2019 6-2016 6-2017 6-2018 6-2019 6-2016 6-2017 6-2018 6-2019 6-2016 6-2017 6-2018 6-2019 6-2016 6-2017 6-2018 6-2019 6-2016 6-2017 6-2018 6-2019 6-2016 6-2017 6-2018 6-2019 6-2016 6-2017 6-2018 6-2019 6-2016 6-2017 6-2018 6-2019
- 3. Condo/TIC/Coop Activity Overview Key metrics by report month and for year-to-date (YTD) starting from the first of the year. Key Metrics Historical Sparkbars 6-2018 6-2019 Percent Change YTD 2018 YTD 2019 Percent Change Current as of July 11, 2019. All data from the San Francisco MLS. Report © 2019 ShowingTime. | 3 Months Supply 2.8 2.3 - 17.9% -- -- -- Affordability Ratio 48 45 - 6.3% % of List Price Received 107.3% 107.5% + 0.2% 107.0% 47 58.1% - 5.7% - 1.4% 48 + 2.1% 105.5% % of Properties Sold Over List Price 68.3% 65.6% - 4.0% 61.6% Active Listings 716 556 - 22.3% -- Avg. Sales Price $1,337,494 $1,445,142 + 8.0% $1,344,754 Days on Market 27 31 + 14.8% 31 $1,211,000 + 0.5% + 0.5% 36 + 16.1% $1,351,875 -- -- Sold Listings 303 253 - 16.5% 1,551 1,450 - 6.5% Median Sales Price $1,170,000 $1,300,000 + 11.1% $1,205,000 - 14.5% Pending Sales 302 234 - 22.5% 1,626 1,530 - 5.9% New Listings 358 212 - 40.8% 2,211 1,890 6-2016 6-2017 6-2018 6-2019 6-2016 6-2017 6-2018 6-2019 6-2016 6-2017 6-2018 6-2019 6-2016 6-2017 6-2018 6-2019 6-2016 6-2017 6-2018 6-2019 6-2016 6-2017 6-2018 6-2019 6-2016 6-2017 6-2018 6-2019 6-2016 6-2017 6-2018 6-2019 6-2016 6-2017 6-2018 6-2019 6-2016 6-2017 6-2018 6-2019 6-2016 6-2017 6-2018 6-2019
- 4. New Listings New Listings Single Family Year-Over-Year Change Condo/TIC/ Coop Year-Over-Year Change Jul-2018 239 +13.3% 260 -5.1% Aug-2018 249 +16.4% 311 +6.1% Sep-2018 338 +12.3% 452 +3.0% Oct-2018 258 +7.9% 341 +3.6% Nov-2018 158 +9.0% 195 -6.7% Dec-2018 81 +3.8% 122 -5.4% Jan-2019 220 +17.0% 350 -5.1% Feb-2019 185 -11.1% 300 -16.0% Mar-2019 230 -17.3% 339 -10.6% Apr-2019 236 -12.9% 361 -4.5% May-2019 251 -7.4% 328 -11.4% Jun-2019 166 -37.4% 212 -40.8% 12-Month Avg 218 -2.2% 298 -8.1% Historical New Listings by Month Current as of July 11, 2019. All data from the San Francisco MLS. Report © 2019 ShowingTime. | 4 A count of the properties that have been newly listed on the market in a given month. 238 313 265 358 166 212 Single Family Condo/TIC/Coop June 0 100 200 300 400 500 600 700 1-2005 1-2006 1-2007 1-2008 1-2009 1-2010 1-2011 1-2012 1-2013 1-2014 1-2015 1-2016 1-2017 1-2018 1-2019 Single Family Condo/TIC/Coop 1,413 1,969 1,481 2,211 1,288 1,890 Single Family Condo/TIC/Coop Year to Date 2017 2018 2019 - 40.8%+ 14.4%- 37.4%+ 11.3% + 12.3%- 13.0%+ 4.8% - 14.5% 2017 2018 2019 2017 2018 2019 2017 2018 2019 0.0% - 3.3% - 9.0%- 23.3%
- 5. Pending Sales Pending Sales Single Family Year-Over-Year Change Condo/TIC/ Coop Year-Over-Year Change Jul-2018 165 -4.6% 247 +18.2% Aug-2018 172 -16.5% 232 +9.4% Sep-2018 193 -5.4% 219 -10.2% Oct-2018 251 +1.2% 291 -11.8% Nov-2018 187 -5.6% 222 -5.1% Dec-2018 121 +13.1% 147 -23.4% Jan-2019 89 +2.3% 121 -32.8% Feb-2019 144 -8.9% 228 +1.8% Mar-2019 210 -2.3% 299 -11.0% Apr-2019 223 +7.7% 314 +9.4% May-2019 248 -9.8% 334 +12.5% Jun-2019 193 -5.4% 234 -22.5% 12-Month Avg 183 -3.8% 241 -5.2% Historical Pending Sales by Month A count of the properties on which offers have been accepted in a given month. Current as of July 11, 2019. All data from the San Francisco MLS. Report © 2019 ShowingTime. | 5 249 290 204 302 193 234 Single Family Condo/TIC/Coop June 0 100 200 300 400 1-2005 1-2006 1-2007 1-2008 1-2009 1-2010 1-2011 1-2012 1-2013 1-2014 1-2015 1-2016 1-2017 1-2018 1-2019 Single Family Condo/TIC/Coop 1,128 1,479 1,146 1,626 1,107 1,530 Single Family Condo/TIC/Coop Year to Date 2017 2018 2019 - 22.5%+ 4.1%- 5.4%- 18.1% + 9.9%- 3.4%+ 1.6% - 5.9% 2017 2018 2019 2017 2018 2019 2017 2018 2019 + 8.7% + 1.5% + 6.7%+ 11.1%
- 6. Sold Listings Sold Listings Single Family Year-Over-Year Change Condo/TIC/ Coop Year-Over-Year Change Jul-2018 192 -8.6% 273 +14.2% Aug-2018 192 -9.9% 260 +18.7% Sep-2018 147 -16.9% 183 +4.6% Oct-2018 248 +6.0% 293 -5.8% Nov-2018 220 -10.2% 264 -5.0% Dec-2018 160 +7.4% 194 -22.4% Jan-2019 100 +5.3% 114 -23.5% Feb-2019 113 +5.6% 164 -18.8% Mar-2019 172 -14.0% 264 -8.7% Apr-2019 226 +18.9% 318 +7.4% May-2019 237 -4.8% 337 +8.0% Jun-2019 181 -21.6% 253 -16.5% 12-Month Avg 182 -4.9% 243 -3.5% Historical Sold Listings by Month A count of the actual sales that closed in a given month. Current as of July 11, 2019. All data from the San Francisco MLS. Report © 2019 ShowingTime. | 6 230 324 231 303 181 253 Single Family Condo/TIC/Coop June 0 100 200 300 400 1-2005 1-2006 1-2007 1-2008 1-2009 1-2010 1-2011 1-2012 1-2013 1-2014 1-2015 1-2016 1-2017 1-2018 1-2019 Single Family Condo/TIC/Coop 1,041 1,422 1,072 1,551 1,029 1,450 Single Family Condo/TIC/Coop Year to Date 2017 2018 2019 - 16.5%- 6.5%- 21.6%+ 0.4% + 9.1%- 4.0%+ 3.0% - 6.5% 2017 2018 2019 2017 2018 2019 2017 2018 2019 - 6.5% + 2.2% + 8.1%+ 20.9%
- 7. Median Sales Price Median Sales Price Single Family Year-Over-Year Change Condo/TIC/ Coop Year-Over-Year Change Jul-2018 $1,626,250 +16.2% $1,150,000 0.0% Aug-2018 $1,544,000 +12.3% $1,234,400 +5.1% Sep-2018 $1,500,000 +13.6% $1,150,000 +5.0% Oct-2018 $1,600,000 +1.6% $1,215,000 +6.6% Nov-2018 $1,427,500 -4.5% $1,193,625 -3.5% Dec-2018 $1,492,500 +2.9% $1,170,000 +4.5% Jan-2019 $1,389,000 +4.4% $1,040,000 -5.5% Feb-2019 $1,500,000 -11.8% $1,130,000 +4.1% Mar-2019 $1,650,000 -2.2% $1,247,500 -0.2% Apr-2019 $1,612,500 -2.2% $1,222,500 -2.2% May-2019 $1,695,000 +4.7% $1,245,000 -1.0% Jun-2019 $1,760,000 +8.3% $1,300,000 +11.1% 12-Month Avg* $1,579,500 +4.6% $1,200,000 +1.7% Historical Median Sales Price by Month Point at which half of the sales sold for more and half sold for less, not accounting for seller concessions, in a given month. * Median Sales Price for all properties from July 2018 through June 2019. This is not the average of the individual figures above. Current as of July 11, 2019. All data from the San Francisco MLS. Report © 2019 ShowingTime. | 7 $1,461,000 $1,125,000 $1,625,000 $1,170,000 $1,760,000 $1,300,000 Single Family Condo/TIC/Coop June $500,000 $750,000 $1,000,000 $1,250,000 $1,500,000 $1,750,000 $2,000,000 1-2005 1-2006 1-2007 1-2008 1-2009 1-2010 1-2011 1-2012 1-2013 1-2014 1-2015 1-2016 1-2017 1-2018 1-2019 Single Family Condo/TIC/Coop $1,400,000 $1,125,000 $1,620,000 $1,205,000 $1,608,000 $1,211,000 Single Family Condo/TIC/Coop Year to Date 2017 2018 2019 + 11.1%+ 4.0%+ 8.3%+ 11.2% + 7.1%- 0.7%+ 15.7% + 0.5% 2017 2018 2019 2017 2018 2019 2017 2018 2019 + 9.8% + 4.4% + 1.8%- 4.3%
- 8. Average Sales Price Avg. Sales Price Single Family Year-Over-Year Change Condo/TIC/ Coop Year-Over-Year Change Jul-2018 $1,969,483 +13.3% $1,242,275 -0.1% Aug-2018 $1,834,962 +17.6% $1,347,161 +6.1% Sep-2018 $1,819,330 +12.9% $1,255,936 +3.2% Oct-2018 $2,152,125 +7.5% $1,343,310 +5.3% Nov-2018 $1,864,335 +6.2% $1,263,347 -8.9% Dec-2018 $1,786,072 -6.4% $1,329,973 +5.2% Jan-2019 $1,751,963 -2.0% $1,177,310 -10.9% Feb-2019 $1,871,058 -11.2% $1,363,140 +7.8% Mar-2019 $2,046,399 +5.0% $1,338,592 -2.4% Apr-2019 $2,235,456 +2.3% $1,363,076 +2.1% May-2019 $2,147,949 +6.3% $1,335,263 -4.6% Jun-2019 $2,172,580 +11.8% $1,445,142 +8.0% 12-Month Avg* $1,998,934 +6.5% $1,324,850 +0.8% Historical Average Sales Price by Month Average sales price for all closed sales, not accounting for seller concessions, in a given month. * Avg. Sales Price for all properties from July 2018 through June 2019. This is not the average of the individual figures above. Current as of July 11, 2019. All data from the San Francisco MLS. Report © 2019 ShowingTime. | 8 $1,727,201 $1,351,503 $1,943,346 $1,337,494 $2,172,580 $1,445,142 Single Family Condo/TIC/Coop June $500,000 $1,000,000 $1,500,000 $2,000,000 $2,500,000 1-2005 1-2006 1-2007 1-2008 1-2009 1-2010 1-2011 1-2012 1-2013 1-2014 1-2015 1-2016 1-2017 1-2018 1-2019 Single Family Condo/TIC/Coop $1,792,836 $1,308,456 $2,007,886 $1,344,754 $2,085,637 $1,351,875 Single Family Condo/TIC/Coop Year to Date 2017 2018 2019 + 8.0%- 1.0%+ 11.8%+ 12.5% + 2.8%+ 3.9%+ 12.0% + 0.5% 2017 2018 2019 2017 2018 2019 2017 2018 2019 - 1.4% + 5.2% + 4.3%+ 10.9%
- 9. Days on Market Until Sale Days on Market Single Family Year-Over-Year Change Condo/TIC/ Coop Year-Over-Year Change Jul-2018 21 -12.5% 31 -6.1% Aug-2018 22 -18.5% 36 -12.2% Sep-2018 24 -14.3% 30 -28.6% Oct-2018 24 +9.1% 27 -12.9% Nov-2018 26 0.0% 38 +8.6% Dec-2018 33 +17.9% 44 -2.2% Jan-2019 39 +18.2% 55 0.0% Feb-2019 29 +31.8% 40 +8.1% Mar-2019 26 +18.2% 35 +34.6% Apr-2019 26 +44.4% 38 +46.2% May-2019 22 +10.0% 29 +7.4% Jun-2019 22 +22.2% 31 +14.8% 12-Month Avg* 25 +7.9% 35 +2.5% Historical Days on Market Until Sale by Month Average number of days between when a property is listed and when an offer is accepted in a given month. * Days on Market for all properties from July 2018 through June 2019. This is not the average of the individual figures above. Current as of July 11, 2019. All data from the San Francisco MLS. Report © 2019 ShowingTime. | 9 27 37 18 27 22 31 Single Family Condo/TIC/Coop June 0 20 40 60 80 100 120 1-2005 1-2006 1-2007 1-2008 1-2009 1-2010 1-2011 1-2012 1-2013 1-2014 1-2015 1-2016 1-2017 1-2018 1-2019 Single Family Condo/TIC/Coop 29 37 21 31 26 36 Single Family Condo/TIC/Coop Year to Date 2017 2018 2019 + 14.8%- 27.0%+ 22.2%- 33.3% - 16.2%+ 23.8%- 27.6% + 16.1% 2017 2018 2019 2017 2018 2019 2017 2018 2019 - 6.9% - 3.3% + 5.7%+ 5.7%
- 10. Inventory of Active Listings Active Listings Single Family Year-Over-Year Change Condo/TIC/ Coop Year-Over-Year Change Jul-2018 461 +17.6% 656 +8.8% Aug-2018 489 +32.5% 669 +9.3% Sep-2018 590 +35.9% 847 +12.0% Oct-2018 539 +33.7% 832 +20.9% Nov-2018 460 +42.0% 710 +18.9% Dec-2018 324 +44.6% 503 +21.2% Jan-2019 439 +38.1% 676 +16.6% Feb-2019 448 +27.6% 700 +6.5% Mar-2019 445 +12.7% 683 +4.3% Apr-2019 442 +2.3% 685 -2.7% May-2019 411 +1.5% 639 -11.7% Jun-2019 362 -15.6% 556 -22.3% 12-Month Avg* 451 +20.9% 680 +5.8% Historical Inventory of Active Listings by Month The number of properties available for sale in active status at the end of a given month. * Active Listings for all properties from July 2018 through June 2019. This is not the average of the individual figures above. Current as of July 11, 2019. All data from the San Francisco MLS. Report © 2019 ShowingTime. | 10 384 614 429 716 362 556 Single Family Condo/TIC/Coop June 0 250 500 750 1,000 1,250 1,500 1-2005 1-2006 1-2007 1-2008 1-2009 1-2010 1-2011 1-2012 1-2013 1-2014 1-2015 1-2016 1-2017 1-2018 1-2019 Single Family Condo/TIC/Coop 2017 2018 2019 - 22.3%+ 16.6%- 15.6%+ 11.7% 2017 2018 2019 - 10.3% - 20.6%
- 11. % of Properties Sold Over List Price % of Properties Sold Over List Price Single Family Year-Over-Year Change Condo/TIC/ Coop Year-Over-Year Change Jul-2018 85.4% +4.9% 63.4% +1.0% Aug-2018 80.2% +2.3% 57.7% -4.9% Sep-2018 81.6% -5.0% 63.4% +19.4% Oct-2018 82.7% -1.3% 68.3% +2.6% Nov-2018 73.6% -8.9% 54.5% -6.5% Dec-2018 68.1% -7.0% 45.9% -15.6% Jan-2019 60.0% -14.9% 41.2% +22.6% Feb-2019 77.9% -3.1% 53.0% -10.0% Mar-2019 73.3% -5.4% 56.1% -5.2% Apr-2019 73.9% -5.1% 55.3% -17.0% May-2019 79.7% -5.9% 64.7% -4.3% Jun-2019 83.4% -5.5% 65.6% -4.0% 12-Month Avg 77.5% -4.4% 58.8% -3.3% Historical % of Properties Sold Over List Price by Month Percentage found when dividing the number of properties sold by properties sold over its original list price, not accounting for seller concessions. * % of Properties Sold Over List Price for all properties from July 2018 through June 2019. This is not the average of the individual figures above. Current as of July 11, 2019. All data from the San Francisco MLS. Report © 2019 ShowingTime. | 11 80.0% 58.6% 88.3% 68.3% 83.4% 65.6% Single Family Condo/TIC/Coop June 0.0% 20.0% 40.0% 60.0% 80.0% 100.0% 1-2005 1-2006 1-2007 1-2008 1-2009 1-2010 1-2011 1-2012 1-2013 1-2014 1-2015 1-2016 1-2017 1-2018 1-2019 Single Family Condo/TIC/Coop 76.4% 58.1% 81.3% 61.6% 75.9% 58.1% Single Family Condo/TIC/Coop Year to Date 2017 2018 2019 - 4.0%+ 16.6%- 5.5%+ 10.4% + 6.0%- 6.6%+ 6.4% - 5.7% 2017 2018 2019 2017 2018 2019 2017 2018 2019 + 11.1% - 0.4% - 7.0%- 6.5%
- 12. % of List Price Received % of List Price Received Single Family Year-Over-Year Change Condo/TIC/ Coop Year-Over-Year Change Jul-2018 117.2% +0.1% 107.1% +1.0% Aug-2018 114.7% -0.6% 105.6% -0.1% Sep-2018 115.3% -0.9% 106.5% +1.6% Oct-2018 114.0% -1.4% 107.7% +1.0% Nov-2018 111.2% -3.7% 104.1% -0.4% Dec-2018 110.5% -3.3% 102.1% -1.6% Jan-2019 106.0% -5.6% 101.0% -0.7% Feb-2019 112.6% -2.8% 104.2% -0.9% Mar-2019 110.5% -6.0% 104.7% -2.2% Apr-2019 112.4% -5.8% 104.9% -3.7% May-2019 113.4% -5.1% 107.3% -1.0% Jun-2019 115.8% -3.6% 107.5% +0.2% 12-Month Avg* 113.1% -3.3% 105.6% -0.5% Historical % of List Price Received by Month Percentage found when dividing a property’s sales price by its most recent list price, then taking the average for all properties sold in a given month, not accounting for seller concessions. * % of List Price Received for all properties from July 2018 through June 2019. This is not the average of the individual figures above. Current as of July 11, 2019. All data from the San Francisco MLS. Report © 2019 ShowingTime. | 12 116.8% 105.8% 120.1% 107.3% 115.8% 107.5% Single Family Condo/TIC/Coop June 114.2% 104.7% 118.2% 107.0% 112.3% 105.5% Single Family Condo/TIC/Coop Year to Date 90.0% 100.0% 110.0% 120.0% 130.0% 1-2005 1-2006 1-2007 1-2008 1-2009 1-2010 1-2011 1-2012 1-2013 1-2014 1-2015 1-2016 1-2017 1-2018 1-2019 Single Family Condo/TIC/Coop 2017 2018 2019 + 0.2%+ 1.4%- 3.6%+ 2.8% 2017 2018 2019 + 5.9% + 0.5% 2017 2018 2019 - 1.4%+ 2.2%- 5.0%+ 3.5% 2017 2018 2019 + 1.2% - 0.8%
- 13. Housing Affordability Ratio Affordability Ratio Single Family Year-Over-Year Change Condo/TIC/ Coop Year-Over-Year Change Jul-2018 30 -18.9% 49 -5.8% Aug-2018 31 -18.4% 45 -13.5% Sep-2018 31 -20.5% 47 -14.5% Oct-2018 28 -12.5% 41 -21.2% Nov-2018 32 -8.6% 43 -12.2% Dec-2018 33 -5.7% 48 -9.4% Jan-2019 35 -5.4% 54 +3.8% Feb-2019 33 +13.8% 51 -3.8% Mar-2019 30 +3.4% 46 0.0% Apr-2019 31 +6.9% 48 +6.7% May-2019 30 0.0% 47 +6.8% Jun-2019 29 -3.3% 45 -6.3% 12-Month Avg* 31 -13.3% 33 -10.1% Historical Housing Affordability Ratio by Month This index measures housing affordability for the region. For example, an index of 120 means the median household income is 120% of what is necessary to qualify for the median-priced home under prevailing interest rates. A higher number means greater affordability. * Affordability Ratio for all properties from July 2018 through June 2019. This is not the average of the individual figures above. Current as of July 11, 2019. All data from the San Francisco MLS. Report © 2019 ShowingTime. | 13 35 53 30 48 29 45 Single Family Condo/TIC/Coop June 20 40 60 80 100 1-2005 1-2006 1-2007 1-2008 1-2009 1-2010 1-2011 1-2012 1-2013 1-2014 1-2015 1-2016 1-2017 1-2018 1-2019 Single Family Condo/TIC/Coop 2017 2018 2019 - 6.3%- 9.4%- 3.3%- 14.3% 2017 2018 2019 - 12.5% 0.0% 37 53 30 47 31 48 Single Family Condo/TIC/Coop Year to Date 2017 2018 2019 + 2.1%- 11.3%+ 3.3%- 18.9% 2017 2018 2019 - 7.5% - 5.4%
- 14. Months Supply of Inventory Months Supply Single Family Year-Over-Year Change Condo/TIC/ Coop Year-Over-Year Change Jul-2018 2.4 +14.3% 2.6 0.0% Aug-2018 2.6 +30.0% 2.6 0.0% Sep-2018 3.2 +39.1% 3.3 +3.1% Oct-2018 2.9 +38.1% 3.3 +17.9% Nov-2018 2.5 +47.1% 2.8 +12.0% Dec-2018 1.7 +41.7% 2.0 +17.6% Jan-2019 2.4 +41.2% 2.8 +16.7% Feb-2019 2.4 +33.3% 2.9 +7.4% Mar-2019 2.4 +14.3% 2.8 +7.7% Apr-2019 2.4 +4.3% 2.8 0.0% May-2019 2.2 +4.8% 2.6 -10.3% Jun-2019 2.0 -13.0% 2.3 -17.9% 12-Month Avg* 2.4 +23.4% 2.7 +3.8% Historical Months Supply of Inventory by Month The inventory of homes for sale at the end of a given month, divided by the average monthly pending sales from the last 12 months. * Months Supply for all properties from July 2018 through June 2019. This is not the average of the individual figures above. Current as of July 11, 2019. All data from the San Francisco MLS. Report © 2019 ShowingTime. | 14 2.1 2.6 2.3 2.8 2.0 2.3 Single Family Condo/TIC/Coop June 0.0 2.0 4.0 6.0 8.0 10.0 1-2005 1-2006 1-2007 1-2008 1-2009 1-2010 1-2011 1-2012 1-2013 1-2014 1-2015 1-2016 1-2017 1-2018 1-2019 Single Family Condo/TIC/Coop 2017 2018 2019 - 17.9%+ 7.7%- 13.0%+ 9.5% 2017 2018 2019 - 4.5% - 21.2%
- 15. All Properties Activity Overview Key metrics by report month and for year-to-date (YTD) starting from the first of the year. Key Metrics Historical Sparkbars 6-2018 6-2019 Percent Change YTD 2018 YTD 2019 Percent Change Current as of July 11, 2019. All data from the San Francisco MLS. Report © 2019 ShowingTime. | 15 Months Supply 2.6 2.2 - 15.4% -- -- -- Affordability Ratio 35 34 - 2.9% % of List Price Received 112.9% 110.9% - 1.8% 111.6% 35 65.5% - 5.9% - 3.0% 36 + 2.9% 108.3% % of Properties Sold Over List Price 77.0% 73.0% - 5.2% 69.6% Active Listings 1,145 918 - 19.8% -- Avg. Sales Price $1,599,576 $1,748,521 + 9.3% $1,615,771 Days on Market 23 27 + 17.4% 27 $1,375,000 + 0.7% + 2.5% 32 + 18.5% $1,656,450 -- -- Sold Listings 534 434 - 18.7% 2,623 2,479 - 5.5% Median Sales Price $1,390,250 $1,440,000 + 3.6% $1,365,000 - 13.9% Pending Sales 506 427 - 15.6% 2,772 2,637 - 4.9% New Listings 623 378 - 39.3% 3,692 3,178 6-2016 6-2017 6-2018 6-2019 6-2016 6-2017 6-2018 6-2019 6-2016 6-2017 6-2018 6-2019 6-2016 6-2017 6-2018 6-2019 6-2016 6-2017 6-2018 6-2019 6-2016 6-2017 6-2018 6-2019 6-2016 6-2017 6-2018 6-2019 6-2016 6-2017 6-2018 6-2019 6-2016 6-2017 6-2018 6-2019 6-2016 6-2017 6-2018 6-2019 6-2016 6-2017 6-2018 6-2019
- 16. Activity by District SF District 1: Northwest (Sea Cliff, Lake, Jordan Park / Laurel Heights, Outer Richmond, Central Richmond, Inner Richmond, Lone Mountain) SF District 2: Central West (Outer Sunset, Central Sunset, Inner Sunset, Outer Parkside, Parkside, Inner Parkside, Golden Gate Heights) SF District 3: Southwest (Pine Lake Park, Lake Shore, Merced Manor, Stonestown, Lakeside, Merced Heights, Ingleside, Ingleside Heights, Oceanview) SF District 4: Twin Peaks W (Forest Hill (& Ext), W Portal, St Francis Wd, Balboa Terr, Mt Dav Manor, Ingleside Terr, Monterey Hts, Wstwd Pk & H'lnds, Shrwd Fst, Miraloma Pk, Dmnd Hts, Mdtwn Terr) SF District 5: Central (Haight Ashbury, Cole Vly / Prnssus Hts, Clarndn Hts, Corona Hts, Twin Pks, Glen Pk, Noe Vly, Eureka Vly / Dolores Hts, Mission Dolores, Duboce Trngl, Buena Vista / Ashbury Hts) SF District 6: Central North (Lower Pacific Heights, Anza Vista, Western Addition, North Panhandle, Alamo Square, Hayes Valley) SF District 7: North (Marina, Cow Hollow, Presidio Heights, Pacific Heights) SF District 8: Northeast (North Waterfront, North Beach, Russian Hill, Telegraph Hill, Nob Hill, Financial District / Barbary Coast, Downtown, Van Ness / Civic Center, Tenderloin) SF District 9: Central East (Yerba Buena, South Beach, South of Market, Mission Bay, Inner Mission, Potrero Hill, Central Waterfront / Dogpatch, Bernal Heights) SF District 10: Southeast (Outer Mission, Mission Terr, Excelsior, Portola, Bayview, Silver Terr, Hunters Pt, Candlestick Pt, Bayview Hts, Little Hollywood, Visitation Vly, Crocker Amazon) 6-2018 6-2019 + / – 6-2018 6-2019 + / – 6-2018 6-2019 + / – 6-2018 6-2019 + / – 6-2018 6-2019 + / – Single Family 1 SF District 1 35 21 -40.0% 22 14 -36.4% $2,137,500 $2,534,000 +18.5% 15 25 +66.7% 2.4 1.3 -45.8% 2 SF District 2 47 54 +14.9% 39 23 -41.0% $1,480,000 $1,480,000 0.0% 15 16 +6.7% 1.4 1.7 +21.4% 3 SF District 3 28 18 -35.7% 13 13 0.0% $1,435,000 $1,505,000 +4.9% 17 26 +52.9% 1.9 1.6 -15.8% 4 SF District 4 67 34 -49.3% 31 32 +3.2% $1,826,500 $1,800,000 -1.5% 18 17 -5.6% 2.5 1.2 -52.0% 5 SF District 5 64 46 -28.1% 37 32 -13.5% $2,350,000 $2,563,000 +9.1% 24 20 -16.7% 2.4 1.7 -29.2% 6 SF District 6 16 14 -12.5% 2 5 +150.0% $2,112,500 $2,550,000 +20.7% 24 10 -58.3% 5.1 3.4 -33.3% 7 SF District 7 38 34 -10.5% 12 7 -41.7% $5,500,000 $8,582,000 +56.0% 9 30 +233.3% 4.5 4.0 -11.1% 8 SF District 8 13 20 +53.8% 2 4 +100.0% $3,060,000 $2,777,500 -9.2% 4 29 +625.0% 5.1 8.8 +72.5% 9 SF District 9 55 41 -25.5% 27 17 -37.0% $1,730,000 $1,750,000 +1.2% 16 22 +37.5% 2.6 2.1 -19.2% 10 SF District 10 66 80 +21.2% 46 34 -26.1% $1,090,000 $1,015,000 -6.9% 21 29 +38.1% 1.6 2.2 +37.5% Condo/TIC/Coop 1 SF District 1 32 18 -43.8% 19 10 -47.4% $1,075,000 $1,300,000 +20.9% 28 47 +67.9% 2.5 1.3 -48.0% 2 SF District 2 7 5 -28.6% 3 3 0.0% $1,105,000 $1,375,000 +24.4% 13 8 -38.5% 1.8 1.3 -27.8% 3 SF District 3 6 6 0.0% 1 3 +200.0% $670,000 $900,000 +34.3% 13 88 +576.9% 2.5 1.9 -24.0% 4 SF District 4 15 7 -53.3% 5 5 0.0% $607,000 $1,200,000 +97.7% 30 19 -36.7% 3.3 1.4 -57.6% 5 SF District 5 77 44 -42.9% 46 43 -6.5% $1,307,500 $1,525,000 +16.6% 27 14 -48.1% 2.1 1.2 -42.9% 6 SF District 6 56 46 -17.9% 24 24 0.0% $1,187,500 $1,410,000 +18.7% 40 34 -15.0% 2.2 2.2 0.0% 7 SF District 7 69 47 -31.9% 36 29 -19.4% $1,570,000 $1,850,000 +17.8% 21 49 +133.3% 2.8 1.9 -32.1% 8 SF District 8 169 139 -17.8% 49 40 -18.4% $990,000 $1,024,000 +3.4% 30 29 -3.3% 4.1 3.3 -19.5% 9 SF District 9 259 210 -18.9% 112 90 -19.6% $1,154,000 $1,212,500 +5.1% 26 27 +3.8% 2.7 2.4 -11.1% 10 SF District 10 26 34 +30.8% 8 6 -25.0% $882,500 $775,000 -12.2% 26 72 +176.9% 3.1 5.5 +77.4% Key metrics by report month for the districts of San Fransisco. Current as of July 11, 2019. All data from the San Francisco MLS. Report © 2019 ShowingTime. | 16 Active Listings Sold Listings Median Sales Price Days on Market Months Supply