Organic Name Reactions for the students and aspirants of Chemistry12th.pptx
Morning Joe Charts - US vs China - 10.24.11
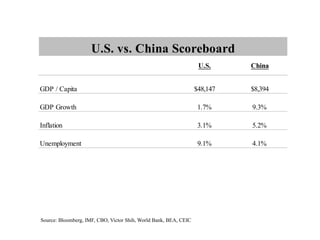
1. U.S. vs. China Scoreboard
U.S. China
GDP / Capita $48,147 $8,394
GDP Growth 1.7% 9.3%
Inflation 3.1% 5.2%
Unemployment 9.1% 4.1%
Source: Bloomberg, IMF, CBO, Victor Shih, World Bank, BEA, CEIC
2. U.S. vs. China Scoreboard
U.S. China
Federal Debt (% of GDP) 62% 17%
Total Gov't Debt (% of GDP) 93% 80%+
Foreign Exchange Reserves (bn) $48 $3,202
National Savings (% of GDP) 10% 51%
Household Savings (% of Disposable Income) 5% 39%
Source: Bloomberg, IMF, CBO, Victor Shih, World Bank, BEA, CEIC