Telangana agriculture: Crisis and Possible Solutions
•Als PPTX, PDF herunterladen•
7 gefällt mir•1,646 views

presented at World Telangana Convention organised by American Telangana Association at Houston, Texas from 29th June to 1st July, 2018

Empfohlen
Weitere ähnliche Inhalte
Was ist angesagt?
Was ist angesagt? (20)
Ähnlich wie Telangana agriculture: Crisis and Possible Solutions
Ähnlich wie Telangana agriculture: Crisis and Possible Solutions (20)
Mehr von Ramanjaneyulu GV
Mehr von Ramanjaneyulu GV (20)
Kürzlich hochgeladen
Kürzlich hochgeladen (20)
Telangana agriculture: Crisis and Possible Solutions
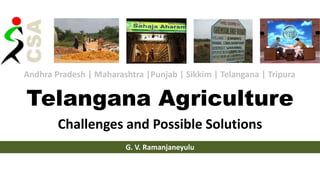
- 1. Telangana Agriculture Challenges and Possible Solutions G. V. Ramanjaneyulu Andhra Pradesh | Maharashtra |Punjab | Sikkim | Telangana | Tripura
- 3. Sikkim Tripura Punjab Utter Pradesh Maharashtra Telangana Andhra Pradesh CSA offices and Project sites (7 states) Technical Support to local organisations (6 states) Rajasthan Madhya Pradesh Chattisgarh Odisha Jharkand West Bengal CSA areas of Work 2018 50,000 farmers directly 200,000 farmers indirectly
- 4. Against small farmers and sustainable models Low public investment Poor regulation Decreasing share of farmer in consumers price Unregulated prices and quality of inputs Increasing costs of production Increasing risk Low access to productive resources Decreasing support from the government Farmer Market Policy
- 5. 0 2000 4000 6000 8000 10000 12000 14000 16000 18000 20000 1995 1996 1997 1998 1999 2000 2001 2002 2003 2004 2005 2006 2007 2008 2009 2010 2011 2012 2013 2014 2015 2016 No. of suicides Source: NCRB 1995-2016 Farmer Suicides in India 1995-2016 Total 329,898 in 22 years http://www.developmentdialogue.in
- 6. 0 500 1000 1500 2000 2500 1995199619971998199920002001200220032004200520062007200820092010201120122013201420152016 Farmers Suicides Source: NCRB 1995-2016 Farmer Suicides in Telangana 1995-2016 Total 28,965 in 22 years http://www.agrariancrisis.in
- 7. Farm Crisis and Farmer Suicides Land size No. of Suicides % of total suicides Landless 93 13.5% 0 - 1 acre 115 16.6% 1 - 2.5 acres 198 28.6% 2.5 - 5 acre 236 34.1% 5 – 10 acre 40 5.8% More than 10 acres 9 1.3% Study done by CSA and Rytu Swarajya Vedhika, 2018 Out of 692 farmers, 520 are tenant farmers, i.e., farmers who had taken land on lease and cultivated it. This means that 75.14% of the farmer suicides are by tenant or lessee farmers. Out of this, 18% were totally landless. Another 46% were marginal land-holders. This means that 64% of the tenant farmers were holding less than 2.5 acres of land. Another 30% were small farmers, i.e., holding between 2.5 and 5 acres of land. Therefore, 94% of the tenant farmers committing suicide are small and marginal farmers or landless
- 8. Land size No. of Tenant Farmer Suicides Average Outstanding Bank Loan Average Outstanding Private Loan Farmers with no bank loan Landless 93 ₹11,000 ₹3,64,000 75 0 - 1 acre 115 ₹38,000 ₹3,85,000 55 1 - 2.5 acres 198 ₹46,000 ₹3,85,000 67 2.5 - 5 acre 236 ₹66,000 ₹4,44,000 59 5 – 10 acre 40 ₹1,46,000 ₹4,34,000 6 > 10 acres 6 ₹1,40,000 ₹8,05,000 3 TOTAL 520 ₹50,000 ₹4,06,000 265 Tenant Farmer Suicides and Institutional Debt Study done by CSA and Rytu Swarajya Vedhika, 2018
- 9. People depending on Agriculture in India 49.93% 19.5% 52.78% 16.69% 43.35% 26.33% 37.82% 22.69% 35.24% 23.75% 31.65% 26.38% 24.64% 29.96% 69.43% 69.47% 69.68% 60.51% 58.99% 58.03% 54.6% • People depending on agriculture has come down from 69.43% to 54.6% in last 60yrs • For the first time the number of cultivators is lower than agriculture workers both in proportion and absolute numbers • Between 2001-2011 about 86.10 lakh people have left farming in India which is about 2358/day • In 2011 main cultivators (depending on farm income for more than 6 months) are only 95.8 m which is about 8% of Indian population) (People in Million) (% of working population) Source: Census of India 1951-2011 http://www.agrariancrisis.in
- 10. • 63% of all women workers in India (74% of rural female workforce) is in agriculture • Only 13% of women have access to land • 35 million women cultivators enumerated by census 2011
- 11. Changes in the percentage distribution of households and area owned by category of household ownership holdings in 2012-13 over 2002-03 Category of holdings % of households % of area owned 2002-03 (59th Round) 2012-13 (70th Round) 2002-03 (59th Round) 2012-13 (70th Round) Landless (<0.002 ha) 10.04 7.41 0.01 0.01 Marginal* (0.002-1.00 ha) 69.63 75.42 23.01 29.75 Small (1.00-2.00 ha) 10.81 10.00 20.38 23.54 Semi-medium (2.00-4.00 ha) 6.03 5.01 21.97 22.07 Medium (4.00-10.00 ha) 2.96 1.93 23.08 18.83 Large (> 10.00 ha) 0.53 0.24 11.55 5.81 Source: NSSO 59th Round and 70th Round More than 81.83% of agricultural households today own less than 1.00 ha of land.
- 12. Land distribution in Telangana Region Land owned by 5 % of families Land owned by 60 % of families Land less families Northern Telangana 32.21% 10.63% 39.26% Southern Telangana 33.47% 4.96% 50.19% Total 32.84% 7.80% 44.73%
- 13. Estimated Income and Expenditure of Farmers in India Compiled from NSSO 59th and 70th Round NSSO 59th Round (2003) NSSO 70th Round (2014) Land holding Category Total Income (Rs/month) Expenditure (Rs/Month) % of total Total Income (Rs/month) Expenditure (Rs/Month) % of total <0.01 Landless 1380 2297 67.00% 4561 5108 81.83%0.01-0.4 Sub marginal 1633 2390 4152 5401 0.4-1.0 Marginal 1809 2672 5247 6020 1.0-2.0 Small 2493 3148 17.00% 7348 6457 10.00% 2.0-4.0 Semi-medium 3589 3685 10.00% 10730 7786 5.01% 4.0-10.0 Medium 5681 4626 6.00% 19637 10104 1.93% >10.0 Large 9667 6418 41388 14447 0.24% Total 2115 2770 6426 6223
- 14. Percentage share of different income sources 70th Round NSSO, 2014 (ha) Rs. 4561 Rs. 4152 Rs. 5247 Rs. 7348 Rs. 10730 63.6 57.5 38.3 23.5 15.4 10.3 3.2 32.2 0.7 16.5 40.9 57.3 68.6 77.6 86.2 47.9 25.9 15 12 11.1 10.8 7.6 6.3 11.9 9.8 11.1 8.8 8.1 5.2 4.4 4.3 8 0% 10% 20% 30% 40% 50% 60% 70% 80% 90% 100% <0.01 0.01-0.4 0.41-1.0 1.01-2.00 2.01-4.00 4.01-10.00 >10.00 all sizes Wage/salaries Cultivation Livestock Non farm business Rs. 19637 Rs. 41388 Rs. 6426
- 15. Farmers income in Telangana Sl no Particulars (Amount in Rs) Telangana (Rs/hh/annum) All India (Rs/hh/annum) I Farmers income in base year at 2015-16 prices a. Farm income 63,492 58,246 b. Non Farm income 22,799 38,457 Total 86,291 96,703 II Farmers income in terminal year 2022-23 at 2015-16 prices a. Farm income 1,11,238 1,08,045 b. Non Farm income 31,916 48,108 Total 1,43,153 1,56,154 III Farmers income in terminal year 2022-23 at current prices a. Farm income 1,56,522 1,52,031 b. Non farm income 44,909 67,693 Total 2,01,431 2,19,724 Estimation of Income (assuming the inflation @ 5% p.a. During 2015-16 to 2022-23 Source: Doubling the farmers income, Ashok Dalwai Committee http://www.agricoop.nic.in/doubling-farmers-income
- 16. Telangana: Socio Economic Status of Rural Areas • As per the 2011 census, 69.69 per cent of the families live in the rural areas. The 2014 state Government Analysis shows that the main occupation of 40 percent of the households is agriculture 12.5 percent derive their livelihood working as agricultural labour. Another 26 per cent of the families are self-employed. • 2011 Socio economic and caste survey shows that 57,06,101 families live in rural Telangana of which 24,17,061(42%) have ownership of land, 32,88,938(58%) do not own land. In terms of sources of income, 14,94,378 (26.19 %) are cultivators (earning more than half of their income from agriculture) 28,29,348 (49.58 %) are agricultural workers (earning more than half of their income from labor work). • 2011 Socio economic and caste survey shows that households with incomes less than Rs. 5000 per month are 43,02,997 (75.41%). • The NSSO 70th report (2014) estimates that 89.1% of farming households in telangana are indebted and the average outstanding loan is Rs. 93,500.00. • The NSSO 70th round report estimates that about 60.3% of loans of the farming households are from private money lenders.
- 17. Credit access • 2017: Farm Credit Rs.11.00 lakh crore (12.08 %) of the total bank credit against 18% norm • Rural farm credit gets only Rs.2.48 lakh crore which equals only to 4.49 % of bank credit while the remaining 6.03 per cent — more than half of the farm credit — is apportioned by semi-urban, urban and metropolitan farmers • Small loans, of below Rs.2 lakh limit, add up to Rs.2.81 lakh core, that is 5 per cent of the total credit supplied by the banks. The small and marginal farmers' share in this could naturally be much less than this 5 per cent
- 18. Anatomy of loan waiver • An young woman farmer took up farming in 2013 after completing her MBA. The very first year she had a crop loan plus interest amount of rs. 71452 . • The loan was waived in 8 installments over four years and total Rs. 76,604.00 including for interest was charged for pending amounts. In 2014 she was given a loan of Rs. 26,000 only (equal to the loan installment paid by govt). For rest of the amount she was charged interest. • At the end of the year when she went for repayment, banks insisted to repay entire Rs. 85,000 (including pending loan waiver amount Rs. 51,357.41). As she cudnt repay the loan kept on pending and charged interest. Next year after second installment of loan. Waiver she got Rs. 11,500 as loan and after third installment of loan waiver she got only Rs. 8,000 as loan. • In all she took 45,500 as fresh loan. As she cudnt repay the loan (due to banks not accepting), interest to the tune of Rs. 20,311 was charged. • In addition insurance premiums for two seasons were Rs. 3730, loan inspection charges were Rs. 1500.00 (Rs. 500 per year), account maintenance charges per year are 300 so total was Rs.900. in all she is now left with Rs. 71,941 loan again. She is unable to take fresh loan as she cannot repay. This year crop failed so no way she can pay. Why crop loans and this waiver was made so complicated? Why bankers refuse to accept part loan payment? Why the farmers were not given loan to the extent they are eligible as per the scale of finance?
- 19. Tenant farming in Telangana • About 35% tenant farmers • The Andhra Pradesh (Telangana Area) Tenancy & Agriculture Act, 1950, as amended in 1951, 1954, 1956, 1961, 1969 and 1979 prohibits tenancy except for certain category of land owners • 2017-18 among more than one lakh survey numbers in Telangana, applications for loan elgibility cards came from 39,886 survey numbers and only 22,626 were given cards. 12,896 were rejected and no decision has been taken on 66,124. very few of them got institutional credit.
- 21. Crop All India Cost of production (Rs/ha) Telangana (Rs/ha) MSP+bonu s 2017-18 A2+FL+50% likely change A2 A2+FL C2 State estimate CACP estimate State suggested MSP (RS/Q) (RS/Q) (RS/Q) Paddy* 840 1117 1484 2158 1495 4136 1550 1675.5 125.5 Jowar** 1214 1556 2089 2559 2039 3839 1700 2334 634 Bajra 571 949 1278 2247 3370 1425 1423.5 -1.5 Maize 761 1044 1396 1949 1222 2924 1425 1566 141 Ragi 1384 1861 2351 2325 1999 3487 1900 2791.5 891.5 Arhar 2463 3318 4612 7123 5683 10684 5450 4977 -473 Moong 2809 4286 5700 6164 4822 9246 5575 6429 854 Urad 2393 3265 4517 5423 3277 8134 5400 4897.5 -502.5 Groundnut 2546 3159 4089 4971 3962 7456 4450 4738.5 288.5 Soybean 1787 2121 2921 3239 4120 4858 3050 3181.5 131.5 Sunflower 2933 3481 4526 5986 4806 8978 4100 5221.5 1121.5 Sesamum 2685 4067 5706 7080 7822 10620 5300 6100.5 800.5 Nigerseed 1788 3912 5108 4050 5868 1818 Cotton*** 2622 3276 4376 5337 4625 8005 4020 4914 894 Costs, Prices and Support 2017-18
- 23. Rs. 3200/quintal Rs. 60.50/kg
- 24. Making farming viable! • Increasing access to productive resources: land, water and other resources • Strengthening existing support systems: extension, credit, insurance, etc • Reducing risk in farming: agroecological approaches, insurance etc • Increase price realisation: FPOs, value addition, direct sales • Increase income basket: supplementary and complementary income sources
- 25. Agroecological Approaches Water Harvesting Cropping Systems Soil n Moisture Management Seed System Non Pesticidal Management
- 27. Redesigning supply chains • taking on more of the supplier activities (backward) and/or taking on more of the distribution activities (forward) or both • Correcting the knowledge/information asymetry • Backward integration farmers/farmers group producing their own seeds, compost etc • Forward integration farmers/farmers group doing value addition to the produce – Quantity (aggregation) – Form (processing) – Time (storage) – Quality (product differentiation) – Place (transport)
- 28. Kisan Business School • Participative designing and problem solving • Learning-by–doing • Arriving at Interactive and inclusive solutions • Season-long approach
- 29. FPOhub Incubating Community Institutions and Enterprises • Organising Federations of farmers groups • Farmer Producer Organisations – Farmer Cooperatives-16 in Andhra Pradesh, 4 in Telangana, 2 in Sikkim – Farmer Producer Companies: 7 in Telangana, 1 in Maharashtra, 2 in Tripura – In the process of formation: 225 in Telangana – Hand holding support to 107 FPOs in Andhra Pradesh • Organic Retail Marketing through Consumer Cooperative, Hyderabad
- 30. Farmer Producer Organisations Producer Co-op-1 Farmer Group B Organic Stores • Healthy food • Affordable Price • Max share to farmers Organic Store Mobile Store Direct to Home Producer Co-op-2 Other farmers and farmers groups Farmer Group A Farmer Group C Sahaja Aharam Producer Company • Capacity building • Institutional building • Investment support • Brand building • Quality Management • Fair Trade Market place Direct to resellers Whole sale to traders Bulk buyers Processing units Seeds Bioinputs No. of Farmers: 5000 Organic: 2500 (1000 ICS certified, 1500 PGS certified) Cooperatives 30
- 31. • Tungabhadra Coop • Kadiri Coop • Palabavi Coop •Rayachoti coop •Baghyalaxmi coop • Punnami Coop • Gayatri Coop • Mydukuru Coop • Harita Coop • Brahmalingeswara Coop • Giri Coop • Naisargic Sheti Beej Producer Company • Enebavi Coop • Adarsha Coop • BROMACS • Swayamkrishi PC • Kisanmitra coop • GreenDunia Kallem Hub Boddham Hub Naguladinne Hub Dorli Hub
- 32. Vegetables: Aggregation and Segregation Group January February March April May June July August September October November December 1 Palak 2 Potato/Beans 3 4 Cluster Bean Cluster Bean 5 Cabbage 6 7 Carrot 8 9 10 11 12 Bhendi Cow pea Capsicum Methi Cluster Bean Onion Methi Cluster Bean Palak Cauliflower Palak Cowpea Cluster Bean Brinjal Green Chillies Cucumber Carrot Bhendi Tomato Cabbage Bhendi Palak Tomato Cabbage Tomato Bhendi Green pea Tomato Onion Amaranthus Green Chillies Onion Ridge Gourd Amaranthus Radish Bendi Palak Cluster Bean Ambadi Potato/Beans Brinjal Cow pea • Round the year supply • Basket of vegetables minimum 1 ton/day • Each farmer also has at least 4 vegetables at any point of time to distribute risk • Organic/NPM Practices • Better harvesting, • Procurement, grading, handling
- 33. FoodProcessing
- 34. Abhihara Organic Cotton value chain
- 35. Dorli, Wardha dist, Maharashtra Mulugu, Siddipet dist, Telangana Enebavi, Jangoan dist, Telangana Varanasi, Utter Pradesh
- 36. Quality Management and traceability Certificate no : Q9186414570 PGSI/W(TG)-1276
- 37. On wheels exhibitions In stores online
- 38. •Hyderabad •Tarnaka •Kharkana •Kukatpally •Gandhinagar •Vishakapatnam •MVP Colony •Mumbai • Home delivery www.sahajaaharam.in
- 39. Creating Livelihoods Sericulture Backyard Poultry Honey Production • Developing Livelihoods Plan • Building the capacities • Green Enterprises for Bioinputs • Providing linkages For diversifying incomes and assets Composting Azolla Sheep and Goat
- 40. farm support services http://www.ekrishi.co.in • CROPdiagnose • FARMetrix • FPOhub • TraceBack • MARKET • HIRE • FINANCE • KisanMitra
- 41. KisanMitra Vikarabad | Adilabad | Manchiryal 1800-120-3244 08500 98 3300 • Making public support services accessible for farmers • Distress Helpline to resolve grievances and rapid response in case of extremities • Monitoring public support services for farmers
- 42. Policy level changes • Develop a Drought Management Policy – Redefine drought declaration process, include groundwater levels as a criteria – Establish institutional systems to Coordinate all agencies and organisations involved – Pre-drought strategies – Drought responses – Drought indicators and triggers • Land related policies • Water related policies-groundwater and surface water • Crop and livelihood planning • Other policies: – Feed, fodder and seed banks – State Level Policy for Livestock. – Inclusion of coarse cereals in PDS and procurement programme. – Tenant farmers issue – A unique 4-5 years rolling system of credit and repayment. – Comprehensive Risk Management – Support Farmer Producer Organisations
- 43. Economic policies with focus on income security to farmers • Balancing act between – Costs of cultivation – Prices – Costs of living – Support/subsidies • New ways of supporting in terms of – Increasing access to productive resources – Increasing institutional support: credit, insurance, extension – Price compensations – Farmers own resources and labour – Ecosystem services – Farmers institutions
- 45. Awards and Recognitions • 2017: Sakshi Excellence Award for Best Contribution to Agriculture • 2014: Best Rural Innovation Award for Non Pesticidal Management in Bihar Rural Innovation Forum • 2014: Best Rural Innovation Award for ‘Community Managed Sustainable Agriculture’ in Maharashtra Rural Innovation Forum • 2012: Best Green Enterprises award by Hivos for NPM scalingup in AP • 2010: Krishi Gourav Award for Enebavi • 2008: TV9 ‘Navya’ Award for effective campaign • 2005: World Bank Development Market Place Award
- 46. Name of the organization Centre for Sustainable Agriculture (CSA) Year of registration and legal status CSA is registered as Trust in 2004 in Hyderabad, India. 1605-1-15/BKIX/2004 PAN Card AAATC6399Q FCRA Registration No. 010230731 NGO DARPAN AP/2016/0113512 Income Tax Exemption: 80G: DIT (E)/HYD/80G/14(05)/12-13 dated 02.11.2012 12A: DIT€/HYD/56(12)/12A/04-05 dated 11-01-2005 Address for communication #12-13-485/5, Nagarjuna Nagar, Tarnaka, Secunderabad-500017 Phone; 08500783300, 08500983300 Contact Person Dr. G.V. Ramanjaneyulu Executive Director, Mobile:9000699702 Web & E-mail; www.csa-india.org E-mail: csa@csa-india.org http://www.csa-india.org/donate
- 47. CENTRE FOR SUSTAINABLE AGRICULTURE http://www.csa-india.org http://www.krishi.tv http://www.ekrishi.co.in http://www.sahajaaharam.in http://www.agrariancrisis.in eKrishi : 08500 68 3300 Sahaja Aharam : 08500 78 33 00 Rytu Swarajya Vedhika: 08500 98 33 00 Ph. 040-2701 7735, mobile : 090 0069 9702 csa@csa-india.org, Facebook: ramoo.agripage
Hinweis der Redaktion
- Farmers are certified under Participatory Guarantee System (PGS) and third party certification (ICS). Sahaja Aharam is also managing a tracking system where each packet can be traced back to the farmer/farmer group by scanning the QR code.