1. www.TheOnlineGK.wordpress.com
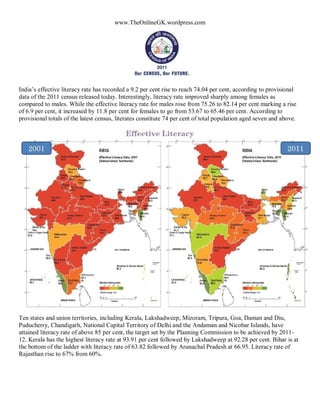
India’s effective literacy rate has recorded a 9.2 per cent rise to reach 74.04 per cent, according to provisional
data of the 2011 census released today. Interestingly, literacy rate improved sharply among females as
compared to males. While the effective literacy rate for males rose from 75.26 to 82.14 per cent marking a rise
of 6.9 per cent, it increased by 11.8 per cent for females to go from 53.67 to 65.46 per cent. According to
provisional totals of the latest census, literates constitute 74 per cent of total population aged seven and above.
Ten states and union territories, including Kerala, Lakshadweep, Mizoram, Tripura, Goa, Daman and Diu,
Puducherry, Chandigarh, National Capital Territory of Delhi and the Andaman and Nicobar Islands, have
attained literacy rate of above 85 per cent, the target set by the Planning Commission to be achieved by 2011-
12. Kerala has the highest literacy rate at 93.91 per cent followed by Lakshadweep at 92.28 per cent. Bihar is at
the bottom of the ladder with literacy rate of 63.82 followed by Arunachal Pradesh at 66.95. Literacy rate of
Rajasthan rise to 67% from 60%.