1. Portugal
2010
Total population (thousands) .................................. 10 676
Population density (persons per square km) ........... 116
Percentage of population under age 15................... 15.1
Percentage of population age 15-24........................ 10.9
Percentage of population age 15-64........................ 66.9
Percentage of population aged 65+......................... 17.9
2005-2010
Annual rate of population change (percentage) ...... 0.3
Total fertility (children per woman)........................ 1.36
Under-five mortality (5q0) per 1,000 live births .... 6
Life expectancy at birth (years) .............................. 78.6
The designations employed and the presentation of material on this map
do not imply the expression of any opinion whatsoever on the part of the
Note: data presented for the projection period 2010-2100 refer to Secretariat of the United Nations concerning the legal status of any
the medium fertility variant. country, territory, city or area or of its authorities, or concerning the
delimitation of its frontiers or boundaries.
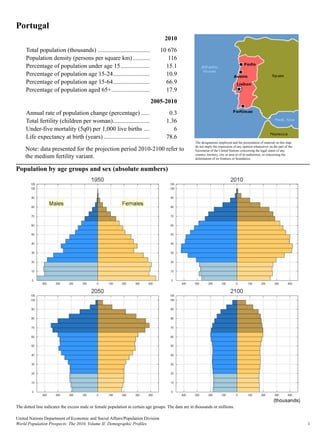
Population by age groups and sex (absolute numbers)
The dotted line indicates the excess male or female population in certain age groups. The data are in thousands or millions.
United Nations Department of Economic and Social Affairs/Population Division
World Population Prospects: The 2010, Volume II: Demographic Profiles 1
2. Portugal
United Nations Department of Economic and Social Affairs/Population Division
2 World Population Prospects: The 2010, Volume II: Demographic Profiles
3. Portugal
1950 1960 1980 2000 2005 2010 2015 2020 2040 2060 2080 2100
Total Population
Total population (thousands) .................................... 8 417 8 883 9 786 10 336 10 544 10 676 10 702 10 623 9 918 8 676 7 447 6 754
Population density (persons per square km) ............. 92 97 106 112 115 116 116 115 108 94 81 73
Median age (years).................................................... 26.1 27.9 30.7 37.8 39.3 41.0 43.0 45.1 51.4 52.6 49.7 47.7
Dependency rates (percentage)
Child dependency ratio (a)........................................ 72.9 69.0 64.0 37.8 34.4 33.0 31.9 30.6 30.5 35.3 40.9 42.0
Old-age dependency ratio (b).................................... 13.0 14.7 21.2 26.6 27.7 29.1 31.7 34.7 55.9 70.1 69.9 62.6
Total dependency ratio (c) ........................................ 85.9 83.7 85.2 64.4 62.2 62.0 63.6 65.3 86.3 105.4 110.7 104.6
1950-1955 1960-1965 1980-1985 2000-2005 2005-2010 2010-2015 2015-2020 2020-2025 2040-2045 2060-2065 2080-2085 2095-2100
Rates of population change
Annual rate of population change (percentage) ........ 0.6 0.0 0.4 0.4 0.3 0.1 -0.2 -0.3 -0.5 -0.8 -0.6 -0.4
Rate of natural increase (per 1,000 population)........ 12.0 12.7 4.9 0.5 -0.3 -1.4 -2.9 -3.7 -6.1 -8.5 -5.9 -3.9
Population doubling time (years) (d) ........................ 119 — — — — — — — — — — —
Mortality
Crude death rate per 1,000 population...................... 11.9 11.1 9.7 10.3 10.1 10.1 10.8 11.4 14.1 17.1 15.4 14.2
Infant mortality rate (1q0) per 1,000 live births ....... 93 79 20 5 4 4 4 4 4 3 3 3
World Population Prospects: The 2010, Volume II: Demographic Profiles
Under-five mortality (5q0) per 1,000 live births ...... 137 105 25 6 6 5 5 5 5 4 4 3
Adult mortality (45q15) per 1,000 (e)....................... 207 164 139 104 91 79 74 70 55 43 34 28
United Nations Department of Economic and Social Affairs/Population Division
Life expectancy at birth (years) ................................ 60.0 64.2 72.3 77.3 78.6 79.8 80.4 80.9 82.9 84.7 86.4 87.7
Male life expectancy at birth (years) ........................ 57.3 61.3 68.8 73.9 75.3 76.8 77.4 78.0 80.1 82.0 83.8 85.1
Female life expectancy at birth (years)..................... 62.6 67.1 75.8 80.7 81.8 82.8 83.3 83.8 85.7 87.5 89.2 90.4
Life expectancy at age 15 (years) ............................. 55.3 57.3 59.5 63.0 64.2 65.4 65.9 66.4 68.4 70.1 71.8 73.1
Life expectancy at age 65 (years) ............................. 13.4 13.7 15.2 17.6 18.3 19.1 19.4 19.8 21.1 22.4 23.7 24.6
Fertility
Crude birth rate per 1,000 population ....................... 23.9 23.8 14.6 10.8 9.8 8.8 7.9 7.6 8.0 8.6 9.5 10.3
Total fertility (children per woman).......................... 3.10 3.19 2.01 1.45 1.36 1.31 1.30 1.36 1.64 1.83 1.94 1.99
Sex ratio at birth (males per 100 females) ................ 106 106 106 106 106 106 106 106 106 106 106 106
Net reproduction rate (f) ........................................... 1.25 1.36 0.94 0.70 0.65 0.63 0.63 0.65 0.79 0.88 0.94 0.96
Mean age childbearing (years).................................. 30.2 29.6 27.2 28.9 29.5 29.9 30.3 30.6 31.0 31.0 31.0 31.0
Births and deaths
Number of births (thousands) ................................... 1 022 1 058 723 563 518 468 421 402 393 366 348 351
Number of deaths (thousands) .................................. 508 493 480 536 536 542 575 600 692 726 564 483
Births minus deaths (thousands) ............................... 514 564 243 27 - 18 - 74 - 153 - 197 - 299 - 360 - 216 - 132
International migration
Net number of migrants (thousands)......................... - 265 - 548 - 67 180 150 100 75 50 50 6 0 0
Net migration rate (per 1,000) .................................. -6.2 -12.3 -1.4 3.5 2.8 1.9 1.4 1.0 1.0 0.2 0.0 0.0
a The child dependency ratio is the ratio of the population aged 0-19 to the population aged 20-64. They are presented as number of dependants per 100 persons of working age (20-64).
b The old-age dependency ratio is the ratio of the population aged 65 years or over to the population aged 20-64. They are presented as number of dependants per 100 persons of working age (20-64).
c The total dependency ratio is the ratio of the population aged 0-19 and that aged 65+ to the population aged 20-64. They are presented as number of dependants per 100 persons of working age (20-64).
d The population doubling time corresponds to the number of years required for the total population to double in size if the annual rate of population change would remain constant. Doubling time is computed
only for fast growing populations with growth rates exceeding 0.5 per cent.
e Adult mortality is expressed as deaths under age 60 per 1,000 alive at age 15 and represents the probability of dying between age 15 and age 60 (45q15).
f The net reproduction rate is expressed as number of daughters per woman and represents the average number of daughters a hypothetical cohort of women would have at the end of their reproductive period
if they were subject during their whole lives to the fertility rates and the mortality rates of a given period.
3
4. Portugal
Total population (2009): Estimated to be consistent with the 2001 census, with official population
estimates for 1 January 2009 and with estimates of the subsequent trends in fertility, mortality and
international migration.
Total fertility: Based on official estimates of total fertility available through 2009.
Infant and child mortality: Based on births and infant deaths registered through 2009. Estimates from
the UNICEF and the Human Mortality Database were also considered.
Life expectancy at birth: Based on official estimates of life expectancy available through 2009. The
age pattern of mortality is based on official life tables for 2000-2009. Estimates from the Human
Mortality Database were also considered.
International migration: Based on official estimates of international migration and estimates of net
international migration derived as the difference between overall population growth and natural increase
through 2009.
United Nations Department of Economic and Social Affairs/Population Division
4 World Population Prospects: The 2010, Volume II: Demographic Profiles