Intro to Data Visualizations
•
6 gefällt mir•2,980 views

My introductory talk for the Data Summit on Immigration

Empfohlen
Weitere ähnliche Inhalte
Andere mochten auch
Andere mochten auch (11)
Ähnlich wie Intro to Data Visualizations
Mehr von Daniel Greenfeld
Kürzlich hochgeladen
Kürzlich hochgeladen (20)
Intro to Data Visualizations
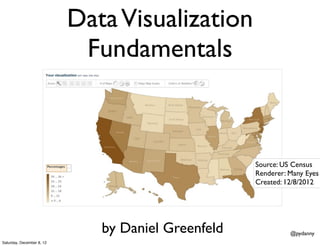
- 1. Data Visualization Fundamentals Source: US Census Renderer: Many Eyes Created: 12/8/2012 by Daniel Greenfeld @pydanny Saturday, December 8, 12
- 2. @pydanny • Learned Data Visualization at NASA • Principal at Cartwheel Web • Author of pydanny.com, a popular technology blog • Entrepreneur and CTO @pydanny Saturday, December 8, 12
- 3. Helping tomorrow! I’ll be there to help, so ask away! Or email me at pydanny@cartwheelweb.com @pydanny Saturday, December 8, 12
- 4. Tools covered • Many Eyes No coding • Google Charts Some coding • D3.js Need a developer @pydanny Saturday, December 8, 12
- 5. Many Eyes bit.ly/many-eyes @pydanny Saturday, December 8, 12
- 6. Many Eyes bit.ly/many-eyes @pydanny Saturday, December 8, 12
- 7. Many Eyes Pros: • Great for rapid visualizations • Free service provided by IBM. • All data posted is freely available. • Generates accessible content. @pydanny Saturday, December 8, 12
- 8. Many Eyes Cons: • Closed source - IBM can shut it down. • All data posted is freely available. • Uses Java applets to present data. @pydanny Saturday, December 8, 12
- 9. Using Many Eyes 1. Go to bit.ly/many-eyes 2. Sign up with your email 3. Upload some data 4. Create a visualization Let’s try it out! @pydanny Saturday, December 8, 12
- 10. Many Eyes bit.ly/many-eyes @pydanny Saturday, December 8, 12
- 11. Signing Up I Click ‘login’ bit.ly/many-eyes @pydanny Saturday, December 8, 12
- 12. Signing Up II Click ‘register’ @pydanny Saturday, December 8, 12
- 13. Signup III Email and Captcha @pydanny Saturday, December 8, 12
- 14. Follow emailed instructions Talk to me afterwards if you have any problems. @pydanny Saturday, December 8, 12
- 15. What data to use? • Many Eyes has a lot of free data on it. • I want a new report. • On data that I generated. @pydanny Saturday, December 8, 12
- 16. Example I • I run a site called • I want to know how many of each pet type is registered. @pydanny Saturday, December 8, 12
- 17. Example I Data Prep • I exported the data from to CSV. • Opened the CSV with Excel @pydanny Saturday, December 8, 12
- 18. Uploading Data I Copy/paste from your spreadsheet @pydanny Saturday, December 8, 12
- 19. Uploading Data II Copy/pasted from Excel Many Eyes interpretation of my data @pydanny Saturday, December 8, 12
- 20. Upload saved! Visualize! @pydanny Saturday, December 8, 12
- 21. Choosing Visualizations • Analyze Text • Compare a set of values • See relationships among data points • See the parts of a whole • See the world • Track rises and falls over time @pydanny Saturday, December 8, 12
- 22. Choosing Visualizations • Analyze Text Bar/Bubble charts • Compare a set of values • See relationships among data points • See the parts of a whole Pie Charts • See the world • Track rises and falls over time @pydanny Saturday, December 8, 12
- 23. Bar Chart @pydanny Saturday, December 8, 12
- 24. Bubble Chart @pydanny Saturday, December 8, 12
- 25. Pie Chart @pydanny Saturday, December 8, 12
- 26. Easy Conclusions • Dogs are clearly the most popular pet • Cats come second • Birds, Fish, Rabbits are roughly the same @pydanny Saturday, December 8, 12
- 27. Many Eyes Text Analysis @pydanny Saturday, December 8, 12
- 28. Example II • I built a site called • I want to do some text analysis. @pydanny Saturday, December 8, 12
- 29. Scraping Text copy/paste with explicit permission of site and author http://bit.ly/WPfEde @pydanny Saturday, December 8, 12
- 30. Upload the Data @pydanny Saturday, December 8, 12
- 31. Word Tree Click for better view Warning: Dependent on java applets @pydanny Saturday, December 8, 12
- 32. Tag Cloud http://www.niemanlab.org/2011/10/word-clouds-considered-harmful/ @pydanny Saturday, December 8, 12
- 33. Word Cloud @pydanny Saturday, December 8, 12
- 34. Many Eyes Geo Analysis @pydanny Saturday, December 8, 12
- 35. Example III • I’m the CTO of • We want to share information about people moving. @pydanny Saturday, December 8, 12
- 36. Prep the data • Export to CSV • Open with Excel @pydanny Saturday, December 8, 12
- 37. Upload the Data @pydanny Saturday, December 8, 12
- 38. Choose Visualization @pydanny Saturday, December 8, 12
- 39. Destinations @pydanny Saturday, December 8, 12
- 40. Google Charts @pydanny Saturday, December 8, 12
- 41. Google Charts Boot Camp https://developers.google.com/chart/ @pydanny Saturday, December 8, 12
- 42. Google Charts Pros • Free for many use cases • Customizable skins and themes • Relatively easy to use • Really good documentation • Bootcamp coming up! @pydanny Saturday, December 8, 12
- 43. Google Charts Cons • Closed source - Google can change terms • You have to know a little code. • You won’t need much of my help! @pydanny Saturday, December 8, 12
- 44. D3.js @pydanny Saturday, December 8, 12
- 45. D3.js example I http://nyti.ms/SN5mfh Four Ways to Slice Obama’s Budget Proposal @pydanny Saturday, December 8, 12
- 46. D3.js example II http://www.isbarackobamathepresident.com/ @pydanny Saturday, December 8, 12
- 47. D3.js Pros • Open source! (source code on Github) • W3C Standard Friendly • Unbelievable power • Killer examples • Can use the same CSVs as Many-Eyes @pydanny Saturday, December 8, 12
- 48. D3.js Cons • You will need a developer • Very steep learning curve @pydanny Saturday, December 8, 12
- 49. Warning code ahead! @pydanny Saturday, December 8, 12
- 50. JQuery-like selectors d3.selectAll("p").style("color", "white"); @pydanny Saturday, December 8, 12
- 51. Dynamic Properties d3.selectAll("p").style("color", function() { return "hsl(" + Math.random() * 360 + ",100%,50%)"; }); d3.selectAll("p").style("color", function(d, i) { return i % 2 ? "#fff" : "#eee"; }); @pydanny Saturday, December 8, 12
- 52. Loading Data d3.json("census.json", function(error, data){} // Do logic here }); d3.csv("pets.csv", function(error, data){} // Do logic here }); d3.tsv("immigrants.tsv", function(error, data){} // Do logic here }); Supports JSON, CSV, and TSV. @pydanny Saturday, December 8, 12
- 53. Data Binding Binds values to the first six paragraphs d3.selectAll("p") .data([4, 8, 15, 16, 23, 42]) .style("font-size", function(d) { return d + "px"; } ); Sets font-size per bound paragraph @pydanny Saturday, December 8, 12
- 54. Entering Data var p = d3.select("body").selectAll("p") .data([4, 8, 15, 16, 23, 42]) .text(String); p.enter().append("p") .text(String); If less than six paragraphs, then add until six exist. Create nodes for incoming data @pydanny Saturday, December 8, 12
- 55. Exiting Data var p = d3.select("body").selectAll("p") .data([4, 8, 15, 16, 23, 42]) .text(String); p.enter().append("p") .text(String); p.exit().remove(); Remove extra nodes Cleaning up your workspace @pydanny Saturday, December 8, 12
- 56. Transitions d3.select("body").transition() .style("background-color", "black"); @pydanny Saturday, December 8, 12
- 57. Build on Web-Standards • Creates SVG images on the fly • No Java or Flash needed • Works on modern browsers • Easy to debug with browser inspectors @pydanny Saturday, December 8, 12
- 58. Requires Javascript skill var m = [20, 120, 20, 120], w = 1280 - m[1] - m[3], h = 800 - m[0] - m[2], i = 0, root; var tree = d3.layout.tree() .size([h, w]); var diagonal = d3.svg.diagonal() .projection(function(d) { return [d.y, d.x]; }); var vis = d3.select("#body").append("svg:svg") .attr("width", w + m[1] + m[3]) .attr("height", h + m[0] + m[2]) .append("svg:g") .attr("transform", "translate(" + m[3] + "," + m[0] d3.json("flare.json", function(json) { root = json; root.x0 = h / 2; root.y0 = 0; function toggleAll(d) { if (d.children) { d.children.forEach(toggleAll); toggle(d); } Remember the Many-Eyes } // Initialize the display to show a few nodes. version of this data. root.children.forEach(toggleAll); toggle(root.children[1]); toggle(root.children[1].children[2]); toggle(root.children[9]); toggle(root.children[9].children[0]); @pydanny Saturday, December 8, 12 update(root);
- 59. Thank you! @pydanny Saturday, December 8, 12