SlideShare ist ein Scribd-Unternehmen logo
1 von 10
Downloaden Sie, um offline zu lesen
Monday 8,September 2008
                                                                                                                                             Tuesday 27, May 2008


NATSONS RESEARCH
                                                                                        ICSA
                                                                                  NTPC Ltd.

BUY                                                                 Fast growing, vertically integrating, consistent profit growth
 BSE code                                                532555     NTPC is the largest and most efficient power generating company in India with a
                                                                                                       th         th
 NSE code                                                  NTPC     capacity of 29,394MW. Over the 11 and 12 Five Year plans NTPC is expected to triple
 Bloomberg code                                          NATP IN    its power generating capacity to 75,000MW. Of the current capacity, it produces
 Current price                                              173     power through 15 coal based (23,395MW) and 7 gas based plants (3,955MW). It is
 Target price                                                218    credited with having supplied 28.5% of India's total production with its capacity base
 MCap Rs bn                                                 1430    of just 19.1% during FY08. In addition, it provides consultancy services to various
 Mcap US$ bn                                                 32.1   organizations domestically and overseas, in the fields of power plant construction and
 52 wk H/L                                                291/148   power generation. Further, NTPC has successfully incorporated six subsidiaries and
 Face value                                                    10   eleven joint ventures, transforming itself into an integrated Power major.

 Rs Mn                FY08E             FY09E            FY10E      Power demand in India to grow exponentially: India is presently facing an acute
                                                                    shortage of power: the country recorded a 10.8% off peak and 14.4% peak time
 Sales                370,501           415,741 491,732
                                                                    shortage in FY08. The requirement for power has been rising steadily and is expected
 % Ch                       13.7              12.2         18.3
                                                                    to grow to 220GW by 2012, and 306GW by 2017, according to the report prepared by
 OPM                        31.2              31.6         31.9     the Planning Commission. We expect this disconnect in the demand- supply situation
 PAT                  74,148             80,741 89,700              to persist over the next few years.
 % Ch                             8.0            8.9       11.1
 EPS*                             9.0            9.8       10.9
                                                                    Plans to increase generating capacities multifold: NTPC has announced plans to
                                                                    increase its capacity to 50GW by the year 2012 and to 75GW in FY17. This multifold
 PER                         19.3               17.7        15.9
                                                                    increase in power generation will allow it to retain its market leadership and increase
 EV/EBIDTA                   14.7               13.6        12.4    revenues and profitability over the next few years.
* FY09E and FY10 is on fully diluted equity

Share Holding pattern                                               High efficiencies to lead to further profitability: NTPC has operated at a plant load
                                                                    factor (PLF) of 92.24% for FY08 and is expected to maintain these levels in the future.
   Corporate          DII, 2.55           retail, 2.61
  bodies, 1.21
                                                                    The regulated incentive for operating at plant loads over 80% is 25 paise/unit of
      FII, 4.13
                                                                    electricity for thermal power plants.

                                         Govt, 89.50
                                                                    Strong balance sheet to enable large expansions: NTPC's expansion will cost the
                                                                    company Rs1.5trillion over the next few years. It currently has a debt to equity of 0.5x;
                                                                    thus, raising funds for all its expansion plans will not be a constraint.

                                                                    Vertical integration through its subsidiaries and value-adding joint ventures: NTPC
                                                                    has established six subsidiary and eleven JV companies. Through these it will
                                                                    manufacture equipment for generating capacities, and create fuel supplies for its
                                                                    plants, besides setting up distribution networks. This backward and forward
                                                                    integration in its related companies will add value in the years ahead.

                                                                    Valuation: At the current market price, NTPC trades at a P/E of 17.7x and 15.9x and
                                                                    EV/EBIDTA of 13.8x and 12.2x of its FY09E and FY10E earnings respectively. We are
                                                                    confident that NTPC will continue trading at a premium against its global peers, given
                                                                    the strong upside in generation capacities and strong balance sheet. Hence we feel a
                                                                    P/E multiple of 20x FY10E is justifiable, given that presently, we have not factored in
                                                                    any upside from subsidiaries and JV's. Based on this we arrive at a target price of
Navindar M                                                          Rs218, an upside potential of 25.7% from present levels.
navindarm@natverlal.com
91-22-42134444


                  NATVERLAL & SONS
                  Regd. Off.: Fairy Manor, 5th Floor, 13 Rustom Sidhwa Marg, Fort, Mumbai - 400 001.
                  Tel. :91-22- 4213- 4444 Dealing Rm : 4213 4400-04, 2265 1121 Fax : 91-22-4213 4440 Email : research@natverlal.com
NATSONS RESEARCH                                                                                  NTPC Ltd.

               Industry Outlook

               India is the fifth largest power consuming country in the world with a 3.8% share
               globally. It is the 3rd largest power consuming nation in Asia with an 11.3% share. India
               has a total power generating capacity of 143,061MW as of March 2008. The
               government has outlined a plan which envisages an addition of 78,577MW of
               generation capacity by 2012; this will take the total capacity to 200,000MW by 2017.
               The Indian per capita consumption is 704Kwh, which is significantly lower than other
               BRIC countries. Our National Electricity Policy (NEP) expects the per capita electricity
               consumption to reach 1,000Kwh by 2012—from 704Kwh in 2007-08.

                                                        Per Capita Consumption(Kwh)

                      World Average                        2701
                                 USA                                                              14240
                               Japan                                             8459
                              Russia                                      6425
                               Brazil                    2340
                               China                 1684
                                India             704

                                            0       2000    4000   6000    8000   10000 12000 14000 16000

                    Source: NTPC and Natverlal & Sons


               Through FY08 India witnessed a deficit of power of 10.8% during off peak and 14.4%
               during peak hours. We expect this mismatch in demand and supply to persist over the
               next few years. As illustrated, power demand will reach 220GW by 2012 whereas
               supply will touch just 200GW. Growth in India's power generation sector has been
               scuttled due to the low plant availability factor and lower PLF due to the inefficiently
               run plants of the State Electricity Board (SEB). A scarcity of fuels has also been a key
               reason for low PLF's in many plants throughout India. Gas- based plants face
               shutdowns due to unavailability of gas caused by production delays. These factors
               have led to actual energy generation being less than the generation potential.
               However, even in this scenario, NTPC recorded a much higher PLF than the industry
               average, due to a better long term relationship with fuel suppliers.

                           Fuel wise break-up(MV)                                                           Private
                   Thermal              91907   64.20%                                                      Sector,
                                                                                                             14%
                   Hydro                35909   25.10%                                   State
                   Nuclear               4120     2.80%                                 Sector,
                   renewable            11125     7.90%                                  52%
                   Total              143061      100%                                                      Central
                 Source: NTPC, Natverlal & Sons                                                             Sector,
                                                                                                             34%


               In India the power generation is produced by either the central government, the state
               government or the private sector. The private sector was recently allowed to enter the
               power space and hence the low % of generation.


   NATVERLAL & SONS
                                                                                                                      2
NATSONS RESEARCH                                                                                NTPC Ltd.


                   XI plan target -2007-2012
                   Sector                                 Thermal              Total    Hydro   Nuclear     Total
                                                      Coal Lignite     Gas

                   Central Sector                   24,310   1,000   1,490   26,800     9,685    3,380    39,865
                   State Sector                     23,135     450     762   24,347     3,605        0    27,952
                   Private Sector                    5,460       0   2,037    7,497     3,263        0    10,760
                   Total                            52,905   1,450   4,289   58,644    16,553    3,380    78,557
                    Source: CEA, Natverlal & Sons


               The Transmission and distribution sector has experienced inadequate attention and
               funding, resulting in the underdevelopment of the T&D sector in India. Years of
               neglect have also resulted in T&D losses increasing to as high as 35% of the total, on an
               aggregate basis. The government, through various nodal agencies in the power sector,
               has initiated various programs, especially for the T&D sector. This is in order to
               strengthen transmission network and reduce distribution losses. According to Central
               Electricity Authority, investments needed in Transmission and Distribution (T&D) will
               be in excess of Rs70bn in the next 5 years. With NTPC looking to get into the T&D space
               though its subsidiary, this throws up huge opportunities.

               In the past two Five-Year Plans, efforts to enhance power generating capacities have
               been slipshod. To ensure better execution of commissioned projects, the government
               has taken initiatives such as the development of Ultra Mega Power Projects (UMPPs),
               each with a capacity of 4,000MW or above. Nine sites were identified by CEA in
               different states for the proposed UMPPs. This encourages the private sector to
               participate at the three stages of generation, transmission and distribution. These
               initiatives will lead to the commissioning of a substantive percentage of planned
               capacity during the current plan. Through vertical integrations, NTPC will participate
               in all levels and stand to benefit.


  NATVERLAL & SONS
                                                                                                                    3
NATSONS RESEARCH                                                                     NTPC Ltd.


               Investment Rationale
               Strong capacity addition and revenue growth:
               NTPC plans to add a capacity of 22,430MW, taking the total capacity to 50,000MW by
               2012 and to 75,000MW by 2017. In the 11th Plan, 1,990 MW was commissioned,
               16,680 MW was under construction and 3,670MW was tendered. It plans to add
               2,820MW in FY09 and 3,600MW in FY10. Besides this, the company will contribute
               56.67% to the Central Sector share by adding around 22,000MW during the 11th Plan.

                                      Owned by NTPC                            Owned JV's Total
                                      Coal       Hydro     Gas      Total
                2007-08                     1000                          1000         740      1740
                2008-09                     2320       800                2320         500      2820
                2009-10                     2800                          3600                  3600
                2010-11                     2820               1300       4120        2500      6620
                2011-12                     4230      1120     1300       6650        1000      7650
                Total                      13170      1920     2600     17690         4740     22430
               Source: NTPC's XI plan capacity addition target-2007-2012


               Further, the company is planning to add 2,820MW during FY09 and 3,600MW during
               FY10. Out of a 2,820MW capacity to be added in FY09, 250MW has already been
               commissioned during the current year in a joint venture with SAIL. Moreover,
               1,000MW of capacity was concurrently commercialized. We expect another
               1,000MW to be commissioned this year and 2,800MW to be commissioned in FY10.

               Lower expectations in the commissioning front are due to the project delays for a host
               of reasons. For instance Barh-I with a generating capacity of 1,980MW has been
               delayed due to disputes over contract value with two Russian equipment suppliers.
               The commissioning of new projects across the country by multiple players is creating a
               shortage of Balance of Plant (BoP) and forged equipment material. This shortage in
               capacity coupled with poor transport infrastructure causes delays in establishing
               plants. However, we have factored in these delays, and adjusted them towards our
               projections.

                    Planned capacity additions
                    2008-09                                          2009-10
                    Kahalgoan II                500 MV               Barh                660MV
                    Sipat II                    500MV                Sipat               660MV
                    Sipat I                    1320 MV               Korba               500MV
                    Bhilai                      500MV                Dadri               980MV
                                                                     Koldam              800MV
                    Total FY'09                               2820MV Total FY’10         3600M
                  source: NTPC
               Huge capex planned:
               NTPC Capex for FY09 is expected to be around Rs.135.58bn, which is 60% more than
               the Rs.86.21bn in the previous fiscal. We do believe that the company would be able
               to fund its five-year Capex program (11FYP) from internal accruals, through the
               redemption of the OTS Bonds and additional debt. We do not expect any further
               dilution of its equity base. A low gearing ratio of 0.5x in FY08, coupled with CERC
               guidelines on the normative debt-equity ratio at 70:30; are factors that tilt towards
               increase in the company's debt levels.


  NATVERLAL & SONS
                                                                                                       4
NATSONS RESEARCH                                                                    NTPC Ltd.


               Operational efficiency incentives:
               Operational efficiency has improved in recent years. NTPC's Plant Load Factor (PLF)
               stood at 92.24 % for coal stations compared to 89.43% in the last fiscal. This resulted in
               higher revenues in the form of incentive income. This has been achieved by
               consistently improving its high plant availability and load factors by conducting
               periodic repairs and maintenance of its plants. PLF for gas stations declined to 68.14%
               during FY08 compared to 71.9% during FY07. The lower PLF recorded for gas based
               plants is due to shortage in the availability of gas.
                  PLF                                                   2 00 8               2 007
                  C o a l St a t io n s                              9 2 .2 4 %          8 9 .4 3 %
                  G as S t a t i o n s                               6 8 .1 4 %          7 1 .9 0 %
                  A l l In d i a                                     7 8 .6 1 %          7 6 .8 0 %

                   Source NTPC


               The regulated incentive for operating at plant loads over 80% is 25 paise / unit of
               electricity for thermal power plants. In case of NTPC this incentive is fixed at the
               regulated level of 80% for all its operational power plants, except for Talcher Thermal
               Power Station (TPS) where the threshold incentive is 75% and for the Tanda TPS,
               whose threshold incentive is 60%. We expect them, in the future, to continue the
               incentives, while maintaining their PLF's.

               Commercial performance:
               NTPC has PPAs (power purchase agreements) signed for almost all of the power it
               produces with various SEBs. After the amendment of the Electricity Act, the recovery
               rate of dues from SEBs improved significantly (100% last year) and Letters of Credit to
               the extent of 105% of average monthly billing were established by customers. NTPC,
               through its incentive scheme for encouraging prompt payments rebate is allowed a
               maximum of 2.25% in case payments are made within a month.

               All variable costs such as fuel prices are passed on to the customers, following CERC
               regulation. So, margins will remain intact as input prices rise. NTPC has long term fuel
               supply agreements (FSA) with a maximum price escalation of 2.5%. As a large part of
               the power generated is from coal— much of which is sourced from pithead coal
               stations—production costs remain low.

               Merchant plants:
               Merchant power is a concept in which power generated is not sold through medium or
               long term contracts, but instead sold short term to a buyer willing to pay the highest
               price. NTPC is setting up 2,120MW as merchant power plants, of which, 1,120MW are
               hydro-based units, in which operational costs are minimal. This would lead to huge
               upsides when sold at market rates. We expect 500MW of power to be generated
               through merchant power plants which will be commissioned in FY10.

               Overseas forays:
               NTPC has signed a MOU with the Ministry of Energy, Federal Government of Nigeria
               (FGN) for gas supplies, whereby FGN will provide a minimum of 3MTPA of LNG to NTPC
               on a long-term basis at a reasonable price. In return NTPC will establish and operate
               one 500MW coal-based power plant and a 700MW gas-based power plant in Nigeria
               independently, or through a joint venture.


  NATVERLAL & SONS
                                                                                                        5
NATSONS RESEARCH                                                                   NTPC Ltd.


               Strong balance sheet:
               NTPC has in its books, cash of Rs149.33bn and investments worth Rs152.67bn. The
               investments include Rs131.24bn bonds issued under a one time settlement scheme;
               these are generating 8.5% tax-free returns. Its debt-equity (D/E) stands at 0.5x for
               FY08, this leaves sufficient room for further debt- raising for its planned expansions.
               We expect that the D/E will rise to 0.6x in FY09 and 0.8x in FY10, based on its expansion
               plans.

               Integrated power major:
               Presently, NTPC is vertically integrating to transform successfully into a fully
               integrated power major.

               Backward integration:
               By way of backward integration, the company is diversifying into captive coal mining
               trough JVs. This is an attempt to secure future coal supplies. They are working on a coal
               block, Pakri Barwadih, as a measure to ensure regular supplies. Seven coal blocks were
               allotted by the government of India with mineable reserves of 3bn MT. The company is
               planning to extract 12 MTPA by FY12 and 47 MTPA by FY2017. The outlay to develop
               these mines is Rs.5430 million initially.

               The company has a 20% stake in Coal Ventures International, an equal partner JV
               between NTPC, Steel Authority of India Limited (SAIL), Rashtriya Ispat Nigam Limited
               (RINL), Coal India Limited (CIL) and National Mineral Development Corporation
               Limited (NMDC). The company's aim is to form a Special Purpose Vehicle (SPV) for
               securing thermal coal from outside India.

               In consortium with Canoro Resources and Geo Petro International, NTPC has been
               allotted an oil exploration block under NELP-V in Arunachal Pradesh. The company will
               hold the majority 40% share, with 30% each being owned by the other two partners.
               On the other hand, fuel linkages for NTPC are available for only 11.3 mmscmd as
               against a demand of 16 mmscmd. The average supply is still short at 4.7 mmscmd.

               Lateral integration:
               By way of lateral integration, NTPC's special thrusts in hydropower, nuclear power,
               and renewable power is targeted at achieving operational and commercial synergies.
               We believe that substantial hydro capacity and renewable power will help the
               company register environmental and economic gains in the long run. The company
               has set up 'NTPC Hydro Limited' to carry out the business of implementing and
               operating small and medium hydro power projects in the country.

               It entered into a JV with Asian Development Bank (ADB), GE Energy Financial
               Services, Japan-based Kysushu Electric Power Co and Brookfield Renewable Power
               of the US for Renewable power to meet its target of 500 MW of renewable power
               generation in the next three years. NTPC will hold 40% of the equity and the rest will be
               shared equally in these ventures.

               Forward integration:
               NTPC entered the power trading and power distribution business by a way of a
               forward integration process through its subsidiaries, NTPC Electric Supply Company
               Limited and NTPC Vidyut Vyapar Nigam Limited respectively.


  NATVERLAL & SONS
                                                                                                       6
NATSONS RESEARCH                                                                    NTPC Ltd.


               Valuations:
               We expect the company to maintain its strong growth story into the future. Revenue,
               we feel, will grow at a CAGR of 15.1%, while profit will grow at 10% through to
               FY10E.With large portions of the current expansion plans set to come in FY11 and
               FY12, we believe the growth will accelerate during the corresponding years ahead. At
               the current price of Rs170 the stock is trading at a P/E of 17.7x and 15.9x and an
               EV/EBIDTA of 13.8x and 12.2x FY09E and FY10E. The ROE for FY09E is 14.4% and is
               expected to improve slightly to 14.7% in FY10E.

               We feel that at the current price the stock looks very attractive. We believe a P/E of 20x
               is justifiable with the strong power generation growth expected over the next few
               years. In addition, NTPC's cash and equivalents of Rs158.0bn and investments of
               Rs152.6 bn is a cushion for the company that will help fund the massive capital
               expenditure for the 11th five year plan. This said, we have not yet factored in any
               upside from its subsidiaries and joint ventures. At 2.2x its FY10 P/BV, we believe
               NTPC's stock is looking attractive at these levels over the long term. Taking these
               factors into consideration we are rating the stock a 'BUY' with a price target of Rs218,
               and an upside potential of 25.7% from the current levels.


   NATVERLAL & SONS
                                                                                                        7
NATSONS RESEARCH                                                                   NTPC Ltd.


               Key Risks & Concerns:
               Fuel shortages:
               In recent times, NTPC has faced constraints on securing continuous fuel supply to its
               coal and gas based power plants. This will affect the company's PLF and consequently
               its profitability. The company was, in fact, planning to import up to 8 million tonnes
               (MT) of coal in FY09. We believe that this is a manageable risk in the medium term,
               considering the fact that the shortage is only a small part of the company's annual
               consumption of close to 125MT of coal. All upcoming projects are introducing fuel
               linkages, however supply side constraints or pricing issues are bound to affect the
               production.

               Project execution delays:
               Due to a long gestation period for power projects, any delay in project execution will
               lead to lower growth of production volumes and affect profitability. A surge in the
               procurement of power generation equipment could lead to delays in placing orders
               for key plant and machinery (boilers, turbines and generators - BTG) which could lead
               to an inability to implement the projects on time. We expect that a tendered capacity
               of 3670MW won't come into play in this plan. However, we have factored in an
               expected number of project delays.

               Regulatory risks:
               The power sector, being highly regulated, as per the Central Electricity Regulatory
               Commission's (CERC) tariff regulations, RoE is fixed at 14% to post tax profits with debt
               - equity at 70:30 till FY'09. Changes detrimental to the power sector in the new
               Electricity Act will adversely affect the returns of power companies. However the
               government's thrust in the sector is required to ensure a regular and increasing power
               generation capacity to fuel the country's economic growth. Thus, it is unlikely that the
               government will put a brake to development in this crucial sector.

               Carbon emissions:
               Nearly 85% of NTPC's existing capacity and 78% of its FY12E capacity will be coal-
               based. With increasing concerns on global warming, any regulatory change could
               adversely impact power companies, including NTPC, denting their earnings.


   NATVERLAL & SONS
                                                                                                       8
NATSONS RESEARCH                                                                   NTPC Ltd.


               Company Background:
               NTPC, the largest power company in India, was established in 1975 by the
               Government of India to accelerate power development in the country. In 1992, the
               company's transmission division was hived off: this is now known as the Power Grid
               Corporation of India Ltd (PGCIL) which is the nodal agency for all transmission projects
               in the country. In 1997, NTPC Ltd was identified as one of the Navratna public sector
               undertakings thereby according it leeway in its operating and investment activities. It
               is among the largest and most efficient power generation companies in the world with
               an installed capacity of 29394 MW (including 2,044MW through joint ventures).

               NTPC has 15 coal based power stations (23,395 MW), 7 gas based power stations
               (3,955 MW) and 4 power stations in joint ventures (1,794 MW). NTPC's share in the
               total installed capacity of the country was 19.1% and it contributed 28.50% of the total
               power generation of the country during 2007-08. In addition, it provides consultancy
               services to various organizations in the power business in the areas of power plant
               constructions and power generation to companies in India and overseas.

               Its six subsidiaries are: NTPC Electric Supply Company Ltd. (100%), NTPC Vidyut
               Vyapar Nigam Ltd.(100%), NTPC Hydro Ltd.(100%), Kanti Bijlee Utpadan Nigam
               Ltd.(51%), Bhartiya Rail Bijlee Company Ltd.(74%), Pipavav Power Development Co
               Ltd(100%). The last is currently winding up.

               Its eleven joint ventures are: PTC India Ltd. (5.28%), Utility Powertech Ltd. (50%),
               –NTPC SAIL Power Co. (Pvt.) Ltd. (50%), NTPC Alstom Power Services Pvt. Ltd.(50%),
               NTPC Tamilnadu Energy Co. Ltd. (50%), Ratnagiri Gas & Power Pvt. Ltd. (28.33%),
               Aravali Power Company Pvt. Ltd. (50%), NTPC-SCCL Global Ventures Private Ltd.(50%),
               Meja Urja Nigam Pvt. Ltd.(50%), NTPC-BHEL Power Projects Pvt. Ltd.(50%), BF-NTPC
               Energy Systems Ltd. (49%).

               Share Holding pattern:

                    Corporate             DII, 2.55            retail, 2.61
                   bodies, 1.21
                       FII, 4.13


                                                             Govt, 89.50


   NATVERLAL & SONS
                                                                                                      9
NATSONS RESEARCH                                                                                                                                                                          NTPC Ltd.

Financials

Profit & Loss                                                                                                  Balance Sheet
In Rs million                  FY07              FY08               FY09E              FY010E                  In Rs million                          FY07              FY08              FY09E         FY10E
Net sales                   326,358           370,974             416,255             492,302                  Equity capital                       82,455            82,455             82,455        82,455
YoY (%)                        24.8              13.7                12.2                18.3                  Reserves                            403,513           443,931            486,083       532,371
Total expenses              225,494           255,517             284,854             335,361                  Deferred Revenue                      6,567            13,734             17,438        20,825
EBIDTA                      100,864           115,457             131,401             156,941                  Net worth                           492,535           540,120            585,976       635,651
YoY (%)                        34.9              14.5                13.8                19.4                  Total borrowings                    244,844           271,906            362,906       510,906
EBIDTA (%)                     30.9              31.1                31.6                31.9                  Ex-chg fluctuation                        0             2,554                  0             0
                                                                                                               Total liabilities                   737,380           814,581            948,883     1,146,558
Other income                 27,449            29,203              27,300              25,350
PBIDT                       128,313           144,660             158,701             182,291                  Net block                           256,481           260,937            316,765      429,468
Depreciation                 20,754            21,385              22,922              27,297                  CWIP                                128,567           184,389            243,089      310,089
PBIT                        107,559           123,275             135,779             154,994                  Construction stores                  39,825            40,394             40,394       50,394
Interest                     18,594            17,981              23,805              30,583                  Investme nts                        160,943           152,672            140,000      130,000
Prior Period exp              (109)             2,745                    0                   0                 Current assets                      221,827           255,488            297,039      330,686
PBT                          89,074           102,549             111,974             124,410                  Inventories                          25,102            26,757             30,024       35,512
(-) Tax                      20,434            28,486              31,318              34,795                  Debtors                              12,523            29,827             33,469       39,587
  Current Tax                20,280            28,317              31,129              34,586                  Cash                                133,146           149,332            182,974      204,015
  Deferred Tax                     0                 0                   0                   0                 Oth curr assets                      10,580             9,218              9,718       10,218
  Fringe benefit tax            154               169                 189                 209                  Loans and advance                    40,476            40,354             40,854       41,354
Tax/ PBT                         23                 28                  28                  28
PAT                          68,640            74,063              80,656              89,615                  Current liabilities                  54,221            55,483             61,853       72,820
Extra-ordinary exp               (7)              (85)                (85)                (85)                 Provisions                           16,042            23,816             26,550       31,258
Net Profit                   68,647            74,148              80,741              89,700                  Net current assets                  151,564           176,189            208,635      226,607

Cash Flow                                                                                                      Key Ratios
In Rs million                   FY07              FY08               FY09E              FY10E                                                            FY07              FY08            FY09E      FY010E
Net profit                    68,647            74,148              80,741             89,700                  EPS (Rs)                                    8.3               9.0             9.8        10.9
Depn and w/o                  20,754            21,385              22,922             27,297                  CEPS (Rs)                                  10.8              11.6            12.6        14.2
Misc expenditure                   0             2,554             (2,554)                  0                  Book value (Rs)                            58.9              63.8            69.0        74.6
Change in wrkg cap           (7,289)           (8,439)               1,195              3,069                  DPS (Rs)                                    3.2               3.5             4.0          4.5
Other income                (27,449)          (29,203)            (27,300)           (25,350)                  Debt-equity (x)                             0.5               0.5             0.6          0.8
Deferre d Revenue              2,159             7,167               3,704              3,387                  ROCE                                       15.6              16.1            15.7        15.1
Operating cash
flow                          56,822            67,612             78,709             98,104                   ROE                                        14.7             14.6              14.7        15.2
Other income                  27,449            29,203             27,300             25,350
Capex                       (78,929)          (82,798)          (137,450)          (217,000)                   Va luations
Investments                   31,948             8,271             12,672             10,000                   PE (x)                                     20.8             19.3              17.7        15.9
Investing cash flow         (19,532)          (45,324)           (97,478)          (181,650)                   Cash PE (x)                                16.0             15.0              13.8        12.2
Dividend                    (30,281)          (33,764)           (38,589)           (43,413)                   Price/book value (x)                        2.9              2.7               2.5         2.3
Equity                             0                 0                  0                  0                   Dividend yield                              1.8              2.0               2.3         2.6
Debt                          42,871            27,062             91,000            148,000                   Market cap/sales                            4.4              3.9               3.4         2.9
Financing cas h flow          12,590           (6,702)             52,411            104,587                   EV/sales (x)                                5.1              4.6               4.3         3.9
Net change in cash            49,880            15,586             33,642             21,041                   EV/EBDITA (x)                              16.6             14.7              13.6        12.4


                 Disclaimer

                 The information provided in the document is from publicly available data and other sources, which we believe are reliable. It also includes analysis and views expressed by
                 our research team.
                 The report is purely for information purposes and does not construe to be investment recommendation/advice. Investors should not solely rely on the information
                 contained in this document and must make investment decisions based on their own investment objectives, risk profile and financial position. Efforts are made to try and
                 ensure accuracy of data however, Natverlal & Sons Stockbrokers Pvt Ltd. And / or any of its affiliates and / or employees shall not be liable for loss or damage that may arise
                 from any error in this document. Natverlal & Sons Stockbrokers Pvt Ltd and / or any of its affiliates and / or employees may or may not hold positions in any of the securities
                 mentioned in the document.
                 This document is not for public distribution and should not be reproduced or redistributed without prior permission.


        NATVERLAL & SONS
                                                                                                                                                                                                                10

Weitere ähnliche Inhalte

Was ist angesagt?

Elecon engineering ic- 14-05-10
Elecon engineering   ic- 14-05-10Elecon engineering   ic- 14-05-10
Elecon engineering ic- 14-05-10Angel Broking
 
charter communications 1Qslides_FINAL
charter communications 1Qslides_FINALcharter communications 1Qslides_FINAL
charter communications 1Qslides_FINALfinance34
 
charter communications 2Q07_Slides
charter communications 2Q07_Slidescharter communications 2Q07_Slides
charter communications 2Q07_Slidesfinance34
 
Hcl tech 1 qfy2011-211010
Hcl tech  1 qfy2011-211010Hcl tech  1 qfy2011-211010
Hcl tech 1 qfy2011-211010Angel Broking
 
charter communications 4Q2007_Earnings_Presentation_vFINAL
charter communications 4Q2007_Earnings_Presentation_vFINALcharter communications 4Q2007_Earnings_Presentation_vFINAL
charter communications 4Q2007_Earnings_Presentation_vFINALfinance34
 

Was ist angesagt? (6)

BHEL -Result Update
BHEL -Result UpdateBHEL -Result Update
BHEL -Result Update
 
Elecon engineering ic- 14-05-10
Elecon engineering   ic- 14-05-10Elecon engineering   ic- 14-05-10
Elecon engineering ic- 14-05-10
 
charter communications 1Qslides_FINAL
charter communications 1Qslides_FINALcharter communications 1Qslides_FINAL
charter communications 1Qslides_FINAL
 
charter communications 2Q07_Slides
charter communications 2Q07_Slidescharter communications 2Q07_Slides
charter communications 2Q07_Slides
 
Hcl tech 1 qfy2011-211010
Hcl tech  1 qfy2011-211010Hcl tech  1 qfy2011-211010
Hcl tech 1 qfy2011-211010
 
charter communications 4Q2007_Earnings_Presentation_vFINAL
charter communications 4Q2007_Earnings_Presentation_vFINALcharter communications 4Q2007_Earnings_Presentation_vFINAL
charter communications 4Q2007_Earnings_Presentation_vFINAL
 

Andere mochten auch

International Group of Funding Agencies
International Group of Funding AgenciesInternational Group of Funding Agencies
International Group of Funding AgenciesLouise Smith
 
Yetiskin egitimi
Yetiskin egitimiYetiskin egitimi
Yetiskin egitimitubaozerrr
 
Are you paying attention
Are you paying attentionAre you paying attention
Are you paying attentionYash Guitarman
 
Mi currículum
Mi currículumMi currículum
Mi currículumPat1989
 
Mi currículum
Mi currículumMi currículum
Mi currículumPat1989
 
I seek you icq
I seek you  icqI seek you  icq
I seek you icqannaglusco
 
Prospectus brochure large
Prospectus brochure largeProspectus brochure large
Prospectus brochure largeRobertMcCarthy
 

Andere mochten auch (9)

Igfa presentation
Igfa presentationIgfa presentation
Igfa presentation
 
International Group of Funding Agencies
International Group of Funding AgenciesInternational Group of Funding Agencies
International Group of Funding Agencies
 
Yetiskin egitimi
Yetiskin egitimiYetiskin egitimi
Yetiskin egitimi
 
Are you paying attention
Are you paying attentionAre you paying attention
Are you paying attention
 
Mi currículum
Mi currículumMi currículum
Mi currículum
 
Mi currículum
Mi currículumMi currículum
Mi currículum
 
I seek you icq
I seek you  icqI seek you  icq
I seek you icq
 
Prospectus brochure large
Prospectus brochure largeProspectus brochure large
Prospectus brochure large
 
Love versus sleep
Love versus sleepLove versus sleep
Love versus sleep
 

Ähnlich wie Ntpc ltd -_natsons_research_8-09-2008

ICICIdirect_PTC_Report
ICICIdirect_PTC_ReportICICIdirect_PTC_Report
ICICIdirect_PTC_ReportJitesh Bhanot
 
Investment Idea - JSW Energy Limited (JSWEL) : Recommended as "BUY"
Investment Idea  - JSW Energy Limited (JSWEL) : Recommended as "BUY"Investment Idea  - JSW Energy Limited (JSWEL) : Recommended as "BUY"
Investment Idea - JSW Energy Limited (JSWEL) : Recommended as "BUY"Fullerton Securities
 
Elecon engineering ic- 14-05-10
Elecon engineering   ic- 14-05-10Elecon engineering   ic- 14-05-10
Elecon engineering ic- 14-05-10Angel Broking
 
Motilal oswal coalindia_26june15
Motilal oswal coalindia_26june15Motilal oswal coalindia_26june15
Motilal oswal coalindia_26june15IndiaNotes.com
 
Presentation 2Q12
Presentation 2Q12Presentation 2Q12
Presentation 2Q12Cteep
 
Presentation 3Q12
Presentation 3Q12Presentation 3Q12
Presentation 3Q12Cteep
 
Ntpc 2 qfy11 result update - 271010
Ntpc   2 qfy11 result update - 271010Ntpc   2 qfy11 result update - 271010
Ntpc 2 qfy11 result update - 271010Angel Broking
 
Case study bhel sj
Case study bhel sjCase study bhel sj
Case study bhel sjershubham
 
Irb infrastructure developers ltd q2 fy12 result update
Irb infrastructure developers ltd   q2 fy12 result updateIrb infrastructure developers ltd   q2 fy12 result update
Irb infrastructure developers ltd q2 fy12 result updateKeynote Capitals Ltd.
 
China energy 110929
China energy 110929China energy 110929
China energy 110929Ahmad Halim
 
Il&fs transportation networks ltd q2 fy12 result update
Il&fs transportation networks ltd   q2 fy12 result updateIl&fs transportation networks ltd   q2 fy12 result update
Il&fs transportation networks ltd q2 fy12 result updateKeynote Capitals Ltd.
 
Ultratech Cement Q1FY15: Buy at CMP for target of Rs2592
 Ultratech Cement Q1FY15: Buy at CMP for target of Rs2592 Ultratech Cement Q1FY15: Buy at CMP for target of Rs2592
Ultratech Cement Q1FY15: Buy at CMP for target of Rs2592IndiaNotes.com
 
Performance-management-system-at-ntpc
 Performance-management-system-at-ntpc Performance-management-system-at-ntpc
Performance-management-system-at-ntpcAmrita Singh
 
KENGEN_VALUATION_REPORT
KENGEN_VALUATION_REPORTKENGEN_VALUATION_REPORT
KENGEN_VALUATION_REPORTPaul Maina
 
Kpr mill report_update_q3_fy12_v17_apr_2012
Kpr mill report_update_q3_fy12_v17_apr_2012Kpr mill report_update_q3_fy12_v17_apr_2012
Kpr mill report_update_q3_fy12_v17_apr_2012Four-S
 

Ähnlich wie Ntpc ltd -_natsons_research_8-09-2008 (20)

ICICIdirect_PTC_Report
ICICIdirect_PTC_ReportICICIdirect_PTC_Report
ICICIdirect_PTC_Report
 
Petronet lng
Petronet lngPetronet lng
Petronet lng
 
Investment Idea - JSW Energy Limited (JSWEL) : Recommended as "BUY"
Investment Idea  - JSW Energy Limited (JSWEL) : Recommended as "BUY"Investment Idea  - JSW Energy Limited (JSWEL) : Recommended as "BUY"
Investment Idea - JSW Energy Limited (JSWEL) : Recommended as "BUY"
 
ntpc soft
ntpc softntpc soft
ntpc soft
 
Elecon engineering ic- 14-05-10
Elecon engineering   ic- 14-05-10Elecon engineering   ic- 14-05-10
Elecon engineering ic- 14-05-10
 
Motilal oswal coalindia_26june15
Motilal oswal coalindia_26june15Motilal oswal coalindia_26june15
Motilal oswal coalindia_26june15
 
Presentation 2Q12
Presentation 2Q12Presentation 2Q12
Presentation 2Q12
 
Presentation 3Q12
Presentation 3Q12Presentation 3Q12
Presentation 3Q12
 
Ntpc 2 qfy11 result update - 271010
Ntpc   2 qfy11 result update - 271010Ntpc   2 qfy11 result update - 271010
Ntpc 2 qfy11 result update - 271010
 
Case study bhel sj
Case study bhel sjCase study bhel sj
Case study bhel sj
 
Irb infrastructure developers ltd q2 fy12 result update
Irb infrastructure developers ltd   q2 fy12 result updateIrb infrastructure developers ltd   q2 fy12 result update
Irb infrastructure developers ltd q2 fy12 result update
 
Reports ntpc
Reports ntpcReports ntpc
Reports ntpc
 
China energy 110929
China energy 110929China energy 110929
China energy 110929
 
Il&fs transportation networks ltd q2 fy12 result update
Il&fs transportation networks ltd   q2 fy12 result updateIl&fs transportation networks ltd   q2 fy12 result update
Il&fs transportation networks ltd q2 fy12 result update
 
EF_HUBCO_0711
EF_HUBCO_0711EF_HUBCO_0711
EF_HUBCO_0711
 
Ultratech Cement Q1FY15: Buy at CMP for target of Rs2592
 Ultratech Cement Q1FY15: Buy at CMP for target of Rs2592 Ultratech Cement Q1FY15: Buy at CMP for target of Rs2592
Ultratech Cement Q1FY15: Buy at CMP for target of Rs2592
 
Performance-management-system-at-ntpc
 Performance-management-system-at-ntpc Performance-management-system-at-ntpc
Performance-management-system-at-ntpc
 
KENGEN_VALUATION_REPORT
KENGEN_VALUATION_REPORTKENGEN_VALUATION_REPORT
KENGEN_VALUATION_REPORT
 
Kpr mill report_update_q3_fy12_v17_apr_2012
Kpr mill report_update_q3_fy12_v17_apr_2012Kpr mill report_update_q3_fy12_v17_apr_2012
Kpr mill report_update_q3_fy12_v17_apr_2012
 
Ptti2112011 (!)
Ptti2112011 (!)Ptti2112011 (!)
Ptti2112011 (!)
 

Ntpc ltd -_natsons_research_8-09-2008

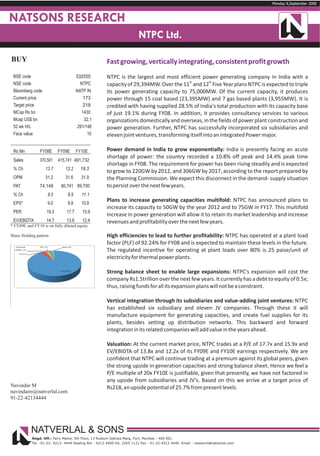
  • 1. Monday 8,September 2008 Tuesday 27, May 2008 NATSONS RESEARCH ICSA NTPC Ltd. BUY Fast growing, vertically integrating, consistent profit growth BSE code 532555 NTPC is the largest and most efficient power generating company in India with a th th NSE code NTPC capacity of 29,394MW. Over the 11 and 12 Five Year plans NTPC is expected to triple Bloomberg code NATP IN its power generating capacity to 75,000MW. Of the current capacity, it produces Current price 173 power through 15 coal based (23,395MW) and 7 gas based plants (3,955MW). It is Target price 218 credited with having supplied 28.5% of India's total production with its capacity base MCap Rs bn 1430 of just 19.1% during FY08. In addition, it provides consultancy services to various Mcap US$ bn 32.1 organizations domestically and overseas, in the fields of power plant construction and 52 wk H/L 291/148 power generation. Further, NTPC has successfully incorporated six subsidiaries and Face value 10 eleven joint ventures, transforming itself into an integrated Power major. Rs Mn FY08E FY09E FY10E Power demand in India to grow exponentially: India is presently facing an acute shortage of power: the country recorded a 10.8% off peak and 14.4% peak time Sales 370,501 415,741 491,732 shortage in FY08. The requirement for power has been rising steadily and is expected % Ch 13.7 12.2 18.3 to grow to 220GW by 2012, and 306GW by 2017, according to the report prepared by OPM 31.2 31.6 31.9 the Planning Commission. We expect this disconnect in the demand- supply situation PAT 74,148 80,741 89,700 to persist over the next few years. % Ch 8.0 8.9 11.1 EPS* 9.0 9.8 10.9 Plans to increase generating capacities multifold: NTPC has announced plans to increase its capacity to 50GW by the year 2012 and to 75GW in FY17. This multifold PER 19.3 17.7 15.9 increase in power generation will allow it to retain its market leadership and increase EV/EBIDTA 14.7 13.6 12.4 revenues and profitability over the next few years. * FY09E and FY10 is on fully diluted equity Share Holding pattern High efficiencies to lead to further profitability: NTPC has operated at a plant load factor (PLF) of 92.24% for FY08 and is expected to maintain these levels in the future. Corporate DII, 2.55 retail, 2.61 bodies, 1.21 The regulated incentive for operating at plant loads over 80% is 25 paise/unit of FII, 4.13 electricity for thermal power plants. Govt, 89.50 Strong balance sheet to enable large expansions: NTPC's expansion will cost the company Rs1.5trillion over the next few years. It currently has a debt to equity of 0.5x; thus, raising funds for all its expansion plans will not be a constraint. Vertical integration through its subsidiaries and value-adding joint ventures: NTPC has established six subsidiary and eleven JV companies. Through these it will manufacture equipment for generating capacities, and create fuel supplies for its plants, besides setting up distribution networks. This backward and forward integration in its related companies will add value in the years ahead. Valuation: At the current market price, NTPC trades at a P/E of 17.7x and 15.9x and EV/EBIDTA of 13.8x and 12.2x of its FY09E and FY10E earnings respectively. We are confident that NTPC will continue trading at a premium against its global peers, given the strong upside in generation capacities and strong balance sheet. Hence we feel a P/E multiple of 20x FY10E is justifiable, given that presently, we have not factored in any upside from subsidiaries and JV's. Based on this we arrive at a target price of Navindar M Rs218, an upside potential of 25.7% from present levels. navindarm@natverlal.com 91-22-42134444 NATVERLAL & SONS Regd. Off.: Fairy Manor, 5th Floor, 13 Rustom Sidhwa Marg, Fort, Mumbai - 400 001. Tel. :91-22- 4213- 4444 Dealing Rm : 4213 4400-04, 2265 1121 Fax : 91-22-4213 4440 Email : research@natverlal.com
  • 2. NATSONS RESEARCH NTPC Ltd. Industry Outlook India is the fifth largest power consuming country in the world with a 3.8% share globally. It is the 3rd largest power consuming nation in Asia with an 11.3% share. India has a total power generating capacity of 143,061MW as of March 2008. The government has outlined a plan which envisages an addition of 78,577MW of generation capacity by 2012; this will take the total capacity to 200,000MW by 2017. The Indian per capita consumption is 704Kwh, which is significantly lower than other BRIC countries. Our National Electricity Policy (NEP) expects the per capita electricity consumption to reach 1,000Kwh by 2012—from 704Kwh in 2007-08. Per Capita Consumption(Kwh) World Average 2701 USA 14240 Japan 8459 Russia 6425 Brazil 2340 China 1684 India 704 0 2000 4000 6000 8000 10000 12000 14000 16000 Source: NTPC and Natverlal & Sons Through FY08 India witnessed a deficit of power of 10.8% during off peak and 14.4% during peak hours. We expect this mismatch in demand and supply to persist over the next few years. As illustrated, power demand will reach 220GW by 2012 whereas supply will touch just 200GW. Growth in India's power generation sector has been scuttled due to the low plant availability factor and lower PLF due to the inefficiently run plants of the State Electricity Board (SEB). A scarcity of fuels has also been a key reason for low PLF's in many plants throughout India. Gas- based plants face shutdowns due to unavailability of gas caused by production delays. These factors have led to actual energy generation being less than the generation potential. However, even in this scenario, NTPC recorded a much higher PLF than the industry average, due to a better long term relationship with fuel suppliers. Fuel wise break-up(MV) Private Thermal 91907 64.20% Sector, 14% Hydro 35909 25.10% State Nuclear 4120 2.80% Sector, renewable 11125 7.90% 52% Total 143061 100% Central Source: NTPC, Natverlal & Sons Sector, 34% In India the power generation is produced by either the central government, the state government or the private sector. The private sector was recently allowed to enter the power space and hence the low % of generation. NATVERLAL & SONS 2
  • 3. NATSONS RESEARCH NTPC Ltd. XI plan target -2007-2012 Sector Thermal Total Hydro Nuclear Total Coal Lignite Gas Central Sector 24,310 1,000 1,490 26,800 9,685 3,380 39,865 State Sector 23,135 450 762 24,347 3,605 0 27,952 Private Sector 5,460 0 2,037 7,497 3,263 0 10,760 Total 52,905 1,450 4,289 58,644 16,553 3,380 78,557 Source: CEA, Natverlal & Sons The Transmission and distribution sector has experienced inadequate attention and funding, resulting in the underdevelopment of the T&D sector in India. Years of neglect have also resulted in T&D losses increasing to as high as 35% of the total, on an aggregate basis. The government, through various nodal agencies in the power sector, has initiated various programs, especially for the T&D sector. This is in order to strengthen transmission network and reduce distribution losses. According to Central Electricity Authority, investments needed in Transmission and Distribution (T&D) will be in excess of Rs70bn in the next 5 years. With NTPC looking to get into the T&D space though its subsidiary, this throws up huge opportunities. In the past two Five-Year Plans, efforts to enhance power generating capacities have been slipshod. To ensure better execution of commissioned projects, the government has taken initiatives such as the development of Ultra Mega Power Projects (UMPPs), each with a capacity of 4,000MW or above. Nine sites were identified by CEA in different states for the proposed UMPPs. This encourages the private sector to participate at the three stages of generation, transmission and distribution. These initiatives will lead to the commissioning of a substantive percentage of planned capacity during the current plan. Through vertical integrations, NTPC will participate in all levels and stand to benefit. NATVERLAL & SONS 3
  • 4. NATSONS RESEARCH NTPC Ltd. Investment Rationale Strong capacity addition and revenue growth: NTPC plans to add a capacity of 22,430MW, taking the total capacity to 50,000MW by 2012 and to 75,000MW by 2017. In the 11th Plan, 1,990 MW was commissioned, 16,680 MW was under construction and 3,670MW was tendered. It plans to add 2,820MW in FY09 and 3,600MW in FY10. Besides this, the company will contribute 56.67% to the Central Sector share by adding around 22,000MW during the 11th Plan. Owned by NTPC Owned JV's Total Coal Hydro Gas Total 2007-08 1000 1000 740 1740 2008-09 2320 800 2320 500 2820 2009-10 2800 3600 3600 2010-11 2820 1300 4120 2500 6620 2011-12 4230 1120 1300 6650 1000 7650 Total 13170 1920 2600 17690 4740 22430 Source: NTPC's XI plan capacity addition target-2007-2012 Further, the company is planning to add 2,820MW during FY09 and 3,600MW during FY10. Out of a 2,820MW capacity to be added in FY09, 250MW has already been commissioned during the current year in a joint venture with SAIL. Moreover, 1,000MW of capacity was concurrently commercialized. We expect another 1,000MW to be commissioned this year and 2,800MW to be commissioned in FY10. Lower expectations in the commissioning front are due to the project delays for a host of reasons. For instance Barh-I with a generating capacity of 1,980MW has been delayed due to disputes over contract value with two Russian equipment suppliers. The commissioning of new projects across the country by multiple players is creating a shortage of Balance of Plant (BoP) and forged equipment material. This shortage in capacity coupled with poor transport infrastructure causes delays in establishing plants. However, we have factored in these delays, and adjusted them towards our projections. Planned capacity additions 2008-09 2009-10 Kahalgoan II 500 MV Barh 660MV Sipat II 500MV Sipat 660MV Sipat I 1320 MV Korba 500MV Bhilai 500MV Dadri 980MV Koldam 800MV Total FY'09 2820MV Total FY’10 3600M source: NTPC Huge capex planned: NTPC Capex for FY09 is expected to be around Rs.135.58bn, which is 60% more than the Rs.86.21bn in the previous fiscal. We do believe that the company would be able to fund its five-year Capex program (11FYP) from internal accruals, through the redemption of the OTS Bonds and additional debt. We do not expect any further dilution of its equity base. A low gearing ratio of 0.5x in FY08, coupled with CERC guidelines on the normative debt-equity ratio at 70:30; are factors that tilt towards increase in the company's debt levels. NATVERLAL & SONS 4
  • 5. NATSONS RESEARCH NTPC Ltd. Operational efficiency incentives: Operational efficiency has improved in recent years. NTPC's Plant Load Factor (PLF) stood at 92.24 % for coal stations compared to 89.43% in the last fiscal. This resulted in higher revenues in the form of incentive income. This has been achieved by consistently improving its high plant availability and load factors by conducting periodic repairs and maintenance of its plants. PLF for gas stations declined to 68.14% during FY08 compared to 71.9% during FY07. The lower PLF recorded for gas based plants is due to shortage in the availability of gas. PLF 2 00 8 2 007 C o a l St a t io n s 9 2 .2 4 % 8 9 .4 3 % G as S t a t i o n s 6 8 .1 4 % 7 1 .9 0 % A l l In d i a 7 8 .6 1 % 7 6 .8 0 % Source NTPC The regulated incentive for operating at plant loads over 80% is 25 paise / unit of electricity for thermal power plants. In case of NTPC this incentive is fixed at the regulated level of 80% for all its operational power plants, except for Talcher Thermal Power Station (TPS) where the threshold incentive is 75% and for the Tanda TPS, whose threshold incentive is 60%. We expect them, in the future, to continue the incentives, while maintaining their PLF's. Commercial performance: NTPC has PPAs (power purchase agreements) signed for almost all of the power it produces with various SEBs. After the amendment of the Electricity Act, the recovery rate of dues from SEBs improved significantly (100% last year) and Letters of Credit to the extent of 105% of average monthly billing were established by customers. NTPC, through its incentive scheme for encouraging prompt payments rebate is allowed a maximum of 2.25% in case payments are made within a month. All variable costs such as fuel prices are passed on to the customers, following CERC regulation. So, margins will remain intact as input prices rise. NTPC has long term fuel supply agreements (FSA) with a maximum price escalation of 2.5%. As a large part of the power generated is from coal— much of which is sourced from pithead coal stations—production costs remain low. Merchant plants: Merchant power is a concept in which power generated is not sold through medium or long term contracts, but instead sold short term to a buyer willing to pay the highest price. NTPC is setting up 2,120MW as merchant power plants, of which, 1,120MW are hydro-based units, in which operational costs are minimal. This would lead to huge upsides when sold at market rates. We expect 500MW of power to be generated through merchant power plants which will be commissioned in FY10. Overseas forays: NTPC has signed a MOU with the Ministry of Energy, Federal Government of Nigeria (FGN) for gas supplies, whereby FGN will provide a minimum of 3MTPA of LNG to NTPC on a long-term basis at a reasonable price. In return NTPC will establish and operate one 500MW coal-based power plant and a 700MW gas-based power plant in Nigeria independently, or through a joint venture. NATVERLAL & SONS 5
  • 6. NATSONS RESEARCH NTPC Ltd. Strong balance sheet: NTPC has in its books, cash of Rs149.33bn and investments worth Rs152.67bn. The investments include Rs131.24bn bonds issued under a one time settlement scheme; these are generating 8.5% tax-free returns. Its debt-equity (D/E) stands at 0.5x for FY08, this leaves sufficient room for further debt- raising for its planned expansions. We expect that the D/E will rise to 0.6x in FY09 and 0.8x in FY10, based on its expansion plans. Integrated power major: Presently, NTPC is vertically integrating to transform successfully into a fully integrated power major. Backward integration: By way of backward integration, the company is diversifying into captive coal mining trough JVs. This is an attempt to secure future coal supplies. They are working on a coal block, Pakri Barwadih, as a measure to ensure regular supplies. Seven coal blocks were allotted by the government of India with mineable reserves of 3bn MT. The company is planning to extract 12 MTPA by FY12 and 47 MTPA by FY2017. The outlay to develop these mines is Rs.5430 million initially. The company has a 20% stake in Coal Ventures International, an equal partner JV between NTPC, Steel Authority of India Limited (SAIL), Rashtriya Ispat Nigam Limited (RINL), Coal India Limited (CIL) and National Mineral Development Corporation Limited (NMDC). The company's aim is to form a Special Purpose Vehicle (SPV) for securing thermal coal from outside India. In consortium with Canoro Resources and Geo Petro International, NTPC has been allotted an oil exploration block under NELP-V in Arunachal Pradesh. The company will hold the majority 40% share, with 30% each being owned by the other two partners. On the other hand, fuel linkages for NTPC are available for only 11.3 mmscmd as against a demand of 16 mmscmd. The average supply is still short at 4.7 mmscmd. Lateral integration: By way of lateral integration, NTPC's special thrusts in hydropower, nuclear power, and renewable power is targeted at achieving operational and commercial synergies. We believe that substantial hydro capacity and renewable power will help the company register environmental and economic gains in the long run. The company has set up 'NTPC Hydro Limited' to carry out the business of implementing and operating small and medium hydro power projects in the country. It entered into a JV with Asian Development Bank (ADB), GE Energy Financial Services, Japan-based Kysushu Electric Power Co and Brookfield Renewable Power of the US for Renewable power to meet its target of 500 MW of renewable power generation in the next three years. NTPC will hold 40% of the equity and the rest will be shared equally in these ventures. Forward integration: NTPC entered the power trading and power distribution business by a way of a forward integration process through its subsidiaries, NTPC Electric Supply Company Limited and NTPC Vidyut Vyapar Nigam Limited respectively. NATVERLAL & SONS 6
  • 7. NATSONS RESEARCH NTPC Ltd. Valuations: We expect the company to maintain its strong growth story into the future. Revenue, we feel, will grow at a CAGR of 15.1%, while profit will grow at 10% through to FY10E.With large portions of the current expansion plans set to come in FY11 and FY12, we believe the growth will accelerate during the corresponding years ahead. At the current price of Rs170 the stock is trading at a P/E of 17.7x and 15.9x and an EV/EBIDTA of 13.8x and 12.2x FY09E and FY10E. The ROE for FY09E is 14.4% and is expected to improve slightly to 14.7% in FY10E. We feel that at the current price the stock looks very attractive. We believe a P/E of 20x is justifiable with the strong power generation growth expected over the next few years. In addition, NTPC's cash and equivalents of Rs158.0bn and investments of Rs152.6 bn is a cushion for the company that will help fund the massive capital expenditure for the 11th five year plan. This said, we have not yet factored in any upside from its subsidiaries and joint ventures. At 2.2x its FY10 P/BV, we believe NTPC's stock is looking attractive at these levels over the long term. Taking these factors into consideration we are rating the stock a 'BUY' with a price target of Rs218, and an upside potential of 25.7% from the current levels. NATVERLAL & SONS 7
  • 8. NATSONS RESEARCH NTPC Ltd. Key Risks & Concerns: Fuel shortages: In recent times, NTPC has faced constraints on securing continuous fuel supply to its coal and gas based power plants. This will affect the company's PLF and consequently its profitability. The company was, in fact, planning to import up to 8 million tonnes (MT) of coal in FY09. We believe that this is a manageable risk in the medium term, considering the fact that the shortage is only a small part of the company's annual consumption of close to 125MT of coal. All upcoming projects are introducing fuel linkages, however supply side constraints or pricing issues are bound to affect the production. Project execution delays: Due to a long gestation period for power projects, any delay in project execution will lead to lower growth of production volumes and affect profitability. A surge in the procurement of power generation equipment could lead to delays in placing orders for key plant and machinery (boilers, turbines and generators - BTG) which could lead to an inability to implement the projects on time. We expect that a tendered capacity of 3670MW won't come into play in this plan. However, we have factored in an expected number of project delays. Regulatory risks: The power sector, being highly regulated, as per the Central Electricity Regulatory Commission's (CERC) tariff regulations, RoE is fixed at 14% to post tax profits with debt - equity at 70:30 till FY'09. Changes detrimental to the power sector in the new Electricity Act will adversely affect the returns of power companies. However the government's thrust in the sector is required to ensure a regular and increasing power generation capacity to fuel the country's economic growth. Thus, it is unlikely that the government will put a brake to development in this crucial sector. Carbon emissions: Nearly 85% of NTPC's existing capacity and 78% of its FY12E capacity will be coal- based. With increasing concerns on global warming, any regulatory change could adversely impact power companies, including NTPC, denting their earnings. NATVERLAL & SONS 8
  • 9. NATSONS RESEARCH NTPC Ltd. Company Background: NTPC, the largest power company in India, was established in 1975 by the Government of India to accelerate power development in the country. In 1992, the company's transmission division was hived off: this is now known as the Power Grid Corporation of India Ltd (PGCIL) which is the nodal agency for all transmission projects in the country. In 1997, NTPC Ltd was identified as one of the Navratna public sector undertakings thereby according it leeway in its operating and investment activities. It is among the largest and most efficient power generation companies in the world with an installed capacity of 29394 MW (including 2,044MW through joint ventures). NTPC has 15 coal based power stations (23,395 MW), 7 gas based power stations (3,955 MW) and 4 power stations in joint ventures (1,794 MW). NTPC's share in the total installed capacity of the country was 19.1% and it contributed 28.50% of the total power generation of the country during 2007-08. In addition, it provides consultancy services to various organizations in the power business in the areas of power plant constructions and power generation to companies in India and overseas. Its six subsidiaries are: NTPC Electric Supply Company Ltd. (100%), NTPC Vidyut Vyapar Nigam Ltd.(100%), NTPC Hydro Ltd.(100%), Kanti Bijlee Utpadan Nigam Ltd.(51%), Bhartiya Rail Bijlee Company Ltd.(74%), Pipavav Power Development Co Ltd(100%). The last is currently winding up. Its eleven joint ventures are: PTC India Ltd. (5.28%), Utility Powertech Ltd. (50%), –NTPC SAIL Power Co. (Pvt.) Ltd. (50%), NTPC Alstom Power Services Pvt. Ltd.(50%), NTPC Tamilnadu Energy Co. Ltd. (50%), Ratnagiri Gas & Power Pvt. Ltd. (28.33%), Aravali Power Company Pvt. Ltd. (50%), NTPC-SCCL Global Ventures Private Ltd.(50%), Meja Urja Nigam Pvt. Ltd.(50%), NTPC-BHEL Power Projects Pvt. Ltd.(50%), BF-NTPC Energy Systems Ltd. (49%). Share Holding pattern: Corporate DII, 2.55 retail, 2.61 bodies, 1.21 FII, 4.13 Govt, 89.50 NATVERLAL & SONS 9
  • 10. NATSONS RESEARCH NTPC Ltd. Financials Profit & Loss Balance Sheet In Rs million FY07 FY08 FY09E FY010E In Rs million FY07 FY08 FY09E FY10E Net sales 326,358 370,974 416,255 492,302 Equity capital 82,455 82,455 82,455 82,455 YoY (%) 24.8 13.7 12.2 18.3 Reserves 403,513 443,931 486,083 532,371 Total expenses 225,494 255,517 284,854 335,361 Deferred Revenue 6,567 13,734 17,438 20,825 EBIDTA 100,864 115,457 131,401 156,941 Net worth 492,535 540,120 585,976 635,651 YoY (%) 34.9 14.5 13.8 19.4 Total borrowings 244,844 271,906 362,906 510,906 EBIDTA (%) 30.9 31.1 31.6 31.9 Ex-chg fluctuation 0 2,554 0 0 Total liabilities 737,380 814,581 948,883 1,146,558 Other income 27,449 29,203 27,300 25,350 PBIDT 128,313 144,660 158,701 182,291 Net block 256,481 260,937 316,765 429,468 Depreciation 20,754 21,385 22,922 27,297 CWIP 128,567 184,389 243,089 310,089 PBIT 107,559 123,275 135,779 154,994 Construction stores 39,825 40,394 40,394 50,394 Interest 18,594 17,981 23,805 30,583 Investme nts 160,943 152,672 140,000 130,000 Prior Period exp (109) 2,745 0 0 Current assets 221,827 255,488 297,039 330,686 PBT 89,074 102,549 111,974 124,410 Inventories 25,102 26,757 30,024 35,512 (-) Tax 20,434 28,486 31,318 34,795 Debtors 12,523 29,827 33,469 39,587 Current Tax 20,280 28,317 31,129 34,586 Cash 133,146 149,332 182,974 204,015 Deferred Tax 0 0 0 0 Oth curr assets 10,580 9,218 9,718 10,218 Fringe benefit tax 154 169 189 209 Loans and advance 40,476 40,354 40,854 41,354 Tax/ PBT 23 28 28 28 PAT 68,640 74,063 80,656 89,615 Current liabilities 54,221 55,483 61,853 72,820 Extra-ordinary exp (7) (85) (85) (85) Provisions 16,042 23,816 26,550 31,258 Net Profit 68,647 74,148 80,741 89,700 Net current assets 151,564 176,189 208,635 226,607 Cash Flow Key Ratios In Rs million FY07 FY08 FY09E FY10E FY07 FY08 FY09E FY010E Net profit 68,647 74,148 80,741 89,700 EPS (Rs) 8.3 9.0 9.8 10.9 Depn and w/o 20,754 21,385 22,922 27,297 CEPS (Rs) 10.8 11.6 12.6 14.2 Misc expenditure 0 2,554 (2,554) 0 Book value (Rs) 58.9 63.8 69.0 74.6 Change in wrkg cap (7,289) (8,439) 1,195 3,069 DPS (Rs) 3.2 3.5 4.0 4.5 Other income (27,449) (29,203) (27,300) (25,350) Debt-equity (x) 0.5 0.5 0.6 0.8 Deferre d Revenue 2,159 7,167 3,704 3,387 ROCE 15.6 16.1 15.7 15.1 Operating cash flow 56,822 67,612 78,709 98,104 ROE 14.7 14.6 14.7 15.2 Other income 27,449 29,203 27,300 25,350 Capex (78,929) (82,798) (137,450) (217,000) Va luations Investments 31,948 8,271 12,672 10,000 PE (x) 20.8 19.3 17.7 15.9 Investing cash flow (19,532) (45,324) (97,478) (181,650) Cash PE (x) 16.0 15.0 13.8 12.2 Dividend (30,281) (33,764) (38,589) (43,413) Price/book value (x) 2.9 2.7 2.5 2.3 Equity 0 0 0 0 Dividend yield 1.8 2.0 2.3 2.6 Debt 42,871 27,062 91,000 148,000 Market cap/sales 4.4 3.9 3.4 2.9 Financing cas h flow 12,590 (6,702) 52,411 104,587 EV/sales (x) 5.1 4.6 4.3 3.9 Net change in cash 49,880 15,586 33,642 21,041 EV/EBDITA (x) 16.6 14.7 13.6 12.4 Disclaimer The information provided in the document is from publicly available data and other sources, which we believe are reliable. It also includes analysis and views expressed by our research team. The report is purely for information purposes and does not construe to be investment recommendation/advice. Investors should not solely rely on the information contained in this document and must make investment decisions based on their own investment objectives, risk profile and financial position. Efforts are made to try and ensure accuracy of data however, Natverlal & Sons Stockbrokers Pvt Ltd. And / or any of its affiliates and / or employees shall not be liable for loss or damage that may arise from any error in this document. Natverlal & Sons Stockbrokers Pvt Ltd and / or any of its affiliates and / or employees may or may not hold positions in any of the securities mentioned in the document. This document is not for public distribution and should not be reproduced or redistributed without prior permission. NATVERLAL & SONS 10