SlideShare ist ein Scribd-Unternehmen logo
1 von 18
Downloaden Sie, um offline zu lesen
South Dakota's International and Domestic Ports-to-Plains Region Trading Relationships


                                                                                       2010-2011    2010-2011     2004-2011 2004-2011
                                                   2004           2010        2011     Difference   % Change      Difference % Change
Mexico
Truck       Exports                         $102,998,469 $169,502,550 $140,351,334   -$29,151,216     -17.2%     $37,352,865    36.3%
            Imports                          $98,030,101 $40,889,356 $47,401,644       $6,512,288      15.9%    -$50,628,457   -51.6%
            Total Truck Trade with Mexico   $201,028,570 $210,391,906 $187,752,978   -$22,638,928     -10.8%    -$13,275,592    -6.6%
                                                                                                    #DIV/0!
Rail        Exports                          $28,009,810 $169,188,865 $249,431,423   $80,242,558       47.4%    $221,421,613   790.5%
            Imports                           $2,255,695   $3,547,870   $7,827,268    $4,279,398      120.6%      $5,571,573   247.0%
            Total Rail Trade with Mexico     $30,265,505 $172,736,735 $257,258,691   $84,521,956       48.9%    $226,993,186   750.0%
                                                                                                    #DIV/0!
TOTAL       Exports                         $131,008,279 $338,691,415 $389,782,757   $51,091,342       15.1%    $258,774,478   197.5%
            Imports                         $105,254,164 $44,437,226 $55,228,912     $10,791,686       24.3%    -$45,056,884   -47.5%
            Total Trade with Mexico         $231,294,075 $383,128,641 $445,011,669   $61,883,028       16.2%    $213,717,594    92.4%


                                                     South Dakota -- Page 1
South Dakota's International and Domestic Ports-to-Plains Region Trading Relationships

Laredo, TX

Truck        Exports                               $91,369,338 $125,435,030 $86,126,518            -$39,308,512    -31.3%   -$5,242,820    -5.7%
                       % of Total Exports to Mexico      88.7%        74.0%        61.4%                           -12.6%                 -27.3%
             Imports                                $6,597,587 $31,798,261 $36,786,486              $4,988,225      15.7%   $30,188,899   457.6%
                      % of Total Imports to Mexico        6.4%        77.8%        77.6%                            -0.2%                  71.2%
             Total Truck Trade Thru Laredo          $97,966,925 $157,233,291 $122,913,004          -$34,320,287    -21.8%   $24,946,079    25.5%
                        % Total Trade with Mexico        48.7%        74.7%        65.5%                            -9.3%                  16.7%

Rail         Exports                               $26,592,628    $69,278,087        $88,778,013   $19,499,926      28.1%   $62,185,385   233.8%
                       % of Total Exports to Mexico      94.9%         40.9%              35.6%                     -5.4%                 -59.3%
             Imports                                  $916,918        $43,341           $762,081      $718,740    1658.3%     -$154,837   -16.9%
                      % of Total Imports to Mexico       40.6%          1.2%               9.7%                      8.5%                 -30.9%
             Total Rail Trade Thru Laredo           $27,509,546   $69,321,428        $89,540,094   $20,218,666      29.2%   $62,030,548   225.5%
                         % Total Trade with Mexico       90.9%         40.1%              34.8%                     -5.3%                 -56.1%

TOTAL
             Exports                               $117,961,966 $194,713,117 $174,904,531          -$19,808,586    -10.2%   $56,942,565    48.3%
                       % of Total Exports to Mexico      90.0%        57.5%        44.9%                           -12.6%                 -45.2%
             Imports                                 $7,514,505 $31,841,602 $37,548,567             $5,706,965      17.9%   $30,034,062   399.7%
                      % of Total Imports to Mexico        7.1%        71.7%        68.0%                            -3.7%                  60.8%
             Total Trade Thru Laredo               $125,476,471 $226,554,719 $212,453,098          -$14,101,621     -6.2%   $86,976,627    69.3%
                        % Total Trade with Mexico        54.2%        59.1%        47.7%                           -11.4%                  -6.5%


                                                            South Dakota -- Page 2
South Dakota's International and Domestic Ports-to-Plains Region Trading Relationships

Eagle Pass, TX

Truck            Exports                                   $37,320      $372,307          $4,099,823    $3,727,516    1001.2%    $4,062,503   10885.6%
                           % of Total Exports to Mexico       0.0%         0.2%                2.9%                      2.7%                     2.9%
                 Imports                                         $0           $0                  $0           $0    #DIV/0!            $0    #DIV/0!
                          % of Total Imports to Mexico        0.0%         0.0%                0.0%                      0.0%                     0.0%
                 Total Truck Trade Thru Eagle Pass        8,687,358     $372,307          $4,099,823    $3,727,516    1001.2%    $4,062,503     -52.8%
                            % Total Trade with Mexico         4.3%         0.2%                2.2%                      2.0%                    -2.1%

Rail             Exports                                  $548,682    $43,276,107        $78,982,295   $35,706,188     82.5%    $78,433,613   14294.9%
                           % of Total Exports to Mexico       2.0%         25.6%              31.7%                     6.1%                     29.7%
                 Imports                                         $0    $3,504,529         $7,065,187    $3,560,658    101.6%     $7,065,187   #DIV/0!
                          % of Total Imports to Mexico        0.0%         98.8%              90.3%                    -8.5%                     90.3%
                 Total Rail Trade Thru Eagle Pass          $548,682   $46,780,636        $86,047,482   $39,266,846     83.9%    $85,498,800   15582.6%
                             % Total Trade with Mexico        1.8%         27.1%              33.4%                     6.4%                     31.6%

TOTAL
                 Exports                                  $586,002    $43,648,414        $83,082,118   $39,433,704     90.3%    $82,496,116   14077.8%
                           % of Total Exports to Mexico      0.4%          12.9%              21.3%                     8.4%                     20.9%
                 Imports                                        $0     $3,504,529         $7,065,187    $3,560,658    210.7%     $7,065,187   #DIV/0!
                      % of Total Imports to Eagle Pass       0.0%           7.9%              12.8%                     4.9%                     12.8%
                 Total Trade Thru Laredo                  $586,002    $47,152,943        $90,147,305   $42,994,362     91.2%    $89,561,303   15283.4%
                            % Total Trade with Mexico        0.3%          12.3%              20.3%                     7.9%                     20.0%


                                                                South Dakota -- Page 3
South Dakota's International and Domestic Ports-to-Plains Region Trading Relationships

Del Rio, TX

Truck         Exports                                     $0             $0               $0   $0   #DIV/0!    $0   #DIV/0!
                        % of Total Exports to Mexico   0.0%           0.0%             0.0%             0.0%            0.0%
              Imports                                     $0             $0               $0   $0   #DIV/0!    $0   #DIV/0!
                       % of Total Imports to Mexico    0.0%           0.0%             0.0%             0.0%            0.0%
              Total Truck Trade Thru Del Rio              $0             $0               $0   $0   #DIV/0!    $0   #DIV/0!
                         % Total Trade with Mexico     0.0%           0.0%             0.0%             0.0%            0.0%

Rail          Exports                                     $0                                                        #DIV/0!
                        % of Total Exports to Mexico   0.0%     #DIV/0!           #DIV/0!                           #DIV/0!
              Imports                                     $0                                                        #DIV/0!
                       % of Total Imports to Mexico    0.0%     #DIV/0!           #DIV/0!                           #DIV/0!
              Total Rail Trade Thru Del Rio               $0                                                        #DIV/0!
                          % Total Trade with Mexico    0.0%           0.0%             0.0%                             0.0%

TOTAL
              Exports                                     $0             $0               $0   $0   #DIV/0!    $0   #DIV/0!
                        % of Total Exports to Mexico   0.0%           0.0%             0.0%             0.0%            0.0%
              Imports                                     $0             $0               $0   $0   #DIV/0!    $0   #DIV/0!
                       % of Total Imports to Mexico    0.0%           0.0%             0.0%             0.0%            0.0%
              Total Trade Thru Del Rio                    $0             $0               $0   $0   #DIV/0!    $0   #DIV/0!
                         % Total Trade with Mexico     0.0%           0.0%             0.0%             0.0%            0.0%


                                                         South Dakota -- Page 4
South Dakota's International and Domestic Ports-to-Plains Region Trading Relationships

PTP
                                                               0
Truck       Exports                                  $91,406,658 $125,807,337 $90,226,341    -$35,580,996   -28.3%   -$1,180,317    -1.3%
                      % of Total Exports to Mexico        88.7%        74.2%        64.3%                    -9.9%                 -24.5%
            Imports                                   $6,597,587 $31,798,261 $36,786,486      $4,988,225     15.7%   $30,188,899   457.6%
                     % of Total Imports to Mexico          6.4%        77.8%        77.6%                    -0.2%                  71.2%
            Total Truck Trade Thru PTP               $98,004,245 $157,605,598 $127,012,827   -$30,592,771   -19.4%   $29,008,582    29.6%
                       % Total Trade with Mexico          48.8%        74.9%        67.6%                    -7.3%                  18.9%

Rail        Exports                                  $27,141,310 $112,554,194 $167,760,308   $55,206,114     49.0% $140,618,998    518.1%
                      % of Total Exports to Mexico        96.9%        66.5%        67.3%                     0.7%                 -29.6%
            Imports                                    $916,918    $3,547,870   $7,827,268    $4,279,398    120.6%   $6,910,350    753.6%
                     % of Total Imports to Mexico          0.0%       100.0%       100.0%                     0.0%                 100.0%
            Total Rail Trade Thru PTP                $28,058,228 $116,102,064 $175,587,576   $59,485,512     51.2% $147,529,348    525.8%
                        % Total Trade with Mexico         92.7%        67.2%        68.3%                     1.0%                 -24.5%

TOTAL
            Exports                               $118,547,968 $238,361,531 $257,986,649     $19,625,118      8.2% $139,438,681    117.6%
                      % of Total Exports to Mexico      90.5%        70.4%        66.2%                      -4.2%                 -24.3%
            Imports                                 $7,514,505 $35,346,131 $44,613,754        $9,267,623     26.2% $37,099,249     493.7%
                     % of Total Imports to Mexico        7.1%        79.5%        80.8%                       1.2%                  73.6%
            Total Trade Thru PTP                  $126,062,473 $273,707,662 $302,600,403     $28,892,741     10.6% $176,537,930    140.0%
                       % Total Trade with Mexico        54.5%        71.4%        68.0%                      -3.4%                  13.5%


                                                             South Dakota -- Page 5
South Dakota's International and Domestic Ports-to-Plains Region Trading Relationships


2011        Leading Exports from South Dakota to Mexico (Surface Transportation)               2011
Rank                                                                                         Export
   1   23   Food Residues and Waste                                                    $165,589,583
   2   2    Meat and Edible Offal                                                       $96,950,036
   3   15   Animal or Vegetable Fats and Oils                                           $86,067,319
   4   76   Aluminum and Articles                                                        $9,747,188
   5   41   Raw Hides and Skins                                                          $8,713,157
   6   84   Computer-Related Machinery and Parts                                         $6,219,366
   7   85   Electrical Machinery; Equipment and Parts                                    $4,157,347
   8   5    Products of Animal Origin                                                    $3,162,869
   9   48   Paper and Paperboard                                                         $2,831,993
  10   95   Toys; Games and Sport Equipment                                              $1,246,475


2011        Leading Imports to South Dakota from Mexico (Surface Transportation)               2011
                                                                                             Import
   1   87   Vehicles Other than Railway                                                 $23,669,893
   2   84   Computer-Related Machinery and Parts                                        $15,791,521
   3   48   Paper and Paperboard                                                         $9,382,483
   4   85   Electrical Machinery; Equipment and Parts                                    $1,845,429
   5   98   Special Classification Provisions                                            $1,148,535
   6   70   Glass                                                                        $1,124,856
   7   73   Articles of Iron and Steel                                                    $941,134
   8   94   Furniture; Lamps and Prefabricated Buildings                                  $537,325
   9   40   Rubber and Articles                                                           $246,113
  10   5    Products of Animal Origin                                                     $232,815


                                                              South Dakota -- Page 6
South Dakota's International and Domestic Ports-to-Plains Region Trading Relationships


 2011        Leading Exports from South Dakota to Mexico (Surface Transportation)                                      2011
Rank         Coahuila                                                                                                Export
1       84   Computer-Related Machinery and Parts                                                                  $424,403
2       11   Malts; Starches and Inulin                                                                            $247,842
3       85   Electrical Machinery; Equipment and Parts                                                             $111,134
4       95   Toys; Games and Sport Equipment                                                                        $57,719
5       72   Iron and Steel                                                                                         $17,550
6       73   Articles of Iron and Steel                                                                             $10,200
7
8
9
10

 2011        Leading Exports from South Dakota to Mexico (Surface Transportation)                                       2011
Rank         Nuevo Leon                                                                                               Export
1        2   Meat and edible meat offal                                                                          $41,363,283
2       48   Paper and paperboard; Articles of paper pulp; of paper or of paperboard                              $2,281,883
3       85   Electrical machinery and equipment and parts thereof; Sound recorders and reproducers                $1,360,345
4       23   Residues and waste from the food industries; Prepared animal feed                                    $1,197,901
5        5   Products of animal origin; not elsewhere specified or included                                       $1,011,741
6       84   Nuclear reactors; boilers; machinery and mechanical appliances; parts thereof                         $822,771
7       39   Plastics and articles thereof                                                                         $547,148
8       15   Animal or vegetable fats and oils and their cleavage products; Prepared edible fats; Animal waxes     $135,055
9       68   Articles of stone; plaster; cement; asbestos; mica or similar materials                               $133,799
10      16   Preparations of meat; of fish; or of crustaceans; mollusks or other aquatic invertebrates               $92,025


                                                                South Dakota -- Page 7
South Dakota's International and Domestic Ports-to-Plains Region Trading Relationships

 2011    Leading Exports from South Dakota to Mexico (Surface Transportation)                          2011
Rank     Tamaulipas                                                                                   Export
1      2 Meat and edible meat offal                                                                 $920,095
2      5 Products of animal origin; not elsewhere specified or included                             $521,103
3     23 Residues and waste from the food industries; Prepared animal feed                          $422,140
4     84 Nuclear reactors; boilers; machinery and mechanical appliances; parts thereof              $110,910
5      1 Live animals                                                                                $20,000
6     87 Vehicles; other than railway or tramway rolling stock; and parts and accessories thereof    $10,000
7
8
9
10


                                                             South Dakota -- Page 8
South Dakota's International and Domestic Ports-to-Plains Region Trading Relationships


                                                                                         2010-2011 2010-2011      2004-2011 2004-2011
                                                       2004            2010      2011    Difference % Change      Difference % Change
Canada
Truck        Exports                         $223,756,926.00 $365,384,613 $462,704,621  $97,320,008     26.6%   $238,947,695   106.8%
             Imports                         $285,791,567.00 $257,678,166 $301,835,945  $44,157,779     17.1%    $16,044,378     5.6%
             Total Truck Trade with Canada   $509,548,493.00 $623,062,779 $764,540,566 $141,477,787     22.7%   $254,992,073    50.0%
                                                                                                      #DIV/0!
Rail         Exports                          $14,565,826.00 $35,363,107 $42,900,489     $7,537,382     21.3%    $28,334,663   194.5%
             Imports                          $91,626,462.00 $87,758,398 $108,975,131   $21,216,733     24.2%    $17,348,669    18.9%
             Total Rail Trade with Canada    $106,192,288.00 $123,121,505 $151,875,620  $28,754,115     23.4%    $45,683,332    43.0%
                                                                                                 $0   #DIV/0!
TOTAL        Exports                         $238,322,752.00 $400,747,720 $505,605,110 $104,857,390     26.2%   $267,282,358   112.2%
             Imports                         $377,418,029.00 $345,436,564 $410,811,076  $65,374,512     18.9%    $33,393,047     8.8%
             Total Trade with Canada         $615,740,781.00 $746,184,284 $916,416,186 $170,231,902     22.8%   $300,675,405    48.8%


                                                     South Dakota -- Page 9
South Dakota's International and Domestic Ports-to-Plains Region Trading Relationships

Raymond, MT

Truck         Exports                                    $917,406     $2,945,323      $5,863,865   $2,918,542    99.1%    $4,946,459   539.2%
                        % of Total Exports to Canada         0.4%          0.8%            1.3%                   0.5%                   0.9%
              Imports                                  $2,364,561     $2,428,305      $8,639,952   $6,211,647   255.8%    $6,275,391   265.4%
                       % of Total Imports to Canada          0.8%          0.9%            2.9%                   1.9%                   2.0%
              Total Truck Trade Thru Raymond            $3,281,967    $5,373,628     $14,503,817   $9,130,189   169.9%   $11,221,850   341.9%
                         % Total Trade with Canada           0.6%          0.9%            1.9%                   1.0%                   1.3%

Rail          Exports                                          $0
                        % of Total Exports to Canada         0.0%            0.0%
              Imports                                          $0
                       % of Total Imports to Canada          0.0%            0.0%
              Total Truck Trade Thru Raymond                    $0              $0
                         % Total Trade with Canada           0.0%            0.0%

TOTAL
              Exports                                    $917,406     $2,945,323      $5,863,865   $2,918,542    99.1%    $4,946,459   539.2%
                        % of Total Exports to Canada        0.4%           0.7%            1.2%                   0.4%                   0.8%
              Imports                                  $2,364,561     $2,428,305      $8,639,952   $6,211,647   255.8%    $6,275,391   265.4%
                       % of Total Imports to Canada         0.6%           0.7%            2.1%                   1.4%                   1.5%
              Total Trade Thru Raymond                 $3,281,967     $5,373,628     $14,503,817   $9,130,189   169.9%   $11,221,850   341.9%
                         % Total Trade with Canada          0.5%           0.7%            1.6%                   0.9%                   1.0%


                                                           South Dakota -- Page 10
South Dakota's International and Domestic Ports-to-Plains Region Trading Relationships

Sweet Grass, MT

Truck             Exports                                  $26,178,994    $10,002,061     $19,644,045    $9,641,984      96.4%   -$6,534,949    -25.0%
                            % of Total Exports to Canada         11.7%          2.7%            4.2%                      1.5%                   -7.5%
                  Imports                                   $17,294,411   $23,570,227     $18,334,791    -$5,235,436    -22.2%   $1,040,380       6.0%
                           % of Total Exports to Canada           6.1%          9.1%            6.1%                     -3.1%                    0.0%
                  Total Truck Trade Thru Sweetgrass          43,473,405   $33,572,288     $37,978,836    $4,406,548      13.1%   -$5,494,569    -12.6%
                             % Total Trade with Canada            8.5%          5.4%            5.0%                     -0.4%                   -3.6%

Rail              Exports                                    $105,216         $20,745              $0      -$20,745    -100.0%    -$105,216    -100.0%
                            % of Total Exports to Canada         0.7%           0.1%            0.0%                     -0.1%                   -0.7%
                  Imports                                   $8,934,857     $9,469,980      $2,507,063    -$6,962,917    -73.5%   -$6,427,794    -71.9%
                           % of Total Exports to Canada          9.8%          10.8%            2.3%                     -8.5%                   -7.5%
                  Total Rail Trade Thru Sweet Grass         $9,040,073     $9,490,725      $2,507,063    -$6,983,662    -73.6%   -$6,533,010    -72.3%
                              % Total Trade with Canada          8.5%           7.7%            1.7%                     -6.1%                   -6.9%

TOTAL
                  Exports                                  $26,284,210    $10,022,806     $19,644,045    $9,621,239      96.0% -$6,640,165      -25.3%
                            % of Total Exports to Canada        11.0%           2.5%            3.9%                      1.4%                   -7.1%
                  Imports                                  $26,229,268    $33,040,207     $20,841,854   -$12,198,353    -36.9% -$5,387,414      -20.5%
                           % of Total Imports to Canada          6.9%           9.6%            5.1%                     -4.5%                   -1.9%
                  Total Trade Thru Sweet Grass             $52,513,478    $43,063,013     $40,485,899    -$2,577,114     -6.0% -$12,027,579     -22.9%
                             % Total Trade with Canada           8.5%           5.8%            4.4%                     -1.4%                   -4.1%


                                                                South Dakota -- Page 11
South Dakota's International and Domestic Ports-to-Plains Region Trading Relationships

Portal, ND

Truck        Exports                                  $17,603,171   $50,923,036 $61,178,797       $10,255,761    20.1%    $43,575,626   247.5%
                       % of Total Exports to Canada         7.9%         13.9%        13.2%                      -0.7%                    5.4%
             Imports                                  $28,285,335   $48,687,792 $50,686,060        $1,998,268     4.1%    $22,400,725    79.2%
                      % of Total Imports to Canada         12.6%         18.9%        16.8%                      -2.1%                    4.2%
             Total Truck Trade Thru Portal            $45,888,506   $99,610,828 $111,864,857      $12,254,029    12.3%    $65,976,351   143.8%
                        % Total Trade with Canada           9.0%         16.0%        14.6%                      -1.4%                    5.6%

Rail         Exports                                   $8,039,014   $23,297,650     $32,024,869    $8,727,219     37.5%   $23,985,855   298.4%
                       % of Total Exports to Canada        55.2%         65.9%           74.6%                     8.8%                  19.5%
             Imports                                   $8,136,062   $21,163,730     $11,391,285    -$9,772,445   -46.2%    $3,255,223    40.0%
                       % of Total Imports to Canada         8.9%         24.1%           10.5%                   -13.7%                   1.6%
             Total Rail Trade Thru Portal             $16,175,076   $44,461,380     $43,416,154    -$1,045,226    -2.4%   $27,241,078   168.4%
                         % Total Trade with Canada         15.2%         36.1%           28.6%                    -7.5%                  13.4%

TOTAL
             Exports                                  $25,642,185 $74,220,686 $61,178,797         -$13,041,889   -17.6%   $67,561,481   138.6%
                       % of Total Exports to Canada        10.8%        18.5%        12.1%                        -6.4%                   1.3%
             Imports                                  $36,421,397 $69,851,522 $62,077,345          -$7,774,177   -11.1%   $25,655,948    70.4%
                      % of Total Imports to Canada          9.7%        20.2%        15.1%                        -5.1%                   5.5%
             Total Trade Thru Portal                  $62,063,582 $144,072,208 $123,256,142       -$20,816,066   -14.4%   $93,217,429    98.6%
                        % Total Trade with Canada          10.1%        19.3%        13.4%                        -5.9%                   3.4%


                                                          South Dakota -- Page 12
South Dakota's International and Domestic Ports-to-Plains Region Trading Relationships

Wild Horse
                                                            0
Truck        Exports                                       $0             $0          $0        $0    #DIV/0!         $0    #DIV/0!
                       % of Total Exports to Canada     0.0%           0.0%        0.0%                   0.0%                  0.0%
             Imports                                       $0       $246,317    $163,389   -$82,928     -33.7%   $163,389   #DIV/0!
                      % of Total Imports to Canada      0.0%           0.1%        0.1%                   0.0%                  0.1%
             Total Truck Trade Thru Wild Horse             $0       $246,317    $163,389   -$82,928     -33.7%   $163,389   #DIV/0!
                        % Total Trade with Canada       0.0%           0.0%        0.0%                   0.0%                  0.0%

Rail         Exports                                       $0              $0         $0        $0    #DIV/0!         $0    #DIV/0!
                       % of Total Exports to Canada     0.0%            0.0%       0.0%                   0.0%                  0.0%
             Imports                                       $0              $0         $0        $0    #DIV/0!         $0    #DIV/0!
                       % of Total Imports to Canada     0.0%            0.0%       0.0%                   0.0%                  0.0%
             Total Rail Trade Thru Wild Horse              $0              $0         $0        $0    #DIV/0!         $0    #DIV/0!
                         % Total Trade with Canada      0.0%            0.0%       0.0%                   0.0%                  0.0%

TOTAL
             Exports                                       $0             $0          $0        $0    #DIV/0!         $0    #DIV/0!
                       % of Total Exports to Canada     0.0%           0.0%        0.0%                   0.0%                  0.0%
             Imports                                       $0       $246,317    $163,389   -$82,928     -33.7%   $163,389   #DIV/0!
                      % of Total Imports to Canada      0.0%           0.1%        0.0%                   0.0%                  0.0%
             Total Trade Thru Wild Horse                   $0       $246,317    $163,389   -$82,928     -33.7%   $163,389   #DIV/0!
                        % Total Trade with Canada       0.0%           0.0%        0.0%                   0.0%                  0.0%


                                                      South Dakota -- Page 13
South Dakota's International and Domestic Ports-to-Plains Region Trading Relationships

PTP
                                                       #DIV/0!
Truck        Exports                                   $44,699,571 $63,870,420 $86,686,707         $22,816,287    35.7%    $41,987,136   93.9%
                       % of Total Exports to Canada         20.0%        17.5%        18.7%                        1.3%                  -1.2%
             Imports                                   $46,497,152 $75,449,659 $75,048,105           -$401,554    -0.5%    $28,550,953   61.4%
                      % of Total Imports to Canada          16.3%        29.3%        24.9%                       -4.4%                   8.6%
             Total Truck Trade Thru PTP                $91,196,723 $139,320,079 $161,734,812       $22,414,733    16.1%    $70,538,089   77.3%
                        % Total Trade with Canada           17.9%        22.4%        21.2%                       -1.2%                   3.3%

Rail         Exports                                    $8,144,230   $23,318,395     $32,024,869    $8,706,474     37.3%   $23,880,639   293.2%
                       % of Total Exports to Canada          3.6%          6.4%            6.9%                     0.5%                   3.3%
             Imports                                   $17,070,919   $30,633,710     $13,898,348   -$16,735,362   -54.6%   -$3,172,571   -18.6%
                       % of Total Imports to Canada          6.0%         11.9%            4.6%                    -7.3%                  -1.4%
             Total Rail Trade Thru PTP                 $25,215,149   $53,952,105     $45,923,217    -$8,028,888   -14.9%   $20,708,068    82.1%
                         % Total Trade with Canada           4.9%          8.7%            6.0%                    -2.7%                   1.1%

TOTAL
             Exports                                   $52,843,801 $87,188,815 $118,711,576        $31,522,761     36.2%   $65,867,775   124.6%
                       % of Total Exports to Canada         22.2%        21.8%        23.5%                         1.7%                   1.3%
             Imports                                   $63,568,071 $106,083,369 $88,946,453        -$17,136,916   -16.2%   $25,378,382    39.9%
                      % of Total Imports to Canada          16.8%        30.7%        21.7%                        -9.1%                   4.8%
             Total Trade Thru PTP                     $116,411,872 $193,272,184 $207,658,029       $14,385,845      7.4%   $91,246,157    78.4%
                        % Total Trade with Canada           18.9%        25.9%        22.7%                        -3.2%                   3.8%


                                                           South Dakota -- Page 14
South Dakota's International and Domestic Ports-to-Plains Region Trading Relationships


 2011        Leading Exports from South Dakota to Canada (Surface Transportation)                                        2011
Rank                                                                                                                    Export
1       84   Nuclear reactors; boilers; machinery and mechanical appliances; parts thereof                        $114,352,938
2       23   Residues and waste from the food industries; Prepared animal feed                                     $87,377,799
3       2    Meat and edible meat offal                                                                            $84,467,353
4       87   Vehicles; other than railway or tramway rolling stock; and parts and accessories thereof              $80,651,675
5       39   Plastics and articles thereof                                                                         $24,629,725
6       85   Electrical machinery and equipment and parts thereof; Sound recorders and reproducers                 $14,587,377
7       73   Articles of iron or steel                                                                             $12,306,768
8       94   Furniture; Bedding; mattress supports; cushions and similar stuffed furnishings; Lighting fittings    $10,056,922
9       76   Aluminum and articles thereof                                                                          $9,154,097
10      12   Oil seeds and oleaginous fruits; Miscellaneous grains; Seeds and fruit; Industrial plants              $8,737,109

 2011        Leading Imports to South Dakota from Canada (Surface Transportation)                                         2011
Rank                                                                                                                    Import
1       31   Fertilizers                                                                                          $111,662,884
2       84   Nuclear reactors; boilers; machinery and mechanical appliances; parts thereof                         $73,752,843
3       39   Plastics and articles thereof                                                                         $48,755,734
4       87   Vehicles; other than railway or tramway rolling stock; and parts and accessories thereof              $31,659,662
5       98   Special classification provisions                                                                     $26,150,127
6       44   Wood and articles of wood; Wood charcoal                                                              $22,248,176
7       1    Live animals                                                                                          $14,311,635
8       48   Paper and paperboard; Articles of paper pulp; of paper or of paperboard                               $13,819,266
9       73   Articles of iron or steel                                                                             $11,725,958
10      85   Electrical machinery and equipment and parts thereof; Sound recorders and reproducers                  $7,489,269


                                                                South Dakota -- Page 15
South Dakota's International and Domestic Ports-to-Plains Region Trading Relationships


 2011        Leading Exports from South Dakota to Canada (Surface Transportation)                                        2011
Rank         Alberta                                                                                                    Export
1       23   Residues and waste from the food industries; Prepared animal feed                                     $12,918,239
2       84   Nuclear reactors; boilers; machinery and mechanical appliances; parts thereof                          $6,067,046
3       87   Vehicles; other than railway or tramway rolling stock; and parts and accessories thereof               $3,280,496
4       85   Electrical machinery and equipment and parts thereof; Sound recorders and reproducers                  $2,804,038
5        2   Meat and edible meat offal                                                                             $1,486,626
6       39   Plastics and articles thereof                                                                           $646,387
7       12   Oil seeds and oleaginous fruits; Miscellaneous grains; Seeds and fruit; Industrial plants                $512,360
8        5   Products of animal origin; not elsewhere specified or included                                           $504,821
9       34   Soap; organic surface-active agents; washing preparations; lubricating preparations; prepared waxes     $449,666
10      76   Aluminum and articles thereof                                                                           $432,550

 2011        Leading Exports from South Dakota to Canada (Surface Transportation)                                         2011
Rank         British Colombia                                                                                           Export
1        2   Meat and edible meat offal                                                                            $16,684,641
2       23   Residues and waste from the food industries; Prepared animal feed                                     $14,071,972
3       84   Nuclear reactors; boilers; machinery and mechanical appliances; parts thereof                         $10,472,349
4       39   Plastics and articles thereof                                                                          $2,877,234
5       87   Vehicles; other than railway or tramway rolling stock; and parts and accessories thereof               $1,601,410
6        4   Dairy produce; Birds' eggs; Natural honey; Edible products of animal origin; not elsewhere included      $998,077
7       85   Electrical machinery and equipment and parts thereof; Sound recorders and reproducers                    $742,231
8       48   Paper and paperboard; Articles of paper pulp; of paper or of paperboard                                  $696,081
9       76   Aluminum and articles thereof                                                                           $259,154
10      15   Animal or vegetable fats and oils and their cleavage products; Prepared edible fats; Animal waxes        $233,296


                                                                South Dakota -- Page 16
South Dakota's International and Domestic Ports-to-Plains Region Trading Relationships

 2011        Leading Exports from South Dakota to Canada (Surface Transportation)                                       2011
Rank         Saskatchewan                                                                                              Export
1       84   Nuclear reactors; boilers; machinery and mechanical appliances; parts thereof                        $23,405,719
2       87   Vehicles; other than railway or tramway rolling stock; and parts and accessories thereof             $17,034,716
3       72   Iron and steel                                                                                        $8,081,171
4       23   Residues and waste from the food industries; Prepared animal feed                                     $5,083,850
5       73   Articles of iron or steel                                                                             $4,950,174
6       94   Furniture; Bedding; mattress supports; cushions and similar stuffed furnishings; Lighting fittings    $3,987,386
7       90   Optical; photographic; cinematographic; measuring; checking; precision; medical instruments           $3,506,234
8       39   Plastics and articles thereof                                                                         $2,953,889
9       12   Oil seeds and oleaginous fruits; Miscellaneous grains; Seeds and fruit; Industrial plants             $1,771,679
10      76   Aluminum and articles thereof                                                                         $1,335,594


                                                                South Dakota -- Page 17
South Dakota's International and Domestic Ports-to-Plains Region Trading Relationships

                                                                                                                                         Rail Truck
                                                                                                                                     Change Change
                                                                         Rail Truck            Domestic --                             2002-  2002-
        2002                    Domestic -- 2007                      Change Change                    2015                             2015   2015
Exports      Rail Truck         Exports            Rail Truck                               Exports            Rail    Truck
Colorado       0    137 9%      Colorado             3    249    8%      0%       82%       Colorado              3      254    6%              86%
Montana        0    108 7%      Montana             17    191    7%               77%       Montana              21      161    4%              49%
Nebraska       0    409 27%     Nebraska             1    843   27%              106%       Nebraska              1    1,451   35%             255%
New Mexico     0     27 2%      New Mexico           4     26    1%               -4%       New Mexico            4       26    1%              -3%
Oklahoma       0     55 4%      Oklahoma             2    128    4%              133%       Oklahoma              2    1,083   26%            1869%
North Dakota   1    199 13%     North Dakota         0    645   21%    -100%     224%       North Dakota       -         135    3%    -100%    -32%
South Dakota                    South Dakota                                                South Dakota
Texas          0    452 30%     Texas              145   476 20%                   5%       Texas              155       454 15%                1%
Wyoming        0    122 8%      Wyoming              0   372 12%                 205%       Wyoming            -         382   9%             213%
Total ($m)     1 1,509          Total ($m)         173 2,930 100% 17187%          94%       Total ($m)         186     3,946 100% 18473%      161%
                  1,510                                3,103                     105%                                  4,132                  174%

Imports      Rail Truck         Imports            Rail Truck                               Imports           Rail    Truck
Colorado       0    187   10%   Colorado                  227    7%               21%       Colorado           -         261   4%              39%
Montana       40    146   10%   Montana              4    114    4%     -90%     -22%       Montana               2      164   3%      -94%    12%
Nebraska       0    720   40%   Nebraska                1,783   54%              148%       Nebraska           -       2,338  38%             225%
New Mexico     0      0    0%   New Mexico                       0%                         New Mexico         -           2   0%
North Dakota   0    513   28%   North Dakota             745    22%               45%       Oklahoma             12    1,791  30%             249%
Oklahoma       0     26    1%   Oklahoma                  86     3%              231%       North Dakota       -         104   2%             299%
South Dakota                    South Dakota                                                South Dakota                        0
Texas          0    106   6%    Texas                          0%               -100%       Texas              116       970 18%              815%
Wyoming        0     64   4%    Wyoming             22   335 11%                 423%       Wyoming             26       297   5%             364%
Total ($m)    40 1,762          Total ($m)          26 3,290 100%       -35%      87%       Total ($m)         156     5,926 100%     291%    236%
                  1,802                                3,316                      84%                                  6,083                  238%

TOTAL        Rail Truck         TOTALS             Rail Truck                               TOTALS            Rail    Truck
Colorado       0    324 10%     Colorado             3    476    7%               47%       Colorado              3      515   5%              59%
Montana       40    254 9%      Montana             21    305    5%     -48%      20%       Montana              23      324   3%      -42%    28%
Nebraska       0 1,129 34%      Nebraska             1 2,626    41%              133%       Nebraska              1    3,789  37%             236%
New Mexico     0     27 1%      New Mexico           4     26    0%               -4%       New Mexico            4       28   0%               4%
North Dakota   0    568 17%     North Dakota         2    873   14%               54%       North Dakota        14     2,874  28%             406%
Oklahoma       1    225 7%      Oklahoma             0    731   11%    -100%     225%       Oklahoma           -         238   2%     -100%     6%
South Dakota                    South Dakota                                                South Dakota                        0
Texas          0    558 17%     Texas              145   476 10%                 -15%       South Dakota       271     1,425 17%              155%
Wyoming        0    186 6%      Wyoming             22   707 11%                 280%       Texas               26       679   7%             265%
Total ($m)    41 3,271          Total ($m)         199 6,220 100%      385%       90%       Total ($m)         342     9,872 100%     -142%   202%
                  3,312                                6,419                      94%                                 10,214                  208%


                                                                  South Dakota -- Page 18

Weitere ähnliche Inhalte

Andere mochten auch

Jornal Mercosuper 2011 - Dia 01
Jornal Mercosuper 2011 - Dia 01Jornal Mercosuper 2011 - Dia 01
Jornal Mercosuper 2011 - Dia 01
Brasil
 
Aguahotels em Modim de Basto - Lenda e percurso
Aguahotels em Modim de Basto  - Lenda e percursoAguahotels em Modim de Basto  - Lenda e percurso
Aguahotels em Modim de Basto - Lenda e percurso
BORGES João
 
Forats Negres1
Forats Negres1Forats Negres1
Forats Negres1
claudia
 
C:\Documents And Settings\Prof 01\Escritorio\Ppt
C:\Documents And Settings\Prof 01\Escritorio\PptC:\Documents And Settings\Prof 01\Escritorio\Ppt
C:\Documents And Settings\Prof 01\Escritorio\Ppt
antinomi
 
Semeando sustentabilidade
Semeando sustentabilidadeSemeando sustentabilidade
Semeando sustentabilidade
Lidiane Martins
 
Gift Basketsppt
Gift BasketspptGift Basketsppt
Gift Basketsppt
tessie2you
 

Andere mochten auch (20)

Call to Action
Call to ActionCall to Action
Call to Action
 
París
ParísParís
París
 
Passeio Parque das Águas 2013
Passeio Parque das Águas 2013Passeio Parque das Águas 2013
Passeio Parque das Águas 2013
 
Problemas normal
Problemas normalProblemas normal
Problemas normal
 
Cartilha Bacalhau
Cartilha BacalhauCartilha Bacalhau
Cartilha Bacalhau
 
Tese carolina franco
Tese carolina francoTese carolina franco
Tese carolina franco
 
Manual cantinas
Manual cantinasManual cantinas
Manual cantinas
 
Jornal Mercosuper 2011 - Dia 01
Jornal Mercosuper 2011 - Dia 01Jornal Mercosuper 2011 - Dia 01
Jornal Mercosuper 2011 - Dia 01
 
Aguahotels em Modim de Basto - Lenda e percurso
Aguahotels em Modim de Basto  - Lenda e percursoAguahotels em Modim de Basto  - Lenda e percurso
Aguahotels em Modim de Basto - Lenda e percurso
 
Forats Negres1
Forats Negres1Forats Negres1
Forats Negres1
 
5977
59775977
5977
 
Roteiros Apresentações CF 2014
Roteiros Apresentações CF 2014 Roteiros Apresentações CF 2014
Roteiros Apresentações CF 2014
 
C:\Documents And Settings\Prof 01\Escritorio\Ppt
C:\Documents And Settings\Prof 01\Escritorio\PptC:\Documents And Settings\Prof 01\Escritorio\Ppt
C:\Documents And Settings\Prof 01\Escritorio\Ppt
 
Literatura 1 2013
Literatura 1   2013Literatura 1   2013
Literatura 1 2013
 
5958
59585958
5958
 
[Sob Medida] Academia Empresarial Apras
 [Sob Medida]  Academia Empresarial Apras [Sob Medida]  Academia Empresarial Apras
[Sob Medida] Academia Empresarial Apras
 
Semeando sustentabilidade
Semeando sustentabilidadeSemeando sustentabilidade
Semeando sustentabilidade
 
Gift Basketsppt
Gift BasketspptGift Basketsppt
Gift Basketsppt
 
Cartilha da alimentação saudável e segura
Cartilha da  alimentação  saudável e seguraCartilha da  alimentação  saudável e segura
Cartilha da alimentação saudável e segura
 
Dez passos para_familia
Dez passos para_familiaDez passos para_familia
Dez passos para_familia
 

Ähnlich wie South Dakota Trade Relationships 2004-2011

North Dakota Trade through Ports-to-Plains Region – 2004-2010
North Dakota Trade through Ports-to-Plains Region – 2004-2010North Dakota Trade through Ports-to-Plains Region – 2004-2010
North Dakota Trade through Ports-to-Plains Region – 2004-2010
Ports-To-Plains Blog
 
South Dakota Trade through Ports-to-Plains Region – 2004-2010
South Dakota Trade through Ports-to-Plains Region – 2004-2010South Dakota Trade through Ports-to-Plains Region – 2004-2010
South Dakota Trade through Ports-to-Plains Region – 2004-2010
Ports-To-Plains Blog
 
Wyoming Trade through Ports-to-Plains Region – 2004-2010
Wyoming Trade through Ports-to-Plains Region – 2004-2010Wyoming Trade through Ports-to-Plains Region – 2004-2010
Wyoming Trade through Ports-to-Plains Region – 2004-2010
Ports-To-Plains Blog
 
Montana's Trading Relationship Through the Ports-to-Plains Region -- 2004-2010
Montana's Trading Relationship Through the Ports-to-Plains Region -- 2004-2010Montana's Trading Relationship Through the Ports-to-Plains Region -- 2004-2010
Montana's Trading Relationship Through the Ports-to-Plains Region -- 2004-2010
Ports-To-Plains Blog
 
Colorado's Trading Relationship Through the Ports-to-Plains Region -- 2004-2010
Colorado's Trading Relationship Through the Ports-to-Plains Region -- 2004-2010Colorado's Trading Relationship Through the Ports-to-Plains Region -- 2004-2010
Colorado's Trading Relationship Through the Ports-to-Plains Region -- 2004-2010
Ports-To-Plains Blog
 
Nebraska Trade through Ports-to-Plains Region – 2004-2010
Nebraska Trade through Ports-to-Plains Region – 2004-2010Nebraska Trade through Ports-to-Plains Region – 2004-2010
Nebraska Trade through Ports-to-Plains Region – 2004-2010
Ports-To-Plains Blog
 
New Mexico Trade through Ports-to-Plains Region – 2004-2010
New Mexico Trade through Ports-to-Plains Region – 2004-2010New Mexico Trade through Ports-to-Plains Region – 2004-2010
New Mexico Trade through Ports-to-Plains Region – 2004-2010
Ports-To-Plains Blog
 
Texas Trade through Ports-to-Plains Region – 2004-2010
Texas Trade through Ports-to-Plains Region – 2004-2010Texas Trade through Ports-to-Plains Region – 2004-2010
Texas Trade through Ports-to-Plains Region – 2004-2010
Ports-To-Plains Blog
 
Naa Annual Newspaper Ad Expenditures 09
Naa Annual Newspaper Ad Expenditures 09Naa Annual Newspaper Ad Expenditures 09
Naa Annual Newspaper Ad Expenditures 09
Juan Varela
 
Cushman & Wakefield Q12018 Canadian Office Statistical Summary
 Cushman & Wakefield Q12018 Canadian Office Statistical Summary Cushman & Wakefield Q12018 Canadian Office Statistical Summary
Cushman & Wakefield Q12018 Canadian Office Statistical Summary
Guy Masse
 
Cushman & Wakefield's Canadian Office Statistical Summary Q4 2018
Cushman & Wakefield's Canadian Office Statistical Summary Q4 2018Cushman & Wakefield's Canadian Office Statistical Summary Q4 2018
Cushman & Wakefield's Canadian Office Statistical Summary Q4 2018
Guy Masse
 
Slide presentation 1 q10
Slide presentation 1 q10Slide presentation 1 q10
Slide presentation 1 q10
Cia Hering RI
 
Napco Better Result
Napco Better ResultNapco Better Result
Napco Better Result
pmoskie
 

Ähnlich wie South Dakota Trade Relationships 2004-2011 (20)

North Dakota Trade through Ports-to-Plains Region – 2004-2010
North Dakota Trade through Ports-to-Plains Region – 2004-2010North Dakota Trade through Ports-to-Plains Region – 2004-2010
North Dakota Trade through Ports-to-Plains Region – 2004-2010
 
South Dakota Trade through Ports-to-Plains Region – 2004-2010
South Dakota Trade through Ports-to-Plains Region – 2004-2010South Dakota Trade through Ports-to-Plains Region – 2004-2010
South Dakota Trade through Ports-to-Plains Region – 2004-2010
 
Wyoming Trade through Ports-to-Plains Region – 2004-2010
Wyoming Trade through Ports-to-Plains Region – 2004-2010Wyoming Trade through Ports-to-Plains Region – 2004-2010
Wyoming Trade through Ports-to-Plains Region – 2004-2010
 
Montana's Trading Relationship Through the Ports-to-Plains Region -- 2004-2010
Montana's Trading Relationship Through the Ports-to-Plains Region -- 2004-2010Montana's Trading Relationship Through the Ports-to-Plains Region -- 2004-2010
Montana's Trading Relationship Through the Ports-to-Plains Region -- 2004-2010
 
Colorado's Trading Relationship Through the Ports-to-Plains Region -- 2004-2010
Colorado's Trading Relationship Through the Ports-to-Plains Region -- 2004-2010Colorado's Trading Relationship Through the Ports-to-Plains Region -- 2004-2010
Colorado's Trading Relationship Through the Ports-to-Plains Region -- 2004-2010
 
Ports-to-Plains Trade Data Points Explanation
Ports-to-Plains Trade Data Points ExplanationPorts-to-Plains Trade Data Points Explanation
Ports-to-Plains Trade Data Points Explanation
 
Nebraska Trade through Ports-to-Plains Region – 2004-2010
Nebraska Trade through Ports-to-Plains Region – 2004-2010Nebraska Trade through Ports-to-Plains Region – 2004-2010
Nebraska Trade through Ports-to-Plains Region – 2004-2010
 
New Mexico Trade through Ports-to-Plains Region – 2004-2010
New Mexico Trade through Ports-to-Plains Region – 2004-2010New Mexico Trade through Ports-to-Plains Region – 2004-2010
New Mexico Trade through Ports-to-Plains Region – 2004-2010
 
Texas Trade through Ports-to-Plains Region – 2004-2010
Texas Trade through Ports-to-Plains Region – 2004-2010Texas Trade through Ports-to-Plains Region – 2004-2010
Texas Trade through Ports-to-Plains Region – 2004-2010
 
The 99% Tax Plan Taxation Schedules
The 99% Tax Plan Taxation SchedulesThe 99% Tax Plan Taxation Schedules
The 99% Tax Plan Taxation Schedules
 
Naa Annual Newspaper Ad Expenditures 09
Naa Annual Newspaper Ad Expenditures 09Naa Annual Newspaper Ad Expenditures 09
Naa Annual Newspaper Ad Expenditures 09
 
Apimec 2 q05 results
Apimec   2 q05 resultsApimec   2 q05 results
Apimec 2 q05 results
 
JLL Great Lakes Scorecard
JLL Great Lakes ScorecardJLL Great Lakes Scorecard
JLL Great Lakes Scorecard
 
CNR_DCF(USD)
CNR_DCF(USD)CNR_DCF(USD)
CNR_DCF(USD)
 
Cushman & Wakefield Q12018 Canadian Office Statistical Summary
 Cushman & Wakefield Q12018 Canadian Office Statistical Summary Cushman & Wakefield Q12018 Canadian Office Statistical Summary
Cushman & Wakefield Q12018 Canadian Office Statistical Summary
 
Cushman & Wakefield's Canadian Office Statistical Summary Q4 2018
Cushman & Wakefield's Canadian Office Statistical Summary Q4 2018Cushman & Wakefield's Canadian Office Statistical Summary Q4 2018
Cushman & Wakefield's Canadian Office Statistical Summary Q4 2018
 
1 q10
1 q101 q10
1 q10
 
Slide presentation 1 q10
Slide presentation 1 q10Slide presentation 1 q10
Slide presentation 1 q10
 
Napco Better Result
Napco Better ResultNapco Better Result
Napco Better Result
 
July 2021 - Market Report
July 2021 - Market Report July 2021 - Market Report
July 2021 - Market Report
 

Mehr von Ports-To-Plains Blog

Mehr von Ports-To-Plains Blog (20)

Canada and U.S. Trade Overview
Canada and U.S. Trade Overview Canada and U.S. Trade Overview
Canada and U.S. Trade Overview
 
2013 Ports-to-Plains Alliance Energy Conference Handouts
2013 Ports-to-Plains Alliance Energy Conference Handouts2013 Ports-to-Plains Alliance Energy Conference Handouts
2013 Ports-to-Plains Alliance Energy Conference Handouts
 
Energy Development Impact on Transportation Infrastructure
Energy Development Impact on Transportation InfrastructureEnergy Development Impact on Transportation Infrastructure
Energy Development Impact on Transportation Infrastructure
 
Wind Energy's Future and the Impact on U.S. Manufacturing
Wind Energy's Future and the Impact on U.S. ManufacturingWind Energy's Future and the Impact on U.S. Manufacturing
Wind Energy's Future and the Impact on U.S. Manufacturing
 
Compressed Air Wind Energy Storage
Compressed Air Wind Energy StorageCompressed Air Wind Energy Storage
Compressed Air Wind Energy Storage
 
Fuels Policy, Ethanol and RFS Reform Political and Policy Implications on Gas...
Fuels Policy, Ethanol and RFS Reform Political and Policy Implications on Gas...Fuels Policy, Ethanol and RFS Reform Political and Policy Implications on Gas...
Fuels Policy, Ethanol and RFS Reform Political and Policy Implications on Gas...
 
Ports-to-Plains Letter Submitted to Department of State
Ports-to-Plains Letter Submitted to Department of StatePorts-to-Plains Letter Submitted to Department of State
Ports-to-Plains Letter Submitted to Department of State
 
News Release Keystone XL Supporting SEIS Finding 041813
News Release Keystone XL Supporting SEIS Finding 041813News Release Keystone XL Supporting SEIS Finding 041813
News Release Keystone XL Supporting SEIS Finding 041813
 
Ports-to-Plains: The Importance of a Statewide Transportation to Colorado's E...
Ports-to-Plains: The Importance of a Statewide Transportation to Colorado's E...Ports-to-Plains: The Importance of a Statewide Transportation to Colorado's E...
Ports-to-Plains: The Importance of a Statewide Transportation to Colorado's E...
 
2013 Energy Conference Save the Date
2013 Energy Conference Save the Date2013 Energy Conference Save the Date
2013 Energy Conference Save the Date
 
February 2013 Update from the Ports-to-Plains Alliance
February 2013 Update from the Ports-to-Plains AllianceFebruary 2013 Update from the Ports-to-Plains Alliance
February 2013 Update from the Ports-to-Plains Alliance
 
Draft Supplemental EIS for the Keystone XL Project
Draft Supplemental EIS for the Keystone XL ProjectDraft Supplemental EIS for the Keystone XL Project
Draft Supplemental EIS for the Keystone XL Project
 
PTP supports Heineman Keystone XL Pipeline Decision
PTP supports Heineman Keystone XL Pipeline DecisionPTP supports Heineman Keystone XL Pipeline Decision
PTP supports Heineman Keystone XL Pipeline Decision
 
Keystone XL Letter Dec 2012 NEDEQ
Keystone XL Letter Dec 2012 NEDEQKeystone XL Letter Dec 2012 NEDEQ
Keystone XL Letter Dec 2012 NEDEQ
 
News Release PTP Keystone XL Nebraska
News Release PTP Keystone XL NebraskaNews Release PTP Keystone XL Nebraska
News Release PTP Keystone XL Nebraska
 
Ports-to-Plains Alliance Webinar 113012
Ports-to-Plains Alliance Webinar 113012Ports-to-Plains Alliance Webinar 113012
Ports-to-Plains Alliance Webinar 113012
 
Comments on Interim Guidance on State Freight Plans and State Advisory Commit...
Comments on Interim Guidance on State Freight Plans and State Advisory Commit...Comments on Interim Guidance on State Freight Plans and State Advisory Commit...
Comments on Interim Guidance on State Freight Plans and State Advisory Commit...
 
Interim Guidance on State Freight Plans and State Freight Advisory Committees
Interim Guidance on State Freight Plans and State Freight Advisory CommitteesInterim Guidance on State Freight Plans and State Freight Advisory Committees
Interim Guidance on State Freight Plans and State Freight Advisory Committees
 
Ports-to-Plains Alliance Northern Working Group Strategic Plan October 2012
Ports-to-Plains Alliance Northern Working Group Strategic Plan October 2012Ports-to-Plains Alliance Northern Working Group Strategic Plan October 2012
Ports-to-Plains Alliance Northern Working Group Strategic Plan October 2012
 
Return to Rural
Return to RuralReturn to Rural
Return to Rural
 

South Dakota Trade Relationships 2004-2011

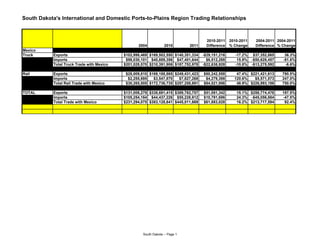
  • 1. South Dakota's International and Domestic Ports-to-Plains Region Trading Relationships 2010-2011 2010-2011 2004-2011 2004-2011 2004 2010 2011 Difference % Change Difference % Change Mexico Truck Exports $102,998,469 $169,502,550 $140,351,334 -$29,151,216 -17.2% $37,352,865 36.3% Imports $98,030,101 $40,889,356 $47,401,644 $6,512,288 15.9% -$50,628,457 -51.6% Total Truck Trade with Mexico $201,028,570 $210,391,906 $187,752,978 -$22,638,928 -10.8% -$13,275,592 -6.6% #DIV/0! Rail Exports $28,009,810 $169,188,865 $249,431,423 $80,242,558 47.4% $221,421,613 790.5% Imports $2,255,695 $3,547,870 $7,827,268 $4,279,398 120.6% $5,571,573 247.0% Total Rail Trade with Mexico $30,265,505 $172,736,735 $257,258,691 $84,521,956 48.9% $226,993,186 750.0% #DIV/0! TOTAL Exports $131,008,279 $338,691,415 $389,782,757 $51,091,342 15.1% $258,774,478 197.5% Imports $105,254,164 $44,437,226 $55,228,912 $10,791,686 24.3% -$45,056,884 -47.5% Total Trade with Mexico $231,294,075 $383,128,641 $445,011,669 $61,883,028 16.2% $213,717,594 92.4% South Dakota -- Page 1
  • 2. South Dakota's International and Domestic Ports-to-Plains Region Trading Relationships Laredo, TX Truck Exports $91,369,338 $125,435,030 $86,126,518 -$39,308,512 -31.3% -$5,242,820 -5.7% % of Total Exports to Mexico 88.7% 74.0% 61.4% -12.6% -27.3% Imports $6,597,587 $31,798,261 $36,786,486 $4,988,225 15.7% $30,188,899 457.6% % of Total Imports to Mexico 6.4% 77.8% 77.6% -0.2% 71.2% Total Truck Trade Thru Laredo $97,966,925 $157,233,291 $122,913,004 -$34,320,287 -21.8% $24,946,079 25.5% % Total Trade with Mexico 48.7% 74.7% 65.5% -9.3% 16.7% Rail Exports $26,592,628 $69,278,087 $88,778,013 $19,499,926 28.1% $62,185,385 233.8% % of Total Exports to Mexico 94.9% 40.9% 35.6% -5.4% -59.3% Imports $916,918 $43,341 $762,081 $718,740 1658.3% -$154,837 -16.9% % of Total Imports to Mexico 40.6% 1.2% 9.7% 8.5% -30.9% Total Rail Trade Thru Laredo $27,509,546 $69,321,428 $89,540,094 $20,218,666 29.2% $62,030,548 225.5% % Total Trade with Mexico 90.9% 40.1% 34.8% -5.3% -56.1% TOTAL Exports $117,961,966 $194,713,117 $174,904,531 -$19,808,586 -10.2% $56,942,565 48.3% % of Total Exports to Mexico 90.0% 57.5% 44.9% -12.6% -45.2% Imports $7,514,505 $31,841,602 $37,548,567 $5,706,965 17.9% $30,034,062 399.7% % of Total Imports to Mexico 7.1% 71.7% 68.0% -3.7% 60.8% Total Trade Thru Laredo $125,476,471 $226,554,719 $212,453,098 -$14,101,621 -6.2% $86,976,627 69.3% % Total Trade with Mexico 54.2% 59.1% 47.7% -11.4% -6.5% South Dakota -- Page 2
  • 3. South Dakota's International and Domestic Ports-to-Plains Region Trading Relationships Eagle Pass, TX Truck Exports $37,320 $372,307 $4,099,823 $3,727,516 1001.2% $4,062,503 10885.6% % of Total Exports to Mexico 0.0% 0.2% 2.9% 2.7% 2.9% Imports $0 $0 $0 $0 #DIV/0! $0 #DIV/0! % of Total Imports to Mexico 0.0% 0.0% 0.0% 0.0% 0.0% Total Truck Trade Thru Eagle Pass 8,687,358 $372,307 $4,099,823 $3,727,516 1001.2% $4,062,503 -52.8% % Total Trade with Mexico 4.3% 0.2% 2.2% 2.0% -2.1% Rail Exports $548,682 $43,276,107 $78,982,295 $35,706,188 82.5% $78,433,613 14294.9% % of Total Exports to Mexico 2.0% 25.6% 31.7% 6.1% 29.7% Imports $0 $3,504,529 $7,065,187 $3,560,658 101.6% $7,065,187 #DIV/0! % of Total Imports to Mexico 0.0% 98.8% 90.3% -8.5% 90.3% Total Rail Trade Thru Eagle Pass $548,682 $46,780,636 $86,047,482 $39,266,846 83.9% $85,498,800 15582.6% % Total Trade with Mexico 1.8% 27.1% 33.4% 6.4% 31.6% TOTAL Exports $586,002 $43,648,414 $83,082,118 $39,433,704 90.3% $82,496,116 14077.8% % of Total Exports to Mexico 0.4% 12.9% 21.3% 8.4% 20.9% Imports $0 $3,504,529 $7,065,187 $3,560,658 210.7% $7,065,187 #DIV/0! % of Total Imports to Eagle Pass 0.0% 7.9% 12.8% 4.9% 12.8% Total Trade Thru Laredo $586,002 $47,152,943 $90,147,305 $42,994,362 91.2% $89,561,303 15283.4% % Total Trade with Mexico 0.3% 12.3% 20.3% 7.9% 20.0% South Dakota -- Page 3
  • 4. South Dakota's International and Domestic Ports-to-Plains Region Trading Relationships Del Rio, TX Truck Exports $0 $0 $0 $0 #DIV/0! $0 #DIV/0! % of Total Exports to Mexico 0.0% 0.0% 0.0% 0.0% 0.0% Imports $0 $0 $0 $0 #DIV/0! $0 #DIV/0! % of Total Imports to Mexico 0.0% 0.0% 0.0% 0.0% 0.0% Total Truck Trade Thru Del Rio $0 $0 $0 $0 #DIV/0! $0 #DIV/0! % Total Trade with Mexico 0.0% 0.0% 0.0% 0.0% 0.0% Rail Exports $0 #DIV/0! % of Total Exports to Mexico 0.0% #DIV/0! #DIV/0! #DIV/0! Imports $0 #DIV/0! % of Total Imports to Mexico 0.0% #DIV/0! #DIV/0! #DIV/0! Total Rail Trade Thru Del Rio $0 #DIV/0! % Total Trade with Mexico 0.0% 0.0% 0.0% 0.0% TOTAL Exports $0 $0 $0 $0 #DIV/0! $0 #DIV/0! % of Total Exports to Mexico 0.0% 0.0% 0.0% 0.0% 0.0% Imports $0 $0 $0 $0 #DIV/0! $0 #DIV/0! % of Total Imports to Mexico 0.0% 0.0% 0.0% 0.0% 0.0% Total Trade Thru Del Rio $0 $0 $0 $0 #DIV/0! $0 #DIV/0! % Total Trade with Mexico 0.0% 0.0% 0.0% 0.0% 0.0% South Dakota -- Page 4
  • 5. South Dakota's International and Domestic Ports-to-Plains Region Trading Relationships PTP 0 Truck Exports $91,406,658 $125,807,337 $90,226,341 -$35,580,996 -28.3% -$1,180,317 -1.3% % of Total Exports to Mexico 88.7% 74.2% 64.3% -9.9% -24.5% Imports $6,597,587 $31,798,261 $36,786,486 $4,988,225 15.7% $30,188,899 457.6% % of Total Imports to Mexico 6.4% 77.8% 77.6% -0.2% 71.2% Total Truck Trade Thru PTP $98,004,245 $157,605,598 $127,012,827 -$30,592,771 -19.4% $29,008,582 29.6% % Total Trade with Mexico 48.8% 74.9% 67.6% -7.3% 18.9% Rail Exports $27,141,310 $112,554,194 $167,760,308 $55,206,114 49.0% $140,618,998 518.1% % of Total Exports to Mexico 96.9% 66.5% 67.3% 0.7% -29.6% Imports $916,918 $3,547,870 $7,827,268 $4,279,398 120.6% $6,910,350 753.6% % of Total Imports to Mexico 0.0% 100.0% 100.0% 0.0% 100.0% Total Rail Trade Thru PTP $28,058,228 $116,102,064 $175,587,576 $59,485,512 51.2% $147,529,348 525.8% % Total Trade with Mexico 92.7% 67.2% 68.3% 1.0% -24.5% TOTAL Exports $118,547,968 $238,361,531 $257,986,649 $19,625,118 8.2% $139,438,681 117.6% % of Total Exports to Mexico 90.5% 70.4% 66.2% -4.2% -24.3% Imports $7,514,505 $35,346,131 $44,613,754 $9,267,623 26.2% $37,099,249 493.7% % of Total Imports to Mexico 7.1% 79.5% 80.8% 1.2% 73.6% Total Trade Thru PTP $126,062,473 $273,707,662 $302,600,403 $28,892,741 10.6% $176,537,930 140.0% % Total Trade with Mexico 54.5% 71.4% 68.0% -3.4% 13.5% South Dakota -- Page 5
  • 6. South Dakota's International and Domestic Ports-to-Plains Region Trading Relationships 2011 Leading Exports from South Dakota to Mexico (Surface Transportation) 2011 Rank Export 1 23 Food Residues and Waste $165,589,583 2 2 Meat and Edible Offal $96,950,036 3 15 Animal or Vegetable Fats and Oils $86,067,319 4 76 Aluminum and Articles $9,747,188 5 41 Raw Hides and Skins $8,713,157 6 84 Computer-Related Machinery and Parts $6,219,366 7 85 Electrical Machinery; Equipment and Parts $4,157,347 8 5 Products of Animal Origin $3,162,869 9 48 Paper and Paperboard $2,831,993 10 95 Toys; Games and Sport Equipment $1,246,475 2011 Leading Imports to South Dakota from Mexico (Surface Transportation) 2011 Import 1 87 Vehicles Other than Railway $23,669,893 2 84 Computer-Related Machinery and Parts $15,791,521 3 48 Paper and Paperboard $9,382,483 4 85 Electrical Machinery; Equipment and Parts $1,845,429 5 98 Special Classification Provisions $1,148,535 6 70 Glass $1,124,856 7 73 Articles of Iron and Steel $941,134 8 94 Furniture; Lamps and Prefabricated Buildings $537,325 9 40 Rubber and Articles $246,113 10 5 Products of Animal Origin $232,815 South Dakota -- Page 6
  • 7. South Dakota's International and Domestic Ports-to-Plains Region Trading Relationships 2011 Leading Exports from South Dakota to Mexico (Surface Transportation) 2011 Rank Coahuila Export 1 84 Computer-Related Machinery and Parts $424,403 2 11 Malts; Starches and Inulin $247,842 3 85 Electrical Machinery; Equipment and Parts $111,134 4 95 Toys; Games and Sport Equipment $57,719 5 72 Iron and Steel $17,550 6 73 Articles of Iron and Steel $10,200 7 8 9 10 2011 Leading Exports from South Dakota to Mexico (Surface Transportation) 2011 Rank Nuevo Leon Export 1 2 Meat and edible meat offal $41,363,283 2 48 Paper and paperboard; Articles of paper pulp; of paper or of paperboard $2,281,883 3 85 Electrical machinery and equipment and parts thereof; Sound recorders and reproducers $1,360,345 4 23 Residues and waste from the food industries; Prepared animal feed $1,197,901 5 5 Products of animal origin; not elsewhere specified or included $1,011,741 6 84 Nuclear reactors; boilers; machinery and mechanical appliances; parts thereof $822,771 7 39 Plastics and articles thereof $547,148 8 15 Animal or vegetable fats and oils and their cleavage products; Prepared edible fats; Animal waxes $135,055 9 68 Articles of stone; plaster; cement; asbestos; mica or similar materials $133,799 10 16 Preparations of meat; of fish; or of crustaceans; mollusks or other aquatic invertebrates $92,025 South Dakota -- Page 7
  • 8. South Dakota's International and Domestic Ports-to-Plains Region Trading Relationships 2011 Leading Exports from South Dakota to Mexico (Surface Transportation) 2011 Rank Tamaulipas Export 1 2 Meat and edible meat offal $920,095 2 5 Products of animal origin; not elsewhere specified or included $521,103 3 23 Residues and waste from the food industries; Prepared animal feed $422,140 4 84 Nuclear reactors; boilers; machinery and mechanical appliances; parts thereof $110,910 5 1 Live animals $20,000 6 87 Vehicles; other than railway or tramway rolling stock; and parts and accessories thereof $10,000 7 8 9 10 South Dakota -- Page 8
  • 9. South Dakota's International and Domestic Ports-to-Plains Region Trading Relationships 2010-2011 2010-2011 2004-2011 2004-2011 2004 2010 2011 Difference % Change Difference % Change Canada Truck Exports $223,756,926.00 $365,384,613 $462,704,621 $97,320,008 26.6% $238,947,695 106.8% Imports $285,791,567.00 $257,678,166 $301,835,945 $44,157,779 17.1% $16,044,378 5.6% Total Truck Trade with Canada $509,548,493.00 $623,062,779 $764,540,566 $141,477,787 22.7% $254,992,073 50.0% #DIV/0! Rail Exports $14,565,826.00 $35,363,107 $42,900,489 $7,537,382 21.3% $28,334,663 194.5% Imports $91,626,462.00 $87,758,398 $108,975,131 $21,216,733 24.2% $17,348,669 18.9% Total Rail Trade with Canada $106,192,288.00 $123,121,505 $151,875,620 $28,754,115 23.4% $45,683,332 43.0% $0 #DIV/0! TOTAL Exports $238,322,752.00 $400,747,720 $505,605,110 $104,857,390 26.2% $267,282,358 112.2% Imports $377,418,029.00 $345,436,564 $410,811,076 $65,374,512 18.9% $33,393,047 8.8% Total Trade with Canada $615,740,781.00 $746,184,284 $916,416,186 $170,231,902 22.8% $300,675,405 48.8% South Dakota -- Page 9
  • 10. South Dakota's International and Domestic Ports-to-Plains Region Trading Relationships Raymond, MT Truck Exports $917,406 $2,945,323 $5,863,865 $2,918,542 99.1% $4,946,459 539.2% % of Total Exports to Canada 0.4% 0.8% 1.3% 0.5% 0.9% Imports $2,364,561 $2,428,305 $8,639,952 $6,211,647 255.8% $6,275,391 265.4% % of Total Imports to Canada 0.8% 0.9% 2.9% 1.9% 2.0% Total Truck Trade Thru Raymond $3,281,967 $5,373,628 $14,503,817 $9,130,189 169.9% $11,221,850 341.9% % Total Trade with Canada 0.6% 0.9% 1.9% 1.0% 1.3% Rail Exports $0 % of Total Exports to Canada 0.0% 0.0% Imports $0 % of Total Imports to Canada 0.0% 0.0% Total Truck Trade Thru Raymond $0 $0 % Total Trade with Canada 0.0% 0.0% TOTAL Exports $917,406 $2,945,323 $5,863,865 $2,918,542 99.1% $4,946,459 539.2% % of Total Exports to Canada 0.4% 0.7% 1.2% 0.4% 0.8% Imports $2,364,561 $2,428,305 $8,639,952 $6,211,647 255.8% $6,275,391 265.4% % of Total Imports to Canada 0.6% 0.7% 2.1% 1.4% 1.5% Total Trade Thru Raymond $3,281,967 $5,373,628 $14,503,817 $9,130,189 169.9% $11,221,850 341.9% % Total Trade with Canada 0.5% 0.7% 1.6% 0.9% 1.0% South Dakota -- Page 10
  • 11. South Dakota's International and Domestic Ports-to-Plains Region Trading Relationships Sweet Grass, MT Truck Exports $26,178,994 $10,002,061 $19,644,045 $9,641,984 96.4% -$6,534,949 -25.0% % of Total Exports to Canada 11.7% 2.7% 4.2% 1.5% -7.5% Imports $17,294,411 $23,570,227 $18,334,791 -$5,235,436 -22.2% $1,040,380 6.0% % of Total Exports to Canada 6.1% 9.1% 6.1% -3.1% 0.0% Total Truck Trade Thru Sweetgrass 43,473,405 $33,572,288 $37,978,836 $4,406,548 13.1% -$5,494,569 -12.6% % Total Trade with Canada 8.5% 5.4% 5.0% -0.4% -3.6% Rail Exports $105,216 $20,745 $0 -$20,745 -100.0% -$105,216 -100.0% % of Total Exports to Canada 0.7% 0.1% 0.0% -0.1% -0.7% Imports $8,934,857 $9,469,980 $2,507,063 -$6,962,917 -73.5% -$6,427,794 -71.9% % of Total Exports to Canada 9.8% 10.8% 2.3% -8.5% -7.5% Total Rail Trade Thru Sweet Grass $9,040,073 $9,490,725 $2,507,063 -$6,983,662 -73.6% -$6,533,010 -72.3% % Total Trade with Canada 8.5% 7.7% 1.7% -6.1% -6.9% TOTAL Exports $26,284,210 $10,022,806 $19,644,045 $9,621,239 96.0% -$6,640,165 -25.3% % of Total Exports to Canada 11.0% 2.5% 3.9% 1.4% -7.1% Imports $26,229,268 $33,040,207 $20,841,854 -$12,198,353 -36.9% -$5,387,414 -20.5% % of Total Imports to Canada 6.9% 9.6% 5.1% -4.5% -1.9% Total Trade Thru Sweet Grass $52,513,478 $43,063,013 $40,485,899 -$2,577,114 -6.0% -$12,027,579 -22.9% % Total Trade with Canada 8.5% 5.8% 4.4% -1.4% -4.1% South Dakota -- Page 11
  • 12. South Dakota's International and Domestic Ports-to-Plains Region Trading Relationships Portal, ND Truck Exports $17,603,171 $50,923,036 $61,178,797 $10,255,761 20.1% $43,575,626 247.5% % of Total Exports to Canada 7.9% 13.9% 13.2% -0.7% 5.4% Imports $28,285,335 $48,687,792 $50,686,060 $1,998,268 4.1% $22,400,725 79.2% % of Total Imports to Canada 12.6% 18.9% 16.8% -2.1% 4.2% Total Truck Trade Thru Portal $45,888,506 $99,610,828 $111,864,857 $12,254,029 12.3% $65,976,351 143.8% % Total Trade with Canada 9.0% 16.0% 14.6% -1.4% 5.6% Rail Exports $8,039,014 $23,297,650 $32,024,869 $8,727,219 37.5% $23,985,855 298.4% % of Total Exports to Canada 55.2% 65.9% 74.6% 8.8% 19.5% Imports $8,136,062 $21,163,730 $11,391,285 -$9,772,445 -46.2% $3,255,223 40.0% % of Total Imports to Canada 8.9% 24.1% 10.5% -13.7% 1.6% Total Rail Trade Thru Portal $16,175,076 $44,461,380 $43,416,154 -$1,045,226 -2.4% $27,241,078 168.4% % Total Trade with Canada 15.2% 36.1% 28.6% -7.5% 13.4% TOTAL Exports $25,642,185 $74,220,686 $61,178,797 -$13,041,889 -17.6% $67,561,481 138.6% % of Total Exports to Canada 10.8% 18.5% 12.1% -6.4% 1.3% Imports $36,421,397 $69,851,522 $62,077,345 -$7,774,177 -11.1% $25,655,948 70.4% % of Total Imports to Canada 9.7% 20.2% 15.1% -5.1% 5.5% Total Trade Thru Portal $62,063,582 $144,072,208 $123,256,142 -$20,816,066 -14.4% $93,217,429 98.6% % Total Trade with Canada 10.1% 19.3% 13.4% -5.9% 3.4% South Dakota -- Page 12
  • 13. South Dakota's International and Domestic Ports-to-Plains Region Trading Relationships Wild Horse 0 Truck Exports $0 $0 $0 $0 #DIV/0! $0 #DIV/0! % of Total Exports to Canada 0.0% 0.0% 0.0% 0.0% 0.0% Imports $0 $246,317 $163,389 -$82,928 -33.7% $163,389 #DIV/0! % of Total Imports to Canada 0.0% 0.1% 0.1% 0.0% 0.1% Total Truck Trade Thru Wild Horse $0 $246,317 $163,389 -$82,928 -33.7% $163,389 #DIV/0! % Total Trade with Canada 0.0% 0.0% 0.0% 0.0% 0.0% Rail Exports $0 $0 $0 $0 #DIV/0! $0 #DIV/0! % of Total Exports to Canada 0.0% 0.0% 0.0% 0.0% 0.0% Imports $0 $0 $0 $0 #DIV/0! $0 #DIV/0! % of Total Imports to Canada 0.0% 0.0% 0.0% 0.0% 0.0% Total Rail Trade Thru Wild Horse $0 $0 $0 $0 #DIV/0! $0 #DIV/0! % Total Trade with Canada 0.0% 0.0% 0.0% 0.0% 0.0% TOTAL Exports $0 $0 $0 $0 #DIV/0! $0 #DIV/0! % of Total Exports to Canada 0.0% 0.0% 0.0% 0.0% 0.0% Imports $0 $246,317 $163,389 -$82,928 -33.7% $163,389 #DIV/0! % of Total Imports to Canada 0.0% 0.1% 0.0% 0.0% 0.0% Total Trade Thru Wild Horse $0 $246,317 $163,389 -$82,928 -33.7% $163,389 #DIV/0! % Total Trade with Canada 0.0% 0.0% 0.0% 0.0% 0.0% South Dakota -- Page 13
  • 14. South Dakota's International and Domestic Ports-to-Plains Region Trading Relationships PTP #DIV/0! Truck Exports $44,699,571 $63,870,420 $86,686,707 $22,816,287 35.7% $41,987,136 93.9% % of Total Exports to Canada 20.0% 17.5% 18.7% 1.3% -1.2% Imports $46,497,152 $75,449,659 $75,048,105 -$401,554 -0.5% $28,550,953 61.4% % of Total Imports to Canada 16.3% 29.3% 24.9% -4.4% 8.6% Total Truck Trade Thru PTP $91,196,723 $139,320,079 $161,734,812 $22,414,733 16.1% $70,538,089 77.3% % Total Trade with Canada 17.9% 22.4% 21.2% -1.2% 3.3% Rail Exports $8,144,230 $23,318,395 $32,024,869 $8,706,474 37.3% $23,880,639 293.2% % of Total Exports to Canada 3.6% 6.4% 6.9% 0.5% 3.3% Imports $17,070,919 $30,633,710 $13,898,348 -$16,735,362 -54.6% -$3,172,571 -18.6% % of Total Imports to Canada 6.0% 11.9% 4.6% -7.3% -1.4% Total Rail Trade Thru PTP $25,215,149 $53,952,105 $45,923,217 -$8,028,888 -14.9% $20,708,068 82.1% % Total Trade with Canada 4.9% 8.7% 6.0% -2.7% 1.1% TOTAL Exports $52,843,801 $87,188,815 $118,711,576 $31,522,761 36.2% $65,867,775 124.6% % of Total Exports to Canada 22.2% 21.8% 23.5% 1.7% 1.3% Imports $63,568,071 $106,083,369 $88,946,453 -$17,136,916 -16.2% $25,378,382 39.9% % of Total Imports to Canada 16.8% 30.7% 21.7% -9.1% 4.8% Total Trade Thru PTP $116,411,872 $193,272,184 $207,658,029 $14,385,845 7.4% $91,246,157 78.4% % Total Trade with Canada 18.9% 25.9% 22.7% -3.2% 3.8% South Dakota -- Page 14
  • 15. South Dakota's International and Domestic Ports-to-Plains Region Trading Relationships 2011 Leading Exports from South Dakota to Canada (Surface Transportation) 2011 Rank Export 1 84 Nuclear reactors; boilers; machinery and mechanical appliances; parts thereof $114,352,938 2 23 Residues and waste from the food industries; Prepared animal feed $87,377,799 3 2 Meat and edible meat offal $84,467,353 4 87 Vehicles; other than railway or tramway rolling stock; and parts and accessories thereof $80,651,675 5 39 Plastics and articles thereof $24,629,725 6 85 Electrical machinery and equipment and parts thereof; Sound recorders and reproducers $14,587,377 7 73 Articles of iron or steel $12,306,768 8 94 Furniture; Bedding; mattress supports; cushions and similar stuffed furnishings; Lighting fittings $10,056,922 9 76 Aluminum and articles thereof $9,154,097 10 12 Oil seeds and oleaginous fruits; Miscellaneous grains; Seeds and fruit; Industrial plants $8,737,109 2011 Leading Imports to South Dakota from Canada (Surface Transportation) 2011 Rank Import 1 31 Fertilizers $111,662,884 2 84 Nuclear reactors; boilers; machinery and mechanical appliances; parts thereof $73,752,843 3 39 Plastics and articles thereof $48,755,734 4 87 Vehicles; other than railway or tramway rolling stock; and parts and accessories thereof $31,659,662 5 98 Special classification provisions $26,150,127 6 44 Wood and articles of wood; Wood charcoal $22,248,176 7 1 Live animals $14,311,635 8 48 Paper and paperboard; Articles of paper pulp; of paper or of paperboard $13,819,266 9 73 Articles of iron or steel $11,725,958 10 85 Electrical machinery and equipment and parts thereof; Sound recorders and reproducers $7,489,269 South Dakota -- Page 15
  • 16. South Dakota's International and Domestic Ports-to-Plains Region Trading Relationships 2011 Leading Exports from South Dakota to Canada (Surface Transportation) 2011 Rank Alberta Export 1 23 Residues and waste from the food industries; Prepared animal feed $12,918,239 2 84 Nuclear reactors; boilers; machinery and mechanical appliances; parts thereof $6,067,046 3 87 Vehicles; other than railway or tramway rolling stock; and parts and accessories thereof $3,280,496 4 85 Electrical machinery and equipment and parts thereof; Sound recorders and reproducers $2,804,038 5 2 Meat and edible meat offal $1,486,626 6 39 Plastics and articles thereof $646,387 7 12 Oil seeds and oleaginous fruits; Miscellaneous grains; Seeds and fruit; Industrial plants $512,360 8 5 Products of animal origin; not elsewhere specified or included $504,821 9 34 Soap; organic surface-active agents; washing preparations; lubricating preparations; prepared waxes $449,666 10 76 Aluminum and articles thereof $432,550 2011 Leading Exports from South Dakota to Canada (Surface Transportation) 2011 Rank British Colombia Export 1 2 Meat and edible meat offal $16,684,641 2 23 Residues and waste from the food industries; Prepared animal feed $14,071,972 3 84 Nuclear reactors; boilers; machinery and mechanical appliances; parts thereof $10,472,349 4 39 Plastics and articles thereof $2,877,234 5 87 Vehicles; other than railway or tramway rolling stock; and parts and accessories thereof $1,601,410 6 4 Dairy produce; Birds' eggs; Natural honey; Edible products of animal origin; not elsewhere included $998,077 7 85 Electrical machinery and equipment and parts thereof; Sound recorders and reproducers $742,231 8 48 Paper and paperboard; Articles of paper pulp; of paper or of paperboard $696,081 9 76 Aluminum and articles thereof $259,154 10 15 Animal or vegetable fats and oils and their cleavage products; Prepared edible fats; Animal waxes $233,296 South Dakota -- Page 16
  • 17. South Dakota's International and Domestic Ports-to-Plains Region Trading Relationships 2011 Leading Exports from South Dakota to Canada (Surface Transportation) 2011 Rank Saskatchewan Export 1 84 Nuclear reactors; boilers; machinery and mechanical appliances; parts thereof $23,405,719 2 87 Vehicles; other than railway or tramway rolling stock; and parts and accessories thereof $17,034,716 3 72 Iron and steel $8,081,171 4 23 Residues and waste from the food industries; Prepared animal feed $5,083,850 5 73 Articles of iron or steel $4,950,174 6 94 Furniture; Bedding; mattress supports; cushions and similar stuffed furnishings; Lighting fittings $3,987,386 7 90 Optical; photographic; cinematographic; measuring; checking; precision; medical instruments $3,506,234 8 39 Plastics and articles thereof $2,953,889 9 12 Oil seeds and oleaginous fruits; Miscellaneous grains; Seeds and fruit; Industrial plants $1,771,679 10 76 Aluminum and articles thereof $1,335,594 South Dakota -- Page 17
  • 18. South Dakota's International and Domestic Ports-to-Plains Region Trading Relationships Rail Truck Change Change Rail Truck Domestic -- 2002- 2002- 2002 Domestic -- 2007 Change Change 2015 2015 2015 Exports Rail Truck Exports Rail Truck Exports Rail Truck Colorado 0 137 9% Colorado 3 249 8% 0% 82% Colorado 3 254 6% 86% Montana 0 108 7% Montana 17 191 7% 77% Montana 21 161 4% 49% Nebraska 0 409 27% Nebraska 1 843 27% 106% Nebraska 1 1,451 35% 255% New Mexico 0 27 2% New Mexico 4 26 1% -4% New Mexico 4 26 1% -3% Oklahoma 0 55 4% Oklahoma 2 128 4% 133% Oklahoma 2 1,083 26% 1869% North Dakota 1 199 13% North Dakota 0 645 21% -100% 224% North Dakota - 135 3% -100% -32% South Dakota South Dakota South Dakota Texas 0 452 30% Texas 145 476 20% 5% Texas 155 454 15% 1% Wyoming 0 122 8% Wyoming 0 372 12% 205% Wyoming - 382 9% 213% Total ($m) 1 1,509 Total ($m) 173 2,930 100% 17187% 94% Total ($m) 186 3,946 100% 18473% 161% 1,510 3,103 105% 4,132 174% Imports Rail Truck Imports Rail Truck Imports Rail Truck Colorado 0 187 10% Colorado 227 7% 21% Colorado - 261 4% 39% Montana 40 146 10% Montana 4 114 4% -90% -22% Montana 2 164 3% -94% 12% Nebraska 0 720 40% Nebraska 1,783 54% 148% Nebraska - 2,338 38% 225% New Mexico 0 0 0% New Mexico 0% New Mexico - 2 0% North Dakota 0 513 28% North Dakota 745 22% 45% Oklahoma 12 1,791 30% 249% Oklahoma 0 26 1% Oklahoma 86 3% 231% North Dakota - 104 2% 299% South Dakota South Dakota South Dakota 0 Texas 0 106 6% Texas 0% -100% Texas 116 970 18% 815% Wyoming 0 64 4% Wyoming 22 335 11% 423% Wyoming 26 297 5% 364% Total ($m) 40 1,762 Total ($m) 26 3,290 100% -35% 87% Total ($m) 156 5,926 100% 291% 236% 1,802 3,316 84% 6,083 238% TOTAL Rail Truck TOTALS Rail Truck TOTALS Rail Truck Colorado 0 324 10% Colorado 3 476 7% 47% Colorado 3 515 5% 59% Montana 40 254 9% Montana 21 305 5% -48% 20% Montana 23 324 3% -42% 28% Nebraska 0 1,129 34% Nebraska 1 2,626 41% 133% Nebraska 1 3,789 37% 236% New Mexico 0 27 1% New Mexico 4 26 0% -4% New Mexico 4 28 0% 4% North Dakota 0 568 17% North Dakota 2 873 14% 54% North Dakota 14 2,874 28% 406% Oklahoma 1 225 7% Oklahoma 0 731 11% -100% 225% Oklahoma - 238 2% -100% 6% South Dakota South Dakota South Dakota 0 Texas 0 558 17% Texas 145 476 10% -15% South Dakota 271 1,425 17% 155% Wyoming 0 186 6% Wyoming 22 707 11% 280% Texas 26 679 7% 265% Total ($m) 41 3,271 Total ($m) 199 6,220 100% 385% 90% Total ($m) 342 9,872 100% -142% 202% 3,312 6,419 94% 10,214 208% South Dakota -- Page 18