June 2010 Philadelphia County Basic Supply and Demand
•
0 gefällt mir•87 views


Empfohlen
Empfohlen
Weitere ähnliche Inhalte
Was ist angesagt?
Was ist angesagt? (17)
Ähnlich wie June 2010 Philadelphia County Basic Supply and Demand
Ähnlich wie June 2010 Philadelphia County Basic Supply and Demand (18)
Mehr von Prudential Fox & Roach, Realtors
Mehr von Prudential Fox & Roach, Realtors (20)
Kürzlich hochgeladen
Kürzlich hochgeladen (20)
June 2010 Philadelphia County Basic Supply and Demand
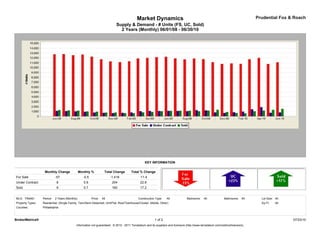
- 1. Market Dynamics Prudential Fox & Roach Supply & Demand - # Units (FS, UC, Sold) 2 Years (Monthly) 06/01/08 - 06/30/10 KEY INFORMATION Monthly Change Monthly % Total Change Total % Change For Sale -57 -0.5 -1,416 -11.4 Under Contract 8 0.9 204 22.8 Sold 6 0.7 160 17.2 MLS: TReND Period: 2 Years (Monthly) Price: All Construction Type: All Bedrooms: All Bathrooms: All Lot Size: All Property Types: Residential: (Single Family, Twin/Semi-Detached, Unit/Flat, Row/Townhouse/Cluster, Mobile, Other) Sq Ft: All Counties: Philadelphia BrokerMetrics® 1 of 2 07/23/10 Information not guaranteed. © 2010 - 2011 Terradatum and its suppliers and licensors (http://www.terradatum.com/metrics/licensors).
- 2. Market Dynamics Prudential Fox & Roach Supply & Demand - # Units (FS, UC, Sold) 2 Years (Monthly) 06/01/08 - 06/30/10 FOR SALE UNDER CONTRACT SOLD EXPIRED NEW LISTINGS Time Period # Properties Average DOM # Properties Average DOM # Properties Average DOM # Properties Average DOM # Properties Jun-10 11,101 146 801 68 1,523 73 1,453 194 2,130 May-10 10,741 167 731 81 1,331 67 1,039 172 1,887 Apr-10 12,005 172 1,878 69 1,163 80 1,273 196 2,976 Mar-10 11,722 189 1,448 74 1,030 78 1,245 191 2,849 Feb-10 10,761 210 972 80 626 81 916 197 1,778 Jan-10 10,861 218 836 80 669 73 1,042 192 2,334 Dec-09 10,752 233 703 73 875 73 1,522 199 1,350 Nov-09 11,125 232 804 71 1,338 75 919 182 1,688 Oct-09 11,745 227 1,216 73 1,154 74 1,092 184 2,274 Sep-09 11,869 228 1,262 75 1,035 72 1,136 197 2,324 Aug-09 11,686 233 1,050 77 1,136 75 1,091 187 2,096 Jul-09 11,898 233 1,097 72 1,132 75 1,211 188 2,085 Jun-09 12,228 233 1,116 72 1,117 83 1,299 196 2,392 May-09 12,157 236 1,088 81 1,040 74 1,233 182 2,282 Apr-09 11,993 234 1,099 76 894 81 1,019 178 2,344 Mar-09 11,887 235 1,041 76 804 82 1,197 183 2,348 Feb-09 11,301 242 798 82 629 74 964 180 2,079 Jan-09 11,135 246 723 82 636 80 1,190 183 1,992 Dec-08 11,281 248 648 80 784 75 1,490 186 1,363 Nov-08 11,714 241 719 69 765 71 1,077 155 1,703 Oct-08 12,255 232 774 72 947 63 1,470 152 2,040 Sep-08 12,692 225 930 67 1,006 67 1,547 164 2,642 Aug-08 12,543 220 1,014 71 1,160 69 1,479 152 2,317 Jul-08 12,774 214 1,070 69 1,210 67 1,478 152 2,686 Jun-08 12,745 211 1,120 67 1,276 66 1,537 156 2,604 BrokerMetrics® 2 of 2 07/23/10 Information not guaranteed. © 2010 - 2011 Terradatum and its suppliers and licensors (http://www.terradatum.com/metrics/licensors).