2. 57 GROWTH PYRAMIDS ON Si 111 FACETS: A CVD . . . 7253
any indication of facet formation. Obviously the initial sur-
face irregularities on the substrate are too large to be over-
come by the MBE growth mechanisms. This problem is
solved by performing the MBE growth on top of a CVD
grown layer. The pronounced changes in the morphology of
the pyramids due to the overgrowth of the 2.9- m-thick
MBE layer is shown in Sec. V. In the next section computer
simulations of the MBE growth process are used to relate the
influence of specific growth parameters to the experimentally
observed morphology.
II. EXPERIMENTS
Monocrystalline hemispherical Si substrates with a 5-mm
radius have been produced by grinding and polishing. Sub-
sequently, the top layer was removed by isotropic etching
with a 1:8 solution of HF 40% and HNO3 65% .10 In this
manner the defect density at the surface of the hemisphere is
reduced.
With CVD, a 10- m-thick epitaxial layer is grown on the
hemisphere. Growth is performed with SiH2Cl2 in H2 at a
pressure of 150 Torr and a temperature of 975 °C; the growth
rate is 0.2 m/min. On one of the substrates an MBE layer is
grown on top of the CVD layer. This layer, which has a
thickness of 2.9 m on the 111 facet, is deposited at a rate
of 0.6 m/h at 900 °C.
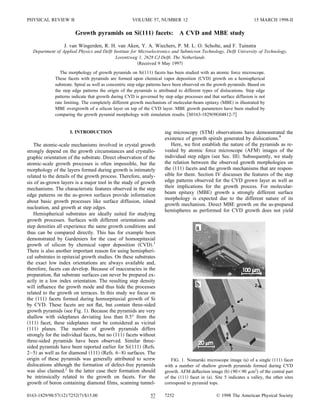
The details of the surface structures on the 111 facet FIG. 2. AFM deflection images of growth pyramid tops showing
resulting from CVD and the effects of subsequent over- a the step edge spiral on pyramid top 1 and b the concentric
growth with MBE have been studied with AFM. Two AFM triangular step pattern on pyramid top 2. The regions a and b ex-
image types have been used. The height images are used to hibit concave and convex step edge structures, respectively. Note
that the images are rotated with respect to Fig. 1 b . Image sizes:
measure the slopes and height differences. We also use de-
a 2 2 m2, b 4 4 m2.
flection images, which represent the error signal in the feed-
back loop of the constant force mode. The error signal is plane, which is 1/3 111 because the cubic unit cell of the
proportional to changes in the height of the surface, i.e., it diamond lattice contains three elementary double layer dis-
represents the derivative of the surface height profile. This tances in the 111 direction. Thus, the Burgers vector of the
deflection signal is better suited for illustrating the shallow dislocation generating the growth pyramid in Fig. 2 a has a
features like step edges. Both types of images are measured component along 111 equal to 1/3 111 . Burgers vectors
with the tip in contact with the sample, in a constant force of perfect dislocations in the diamond lattice have to be the
mode. shortest translation vector of the lattice, i.e., 1/2 110 .11 This
Burgers vector’s component along 111 is indeed 1/3 111 .
III. ORIGIN OF THE GROWTH PYRAMIDS The exact nature of the dislocation i.e., whether it is of the
screw type, edge type, or mixed type cannot be determined,
As shown in the large scan area image in Fig. 1 b we since the direction of the dislocation line inside the crystal
have been able to locate the center part of the facet on the cannot be deduced from observations of the surface of the
hemisphere under the AFM. Even though the surface is cov- facet only.
ered by a thin native oxide layer, small scan area AFM im- We also observed growth pyramids with a step edge
ages reveal individual step edges. These step edge structures structure different from that of pyramid 1. Figure 2 b dem-
directly demonstrate the nature of the growth pyramids as onstrates the observation of a concentric triangular step edge
shown in Fig. 2 a for the pyramid top indicated as number 1 structure at the top of pyramid 2. The concentric step edge
in Fig. 1 b . The step edge spiral on this pyramid clearly structure indicates that if the pyramid contains one or more
demonstrates the presence of a dislocation, ending exactly at dislocations, the net Burgers vector does not have a compo-
the top of the pyramid. The Burgers vector of this dislocation nent perpendicular to the 111 terrace. As proposed
is not necessarily perpendicular to the surface. It is sufficient earlier,12–15 dislocations with a Burgers vector parallel to the
to have a component perpendicular to the surface terraces. surface also generate growth steps. The mechanism for gen-
This will result in a step edge with a step height equal to this erating these steps is related to the dissociation of the dislo-
perpendicular component. The height of the step edges on cation in two partial dislocations13–15 e.g., 1/2 110 ¯
the side planes of the growth pyramids is determined using →1/6 21 ¯1 1/6 12 1 . The resulting partial dislocations
the vicinal angle measured from the height image and the have Burgers vector components, which are perpendicular to
step density measured from the corresponding deflection im- the 111 terrace. These perpendicular components have op-
age. A step height of 0.31 / 0.04 nm was measured for all posite signs. Due to the energy involved in the creation of
side planes of the different pyramids. This is in very good the stacking fault in between the partial dislocations, their
agreement with the elementary step height on the Si 111 separation is limited. A splitting at the surface of the order of
3. 7254 J. van WINGERDEN et al. 57
FIG. 4. AFM deflection image of the step edge pattern at the
valley in site 5. Image size: 3 3 m2.
the two pyramid tops and the different structures at the two
tops, this cannot be a widely dissociated single dislocation
¯
with Burgers vector 1/2 110 . It should have a more com-
plex dislocation source, the exact nature of which cannot be
determined from its appearance at the surface. A macro-
scopically similar structure is formed by the tops 6 and 7 in
Fig. 1 b . A microscopic image of its step structure could not
be obtained due to the mechanical damage of the surface
near these tops.
FIG. 3. AFM deflection images of the step edge patterns at
pyramid top 3 in a and top 4 in b . The images are rotated over IV. CVD GROWTH FEATURES
a small angle with respect to Fig. 2. In b an extra step edge,
indicated with a bright dot, emerges at the end of the defect line, the Growth from SiH2Cl2 involves diffusion through the gas
vertical position of which is indicated with an arrow. At the left- phase, adsorption on the terrace, diffusion over the terraces
hand side of the step edge emergence point, the defect line visibly to step edges and, finally, the attachment of new growth units
disturbs the surface structure. To the right, in the region of the to these step edges. During these processes the molecule dis-
arrow, no disturbance of the step edges is observed. Image sizes: a sociates in a number of reaction steps, finally leaving a single
5 5 m2, b 2 2 m2. Si atom attached as the growth unit.
Under standard CVD conditions the diffusion length of
100 nm has been observed.15 The sharp point in the middle the adsorbed species is much larger than the terrace length.16
of the pyramid’s top terrace in Fig. 2 b indicates the pres- This fact is nicely demonstrated by the sharp corners in the
ence of such a pair of partial dislocations. An upper limit for step edges at the intersections of the pyramid’s side planes
its size, which has been determined from larger magnifica- see, e.g., Fig. 2 . Diffusion limitations would have caused
tion images, indicates a splitting of the two partials of at these corners to be heavily rounded off. The sharp corners
most 50 nm. Further details of the formation of steps at this also indicate that the growth rate strongly depends on the
dislocation center cannot be obtained due to the presence of orientation of the step edge. No significantly different growth
the native oxide on the surface and the small separation of rate is observed for concave and convex cusps in the step
the two partial dislocations. edge. This is especially evident for the two types of corners
A third type of step edge structure is observed on the indicated with a and b in Fig. 2 b . Similarly, step edges in
double pyramid, the tops of which are indicated as 3 and 4 in the valley, shown in Fig. 4, also exhibit sharp corners. Thus,
Fig. 1 b . Two side planes of pyramid 3 have an equidistant the step edge energy is so highly anisotropic that even reen-
pattern of straight step edges see Fig. 3 a . The remaining trant corners remain sharp, in spite of their higher sticking
part exhibits an irregular step edge pattern, but it does not probability.
contain an obvious step edge source. The step edges of this Another interesting feature is the narrow terrace width
pyramid seem to form concentric loops. However, a straight distribution, yielding a regular step edge pattern with terrace
defect line starting at the center of the pyramid is disturbing widths of about 45 nm on all side planes of the pyramids.
the terraces and the step edges. This line is about 6.5 m Therefore, the activity of the step edge sources, having dif-
long and connects the pyramid tops 3 and 4. The defect ferent dislocation stuctures, should be quite similar for all
causing the straight line at the surface is determined by the pyramids. The slightly larger terrace immediately at the top
¯
crystal structure, as it is aligned along 110 . The step edge of the pyramid or at the bottom of a valley does not seem to
structure at the other end of the defect line on pyramid top 4 cause a substantial disturbance of the terrace widths in its
is shown in Fig. 3 b . Here, we observe the generation of an neighborhood. The transition area between the side planes of
additional step edge by a dislocation emerging at the surface. the two pyramid tops 3 and 4 exhibits much larger terraces,
Furthermore, the step edges are not continuous at the defect exceeding a width of 100 nm. As Fig. 3 b shows, the tran-
line. Because of the length of the defect line interconnecting sition between the regions with low and high step densities is
4. 57 GROWTH PYRAMIDS ON Si 111 FACETS: A CVD . . . 7255
layer is the rippled structure on the side planes of the growth
pyramids. A third difference is observed at the intersection of
the side planes. After CVD this intersection is even on the
atomic scale sharply visible see Figs. 2 a,b . During MBE
the intersection has broadened strongly, so that it appears as
a broad band in the Nomarski microscope image. The broad-
ening is induced by diffusion effects. This diffusion effect
also causes the corners of the small facets on top of the
pyramids to be rounded off. Finally, MBE overgrowth did
not yield a measurable increase in the size of the original
111 facet. On the other hand, we observed in another ex-
periment that deposition of a 5- m CVD layer on top of a
10- m CVD layer increases the facet size with about 80%.
This is consistent with the orientation independence of MBE
growth in comparison with CVD growth.16
AFM measurements on the 111 facet shown in Fig. 5 a
have been used to characterize the structures quantitatively.
Fig. 5 b shows a height image of the smaller of the two
faces on top of the growth pyramids together with part of the
larger one. The white spots in the image are caused by con-
tamination on the surface and are not due to the growth pro-
cess. The top facets are very flat with a vicinal angle smaller
than 0.05°. This means that the top faces are exact 111
FIG. 5. Nomarski microscope image a of a 111 facet after terraces or contain only a low density of step edges. No
overgrowth with MBE. AFM height image b of the smaller of the step edges have been observed on the top faces, but detecting
two facets on top of the growth pyramids in a . The small white them is difficult due to the large surface area and the pres-
spots are due to contamination on the surface. Image size: ence of contamination. Figure 6 a shows a deflection image
40 40 m2. of part of the top face with the rippled structure on the pyra-
mid’s side plane. Figure 6 b shows a cross section along the
abrupt, but without the formation of a step bunch. The form line A-B in Fig. 6 a . The height profile clearly shows the
of this transition indicates that the growth rate at the step presence of a high step bunch at the edge of the small 111
edges is not limited by the amount of growth species ab- facet on top of the pyramid. The ripples on the side plane are
sorbed on the terraces adjacent to the step edge. This indi- formed by smaller step bunches. They seem to be larger
cates a very large supersaturation on the terraces and/or sub- close to the edge of the top face see Fig. 6 b . The first step
stantial diffusion across the step edges. bunch next to the edge of the top face generally has a height
that is about 25–30% of the bunch forming the edge. Figure
V. MBE GROWTH FEATURES
6 c gives a detailed height profile of the edge of the larger of
the two top faces in Fig. 5 a . It shows that the lateral width
MBE growth on top of the CVD layers leads to changes of the step bunch is about 0.5 m. A height difference of
in the surface morphology. Here, we again focus on the ef- about 30 nm on a lateral width of 0.5 m yields an average
fects observed for the 111 orientation. The most pro- terrace width of 5 nm for the terraces in the step bunch. Thus
nounced feature observed after MBE growth on top of the the step bunch can still be considered as a 111 face with a
CVD layer is the formation of a small flat facet on top of the large vicinal angle. The ratio between the diameter of the top
growth pyramids. This is demonstrated in the Nomarski mi- face and the height of the step bunch at its edge is approxi-
croscope photo in Fig. 5 a , which shows a 111 facet with mately 1000 for both the small and the large top facets. At
two growth pyramids. A second important difference be- the corners of the top facets a smaller step height is mea-
tween the morphology of the MBE top layer and the CVD sured. At these places the height of the bunch is reduced
FIG. 6. a AFM deflection image (20 20 m2) of part of the smaller facet and the step bunch pattern on the side plane. b Cross
section showing average height profile of a 2- m-wide area along the line A-B indicated in a . c Height profile of the step bunch at the
edge of the larger facet on the growth pyramid top in Fig. 5 a .
5. 7256 J. van WINGERDEN et al. 57
FIG. 8. Typical simulation result showing the cross section of
one of the three pyramid side planes. A top face with a low density
of steps, a step bunch, and a sideplane can be distinguished. The
length of the top face, L, and the corresponding height of the step
bunch at its edge, H, are used to characterize the structure.
FIG. 7. Schematic top view a and cross section of one side
plane b of the growth pyramid. The Schwoebel parameter, a,
models the effect of the asymmetric sticking probability, as drawn
in c . Overhangs created during the simulation are removed in the dA i
C 1 a Ai Ai 1 a Ai 1 Ai , 1
manner shown in d . dt
where the area A i and the effective Schwoebel parameter a
are defined in Figs. 7 a , and 7 c , respectively. The propor-
because the steps in the lower part of the bunch have split tionality constant C represents the growth rate. The position
off. of the step edge, x i , can be calculated from the correspond-
Several of the above mentioned features will be used in ing areas A i using
the next section for comparison with results of numerical
simulations. Ai
xi . 2
)
VI. MBE GROWTH MODEL
The time evolution of A i according to Eq. 1 may lead to
The influence of two important growth parameters on the overhangs, which is physically incorrect. In these cases the
form of the growth pyramid after MBE growth has been step edge positions are corrected by redistributing the over-
simulated using a continuum model. One parameter deter- hang volume over the step edges below it in the manner
mines the rate at which new terraces nucleate on the upper shown in Fig. 7 d .
terrace of the growth pyramid. Due to the high elastic strain Part of the material deposited on the upper terrace is not
near the dislocation core, the probability for sticking adatoms incorporated in a step edge, but is accumulated on that ter-
to step edges is smaller near the core than far away from it. race. For simplicity we assume the fraction of deposited ma-
This determines the rate at which new layers are formed. In terial that is accumulated on the top terrace to be equal to the
the simulation this has been modeled by creating new ter- Schwoebel parameter a. A new terrace is generated on top of
races on top of the pyramid after a minimum number of the growth pyramid if the accumulated amount of growth
growth units has accumulated on the upper terrace. The other units on the upper terrace exceeds a critical surface area A c .
growth parameter determining the morphology of the growth The initial structure used in the simulations has equal ter-
pyramid is the so-called Schwoebel parameter.17 This param- race widths T. The influence of an upper terrace with an
eter describes the asymmetric sticking probability for growth initially larger size has been neglected as its influence gradu-
units arriving at step edges from the upper and the lower ally fades away during the evolution of the structure. In most
terrace, respectively. It determines how fluctuations in the cases a relatively flat top face, bordered by a step bunch,
step edge positions propagate along the step edge train. Pref- develops during the simulation see Fig. 8 . Characteristic
erential attachment from the upper terrace leads to an insta- features like the size of the top face, L, and the height of the
bility causing step bunching. On the other hand, preferential step bunch, H, are used for comparing the simulation results
sticking from the lower terrace stabilizes an equidistant step to the measured form of the growth pyramid. In the simula-
pattern. Nucleation of islands on the terraces also gives the tions, we found a constant ratio H/L. This ratio is deter-
effect of increasing the incorporation of material from the mined by the geometry of the pyramid, according to
lower terrace. This contribution can be included in an effec-
tive Schwoebel parameter. It shows that growth by island
1
nucleation leads to a stabilization of an equidistant step edge H/L 3 tan , 3
pattern.9
Simulations have been performed, starting from the struc- where is the vicinal angle of the pyramid’s side plane. In
ture indicated schematically in Figs. 7 a,b . The evolution of the results presented hereafter, we have simulated the growth
the atomic layer areas on one of the three pyramid sides is of a layer with total thickness equal to that grown in the
calculated from: MBE experiment i.e., 9200 layers with a thickness of 0.31
6. 57 GROWTH PYRAMIDS ON Si 111 FACETS: A CVD . . . 7257
FIG. 11. Simulated sideplane cross sections with A c 35 m2
a and A c 0.35 m2 b for the same value of the Schwoebel
parameter, a 0.45.
FIG. 9. Sideplane cross sections from simulations with different
Schwoebel parameters, a: a 0.40 in a , a 0.45 in b , and a
0.50 in c , respectively. The critical surface area A c 35 m2.
a factor 10. The corresponding slope of the top surface is
now 0.05°, which is the experimentally determined upper
limit for this slope.
nm . All results scale linearly with the initial terrace size, T. The dependence of the top surface slope on the critical
Numerical results, e.g., for the size of the top face, have been surface coverage suggests that we can determine a lower
calculated with T 45 nm. limit for the critical surface coverage needed for terrace
The Schwoebel parameter, a, has the most pronounced nucleation. However, for a 0.45, A c amounts to 27% of the
influence on the form of the growth pyramid, as demon- upper terrace area upon nucleation of the new terrace. A
strated by the simulation results in Fig. 9. Higher values of much smaller critical surface area would be expected. Fur-
the Schwoebel parameter result in a decrease in the size of thermore, the surface coverage required for the nucleation
the top face and a smaller magnitude of the ripples on the does not change with the reduction of A c by the factor 100.
sideplane. A Schwoebel parameter of 0.40 results in a rough This paradoxical result can be understood by realizing that in
sideplane, while the irregularities on the sideplane are al- the simulation model A c is a terrace size independent value,
ready fairly small for a 0.50. For Schwoebel parameter which just determines when a new terrace is generated. Re-
values above 0.50, the ripples on the sideplane rapidly van- ducing A c yields a higher terrace generation rate and thus a
ish, as demonstrated by the simulation results for a 0.50 larger slope on the pyramid’s top face. The surface coverage
and a 0.55 in Fig. 10. These results are in accordance with upon nucleation changes with the value of the Schwoebel
the expected stabilization of an equidistant step edge pattern parameter from 23% at a 0.40 to 31% at a 0.50 , but
in case of preferential sticking from the lower terrace. Not remains very high. For obtaining more realistic surface cov-
only the sideplane itself, but also the transition to the side- erages, the model should also account for the effects of the
plane at the bottom of the step bunch becomes smooth for lack of an alternative nucleation site during accumulation of
a 0.50 and above. The flat top face does not vanish for a growth species on the top terrace. It results in an increased
0.5, as the barrier for nucleating a new island modeled by probability for incorporation of growth species at the step
the critical surface area A c yields an increased contribution edges of the top terrace. A smaller effective Schwoebel pa-
from the upper terrace to the first step edge. rameter a on the top surface can be used to model this effect.
Based on the experimentally observed sideplane morphol- By causing a slower accumulation of growth species on the
ogy, the Schwoebel parameter is estimated to fall in the upper terrace it will yield a smaller actual surface coverage
range 0.40–0.50 for the MBE growth conditions used in the during nucleation of new terraces.
experiment. For this parameter range the length of the top
face, L, varies from 35 to 17 m, which is the same order of
VII. CONCLUSIONS
magnitude as the experimentally observed size. It should be
noted, however, that the length of the top face not only de- The work presented in the previous chapters leads to a
pends on the Schwoebel parameter, but also on the critical number of conclusions. First of all, we have given direct
surface area A c . For the simulation results mentioned above, experimental evidence that the formation of growth pyramids
a critical surface area A c 35 m2 has been used. Decreas- on the 111 facet is due to the presence of dislocations.
ing the value of A c yields smaller top surfaces with a higher These dislocations can yield spiral as well as concentric step
slope. This is evidenced, for example, by the simulation re- edge patterns, depending on the orientation of the disloca-
sult shown in Fig. 11 b , which has been obtained with a 100 tion’s Burgers vector. Secondly, the step edge morphology
times smaller value of A c . The size of the top face is reduced of the CVD grown layers clearly shows that diffusion of the
with a factor 3.6 and the terrace length on the top face with growth species over the terrace does not limit the growth
rate. For the CVD experiments described here, the morphol-
ogy of the observed structures is completely determined by
the dependence of the growth rate on the step edge orienta-
tion. The surface structures studied in this paper may serve
as a useful template for investigating the importance of sur-
face diffusion for other growth conditions. This has been
demonstrated in Sec. IV, which describes how MBE over-
FIG. 10. Simulated sideplane cross sections with A c 35 m2 growth affects the surface morphology. The results confirm
shown at a larger scale for a 0.50 a and a 0.55 b . the strong influence of surface diffusion during MBE growth.
7. 7258 J. van WINGERDEN et al. 57
Finally, we have deduced that adatoms approaching a step ACKNOWLEDGMENTS
edge from the upper terrace have a slightly larger probability
of sticking to that step edge than adatoms approaching from The authors would like to thank I. Nieuwlaat for making
the lower terrace. This conclusion has been obtained by com- the hemispheres, A. van den Bogaard and E. J. G. Goudena
paring the morphology of the MBE layer on the pyramid’s for performing the CVD growth, and B. G. M. de Lange and
side planes with simulation results. K. Werner for the MBE growth.
1
J. G. E. Gardeniers, Ph.D. thesis, University of Nijmegen, 1990. Thundat, C. S. Feigerle, and K. Wandelt, Phys. Rev. B 51,
2 14 554 1995 .
J. Nishizawa, T. Terasaki, and M. Shimbo, J. Cryst. Growth 17,
10
241 1972 . B. Schwartz and H. Robbins, J. Electrochem. Soc. 123, 1903
3
M. Shimbo, J. Nishizawa, and T. Terasaki, J. Cryst. Growth 23, 1976 .
11
267 1974 . H. G. van Bueren, Imperfections in Crystals North-Holland, Am-
4 ¨ sterdam, 1961 .
D. Kass, and H. Strunk, Thin Solid Films 81, L101 1981 . 12
5 H. Bethge, Phys. Status Solidi 2, 775 1962 .
J. G. E. Gardeniers, W. E. J. R. Maas, R. Z. C. van Meerten, and 13
E. Bauser and H. Strunk, J. Cryst. Growth 51, 362 1981 .
L. J. Giling, J. Cryst. Growth 96, 821 1989 . 14
E. Bauser and H. Strunk, Thin Solid Films 93, 185 1982 .
6
I. Sunagawa, K. Tsukamoto, and I. Yashuda, in Materials Science 15
E. Bauser and H. Strunk, J. Cryst. Growth 69, 561 1984 .
of the Earth’s Interior, edited by I. Sunagawa Terra, Tokyo, 16
F. Allen and E. Kasper, in Silicon-Molecular Beam Epitaxy, ed-
1984 , p. 331. ited by E. Kasper and J. C. Bean CRC Press, Boca Raton,
7
W. J. P. van Enckevort, J. Cryst. Growth 119, 177 1992 . Florida, 1988 , Vol. 1.
8 17
J. J. Schermer and L. J. Giling, J. Appl. Phys. 78, 2376 1995 . R. L. Schwoebel and E. J. Shipsey, J. Appl. Phys. 37, 3682
9
T. J. Kreutz, R. E. Clausing, L. Heatherly, R. J. Warmack, T. 1966 .