![The rise of the electricity bill [infographic]](data:image/gif;base64,R0lGODlhAQABAIAAAAAAAP///yH5BAEAAAAALAAAAAABAAEAAAIBRAA7)
Empfohlen
Weitere ähnliche Inhalte
Was ist angesagt?
Was ist angesagt? (20)
Andere mochten auch
Andere mochten auch (12)
Ähnlich wie 2008 Percent Maintenance Cost per year as a percent of Replacement Asset Value
Ähnlich wie 2008 Percent Maintenance Cost per year as a percent of Replacement Asset Value (20)
Kürzlich hochgeladen
Kürzlich hochgeladen (20)
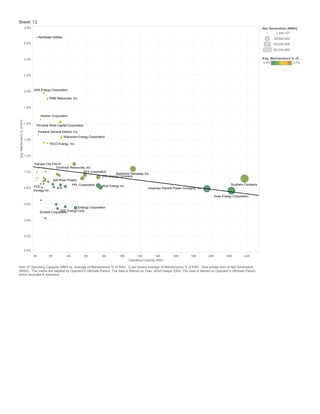
2008 Percent Maintenance Cost per year as a percent of Replacement Asset Value
- 1. Northeast Utilities PNM Resources, Inc. Vectren Corporation Sheet 12 Pinnacle West Capital Corporation Portland General Electric Co. Wisconsin Energy Corporation Kansas City City of Dominion Resources, Inc. Salt River Project JEA AES Corporation Entergy Corporation Berkshire Hathaway Inc. OUC 0K 2K 4K 6K 8K 10K 12K 14K 16K 18K 20K 22K 24K Operating Capacity (MW) 2.8% 2.6% 2.4% 2.2% 2.0% 1.8% 1.6% 1.4% 1.2% 1.0% 0.8% 0.6% 0.4% 0.2% 0.0% Avg. Maintenance % of RAV Xcel Energy Inc. UNS Energy Corporation TECO Energy, Inc. SCANA CorporOaGtioEn Energy Corp. DTE Energy Company Southern Company Duke Energy Corporation American Electric Power Company, Inc. PPL Corporation Dynegy Inc. Net Generation (MWh) 1,445,137 50,000,000 100,000,000 153,334,653 Avg. Maintenance % of .. 0.4% 2.7% Sum of Operating Capacity (MW) vs. average of Maintenance % of RAV. Color shows average of Maintenance % of RAV. Size shows sum of Net Generation (MWh). The marks are labeled by Operator's Ultimate Parent. The data is filtered on Year, which keeps 2008. The view is filtered on Operator's Ultimate Parent, which excludes 6 members.