

Empfohlen
Weitere ähnliche Inhalte
Ähnlich wie panel data simple
Ähnlich wie panel data simple (20)
Mehr von pelangi sepi
Kürzlich hochgeladen
Kürzlich hochgeladen (20)
panel data simple
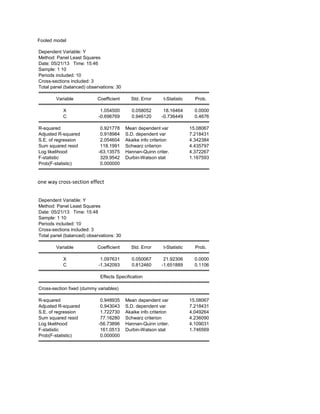
- 1. Fooled model Dependent Variable: Y Method: Panel Least Squares Date: 05/21/13 Time: 15:46 Sample: 1 10 Periods included: 10 Cross-sections included: 3 Total panel (balanced) observations: 30 Variable Coefficient Std. Error t-Statistic Prob. X 1.054500 0.058052 18.16464 0.0000 C -0.696769 0.946120 -0.736449 0.4676 R-squared 0.921778 Mean dependent var 15.08067 Adjusted R-squared 0.918984 S.D. dependent var 7.218431 S.E. of regression 2.054604 Akaike info criterion 4.342384 Sum squared resid 118.1991 Schwarz criterion 4.435797 Log likelihood -63.13575 Hannan-Quinn criter. 4.372267 F-statistic 329.9542 Durbin-Watson stat 1.167593 Prob(F-statistic) 0.000000 one way cross-section effect Dependent Variable: Y Method: Panel Least Squares Date: 05/21/13 Time: 15:48 Sample: 1 10 Periods included: 10 Cross-sections included: 3 Total panel (balanced) observations: 30 Variable Coefficient Std. Error t-Statistic Prob. X 1.097631 0.050067 21.92306 0.0000 C -1.342093 0.812460 -1.651889 0.1106 Effects Specification Cross-section fixed (dummy variables) R-squared 0.948935 Mean dependent var 15.08067 Adjusted R-squared 0.943043 S.D. dependent var 7.218431 S.E. of regression 1.722730 Akaike info criterion 4.049264 Sum squared resid 77.16280 Schwarz criterion 4.236090 Log likelihood -56.73896 Hannan-Quinn criter. 4.109031 F-statistic 161.0513 Durbin-Watson stat 1.746569 Prob(F-statistic) 0.000000
- 2. nilai a F Effect 1 1 -0.106136 2 2 -1.416584 3 3 1.522720 setiap nilai kena plus dgn c (-1.342093) di atas. Redundant fix effect Redundant Fixed Effects Tests Equation: Untitled Test cross-section fixed effects Effects Test Statistic d.f. Prob. Cross-section F 6.913593 (2,26) 0.0039 Cross-section Chi-square 12.793596 2 0.0017 Cross-section fixed effects test equation: Dependent Variable: Y Method: Panel Least Squares Date: 05/21/13 Time: 15:54 Sample: 1 10 Periods included: 10 Cross-sections included: 3 Total panel (balanced) observations: 30 Variable Coefficient Std. Error t-Statistic Prob. X 1.054500 0.058052 18.16464 0.0000 C -0.696769 0.946120 -0.736449 0.4676 R-squared 0.921778 Mean dependent var 15.08067 Adjusted R-squared 0.918984 S.D. dependent var 7.218431 S.E. of regression 2.054604 Akaike info criterion 4.342384 Sum squared resid 118.1991 Schwarz criterion 4.435797 Log likelihood -63.13575 Hannan-Quinn criter. 4.372267 F-statistic 329.9542 Durbin-Watson stat 1.167593 Prob(F-statistic) 0.000000 ho: fooled h1 : fixed.
- 3. Random model Dependent Variable: Y Method: Panel EGLS (Cross-section random effects) Date: 05/21/13 Time: 15:56 Sample: 1 10 Periods included: 10 Cross-sections included: 3 Total panel (balanced) observations: 30 Swamy and Arora estimator of component variances Variable Coefficient Std. Error t-Statistic Prob. X 1.054500 0.048675 21.66395 0.0000 C -0.696769 0.793297 -0.878321 0.3872 Effects Specification S.D. Rho Cross-section random 0.000000 0.0000 Idiosyncratic random 1.722730 1.0000 Weighted Statistics R-squared 0.921778 Mean dependent var 15.08067 Adjusted R-squared 0.918984 S.D. dependent var 7.218431 S.E. of regression 2.054604 Sum squared resid 118.1991 F-statistic 329.9542 Durbin-Watson stat 1.167593 Prob(F-statistic) 0.000000 Unweighted Statistics R-squared 0.921778 Mean dependent var 15.08067 Sum squared resid 118.1991 Durbin-Watson stat 1.167593
- 4. Ramdom Correlated Random Effects - Hausman Test Equation: Untitled Test cross-section random effects Test Summary Chi-Sq. Statistic Chi-Sq. d.f. Prob. Cross-section random 13.533505 1 0.0002 ** WARNING: estimated cross-section random effects variance is zero. Cross-section random effects test comparisons: Variable Fixed Random Var(Diff.) Prob. X 1.097631 1.054500 0.000137 0.0002 Cross-section random effects test equation: Dependent Variable: Y Method: Panel Least Squares Date: 05/21/13 Time: 15:57 Sample: 1 10 Periods included: 10 Cross-sections included: 3 Total panel (balanced) observations: 30 Variable Coefficient Std. Error t-Statistic Prob. C -1.342093 0.812460 -1.651889 0.1106 X 1.097631 0.050067 21.92306 0.0000 Effects Specification Cross-section fixed (dummy variables) R-squared 0.948935 Mean dependent var 15.08067 Adjusted R-squared 0.943043 S.D. dependent var 7.218431 S.E. of regression 1.722730 Akaike info criterion 4.049264 Sum squared resid 77.16280 Schwarz criterion 4.236090 Log likelihood -56.73896 Hannan-Quinn criter. 4.109031 F-statistic 161.0513 Durbin-Watson stat 1.746569 Prob(F-statistic) 0.000000 ho; ramdom h1=fix
- 5. 2 way fix effect Dependent Variable: Y Method: Panel Least Squares Date: 05/21/13 Time: 15:59 Sample: 1 10 Periods included: 10 Cross-sections included: 3 Total panel (balanced) observations: 30 Variable Coefficient Std. Error t-Statistic Prob. X 1.102964 0.067653 16.30331 0.0000 C -1.421886 1.059375 -1.342192 0.1972 Effects Specification Cross-section fixed (dummy variables) Period fixed (dummy variables) R-squared 0.967030 Mean dependent var 15.08067 Adjusted R-squared 0.943758 S.D. dependent var 7.218431 S.E. of regression 1.711887 Akaike info criterion 4.211752 Sum squared resid 49.81945 Schwarz criterion 4.818937 Log likelihood -50.17628 Hannan-Quinn criter. 4.405996 F-statistic 41.55205 Durbin-Watson stat 2.171093 Prob(F-statistic) 0.000000 F Effect 1 1 -0.108456 2 2 -1.425101 3 3 1.533557 plus c DATEID Effect 1 1 -0.749683 2 2 0.412401 3 3 0.765634 4 4 -0.645861 5 5 -1.103800 6 6 -1.459027 7 7 -0.515258 8 8 1.292018 9 9 0.776905 10 10 1.226672
- 6. redundant fix effect Redundant Fixed Effects Tests Equation: Untitled Test cross-section and period fixed effects Effects Test Statistic d.f. Prob. Cross-section F 6.785701 (2,17) 0.0068 Cross-section Chi-square 17.605550 2 0.0002 Period F 1.036715 (9,17) 0.4518 Period Chi-square 13.125362 9 0.1570 Cross-Section/Period F 2.121213 (11,17) 0.0793 Cross-Section/Period Chi-square 25.918958 11 0.0067 Cross-section fixed effects test equation: Dependent Variable: Y Method: Panel Least Squares Date: 05/21/13 Time: 16:02 Sample: 1 10 Periods included: 10 Cross-sections included: 3 Total panel (balanced) observations: 30 Variable Coefficient Std. Error t-Statistic Prob. X 1.026245 0.081553 12.58380 0.0000 C -0.274009 1.282985 -0.213572 0.8332 Effects Specification Period fixed (dummy variables) R-squared 0.940710 Mean dependent var 15.08067 Adjusted R-squared 0.909505 S.D. dependent var 7.218431 S.E. of regression 2.171480 Akaike info criterion 4.665270 Sum squared resid 89.59119 Schwarz criterion 5.179042 Log likelihood -58.97905 Hannan-Quinn criter. 4.829630 F-statistic 30.14586 Durbin-Watson stat 1.330127 Prob(F-statistic) 0.000000
- 7. Period fixed effects test equation: Dependent Variable: Y Method: Panel Least Squares Date: 05/21/13 Time: 16:02 Sample: 1 10 Periods included: 10 Cross-sections included: 3 Total panel (balanced) observations: 30 Variable Coefficient Std. Error t-Statistic Prob. X 1.097631 0.050067 21.92306 0.0000 C -1.342093 0.812460 -1.651889 0.1106 Effects Specification Cross-section fixed (dummy variables) R-squared 0.948935 Mean dependent var 15.08067 Adjusted R-squared 0.943043 S.D. dependent var 7.218431 S.E. of regression 1.722730 Akaike info criterion 4.049264 Sum squared resid 77.16280 Schwarz criterion 4.236090 Log likelihood -56.73896 Hannan-Quinn criter. 4.109031 F-statistic 161.0513 Durbin-Watson stat 1.746569 Prob(F-statistic) 0.000000 Cross-section and period fixed effects test equation: Dependent Variable: Y Method: Panel Least Squares Date: 05/21/13 Time: 16:02 Sample: 1 10 Periods included: 10 Cross-sections included: 3 Total panel (balanced) observations: 30 Variable Coefficient Std. Error t-Statistic Prob. X 1.054500 0.058052 18.16464 0.0000 C -0.696769 0.946120 -0.736449 0.4676 R-squared 0.921778 Mean dependent var 15.08067 Adjusted R-squared 0.918984 S.D. dependent var 7.218431 S.E. of regression 2.054604 Akaike info criterion 4.342384 Sum squared resid 118.1991 Schwarz criterion 4.435797 Log likelihood -63.13575 Hannan-Quinn criter. 4.372267 F-statistic 329.9542 Durbin-Watson stat 1.167593 Prob(F-statistic) 0.000000 cross h0: cross important h1; not
- 8. time ho; time is improtant h1: not cross and time