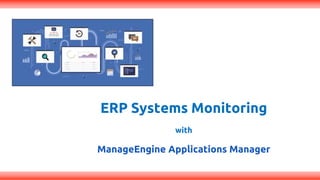
ERP monitoring with Applications Manager
•Als PPTX, PDF herunterladen•
2 gefällt mir•218 views

Explore SAP, Dynamics AX, Dynamics CRM, and Oracle EBS metrics. Drill down to identify pinpoint performance issues and ensure hassle-free performance from your ERP servers.

Empfohlen
Empfohlen
Weitere ähnliche Inhalte
Was ist angesagt?
Was ist angesagt? (20)
Ähnlich wie ERP monitoring with Applications Manager
Ähnlich wie ERP monitoring with Applications Manager (20)
Mehr von ManageEngine, Zoho Corporation
Mehr von ManageEngine, Zoho Corporation (20)
Kürzlich hochgeladen
Kürzlich hochgeladen (20)
ERP monitoring with Applications Manager
- 1. ERP Systems Monitoring with ManageEngine Applications Manager
- 2. Agenda Ensure your ERP solution is free of performance hiccups The right approach to monitoring ERPs Exploring SAP, Oracle EBS, Dynamics CRM, Dynamics AX metrics Make it easy with inbuilt reports and customizable dashboards
- 4. Discovery & mapping Ensure your ERP solution is free of performance hiccups
- 5. Benefits of Monitoring ERPs • Prevention of downtimes (outages) and guarantee service level agreements (SLA) through constant monitoring in real time. • Improve performance of solid ERP, as well as its response time. • Quick identification of problems involving ERP processes, without the need of a professional application allocation for this purpose.
- 6. Benefits of Using Applications Manager for ERP Server monitoring • Multiple vendors in a Single Solution. • Easy deployment in the product and agent-less monitoring. • Quick identification of problems involving ERP processes and customizing alerts to individual requirements.
- 7. Discovery & mapping The right approach to monitoring ERPs
- 8. Prerequisites to add ERP servers • Protocol used: HTTP(S)/Java Connector/WMI • Prerequisites: http://help.appmanager.com/applications-manager- prerequisites
- 9. Represents whether a particular monitor is currently available to undertake requests. Represents the overall state of the monitor. Depends on the severity of all the other attributes. Up Down Availabilit y Clear Warning Critical Health
- 10. Discovery & mapping SAP Server and SAP CCMS
- 11. SAP Server Overview • SAP system information • Buffer Utilization • Spool Utilization • Paging Rate
- 12. SAP Background Process • Background Utilization • Queue Length • Error Information
- 13. SAP Dialog • Request Time • Response Time • Queue Time
- 14. SAP Enqueue • Enqueue Request Information • Dequeue Request Information
- 15. • SAP Alarm information • Detailed Alarm information for identifying errors SAP Alarm
- 16. SAP Jobs • Jobs Run status • Execution Information for better performance
- 17. SAP Server RFC • Queued RFC and Transactional RFC monitoring • Queue RFC classification and Execution information • Transactional RFC with Code and Message
- 18. SAP CCMS • View all attributes in Computing Center Management System • Choose Custom attributes from the monitoring tree elements (MTE) • Alert and archive performance report on specific attributes
- 19. Discovery & mapping Oracle EBS
- 20. Oracle EBS Overview • Request Statistics • Connection Statistics • Virtual Host information (v12.2 only) Supported versions: R11, R12.0, R12.2.0
- 21. EBS Process • Process and Memory Information • This is the only information in EBS v11
- 22. EBS Clusters
- 23. • Server Thread information • Application information EBS Servers and Forms
- 25. Discovery & mapping Microsoft Dynamics
- 26. Dynamics CRM Overview • Authentication failures • Outlook Syncs • CRM Services
- 27. • Server statistics • Request information CRM Server and Requests
- 28. CRM Sandbox • Sandbox CPU and Memory Information • Sandbox execution statistics
- 29. CRM Async Services and Events • CRM Async services information • CRM Event monitoring
- 30. • Application Object Server statistics Dynamics AX AOS
- 31. • AX SQL transaction statistics • AX SQL performance statistics AX SQL
- 32. • Server processor performance • Server memory information AX Server statistics
- 33. Discovery & mapping Make it easy with inbuilt reports and customizable dashboards
- 34. Reports Trend Analysis Report: Understand performance trends of your business servers based on historical data to predict future trends and stay informed. Reports based on Monitor Types and their respective metrics: Generate reports instantaneously for custom attributes of individual servers, monitor types and even monitor groups
- 35. Trend analysis report • History Report • Hour of Day Report • Day of Week Report • Statistical Report • Heat Chart
- 36. View & compare reports Compare performance attribute reports of different monitors.
- 37. Dashboards • Customize with widgets • Create and publish multiple dashboards • Unified business view of your entire IT infrastructure
- 38. Quick Recap: Support appmanager-support@manageengine.com Eval eval-apm@manageengine.com Online Demo demo.appmanager.com • The right approach to monitoring ERPs • Ensure your ERP solution is free of performance hiccups • Exploring SAP, Dynamics AX, Dynamics CRM, Oracle EBS metrics • Make it easy with inbuilt reports and customizable dashboards