Designing IA for AI - Information Architecture Conference 2024
03 02-0004
1. The 14th World Conference on Earthquake Engineering
October 12-17, 2008, Beijing, China
EMPIRICAL GROUND MOTION MODEL FOR SHALLOW CRUSTAL
EARTHQUAKES IN ACTIVE TECTONIC ENVIRONMENTS DEVELOPED
FOR THE NGA PROJECT
1
K.W. Campbell and Y. Bozorgnia
2
1
2
Vice President, ABS Consulting (EQECAT), Beaverton, Oregon, USA
Associate Director, PEER, University of California, Berkeley, California, USA
Email: kcampbell@eqecat.com, yousef@berkeley.edu
ABSTRACT
We present a new empirical ground motion model for PGA, PGV, PGD and 5% damped linear elastic response
spectra for periods ranging from 0.01–10 s. The model was developed as part of the PEER Next Generation
Attenuation (NGA) project. We used a subset of the PEER NGA database for which we excluded recordings
and earthquakes that were believed to be inappropriate for estimating free-field ground motions from shallow
earthquake mainshocks in active tectonic regimes. We developed relations for both the median and standard
deviation of the geometric mean horizontal component of ground motion that we consider to be valid for
magnitudes ranging from 4.0 up to 7.5–8.5 (depending on fault mechanism) and distances ranging from 0–200
km. The model explicitly includes the effects of magnitude saturation, magnitude-dependent attenuation, style
of faulting, rupture depth, hanging-wall geometry, linear and nonlinear site response, 3-D basin response, and
inter-event and intra-event variability. Soil nonlinearity causes the intra-event standard deviation to depend on
the amplitude of PGA on reference rock rather than on magnitude, which leads to a decrease in aleatory
uncertainty at high levels of ground shaking for sites located on soil.
KEYWORDS: Attenuation, Ground Motion Prediction, Response Spectra, Active Tectonic Regions
1. INTRODUCTION
The empirical ground motion model (also referred to as an attenuation relation or ground motion prediction
equation) presented in this paper represents the culmination of a four-year multidisciplinary study sponsored by
the Pacific Earthquake Engineering Research Center (PEER) referred to as the Next Generation Attenuation
(NGA) Ground Motion Project (Power et al., 2008). This new ground motion model supersedes our existing
ground motion models for peak ground velocity (PGV) (Campbell, 1997) and peak ground acceleration (PGA)
and 5% damped pseudo-absolute response spectral acceleration (PSA) (Campbell and Bozorgnia, 2003). Our
NGA model represents a major advancement in ground motion prediction made possible by the extensive update
of the PEER strong motion database and the supporting studies on 1-D ground motion simulation, 1-D site
response, and 3-D basin response sponsored by the NGA project. This paper provides a brief description of the
database, functional forms, and analyses that went into the development the new NGA ground motion model.
Additional documentation is given in Campbell and Bozorgnia (2007, 2008).
2. DATABASE
The database used for this study is a subset of the updated PEER strong motion database (Chiou et al., 2008).
The general criteria that we used to select this subset was intended to meet our requirements that (1) the
earthquake be located within the shallow continental lithosphere (i.e., the Earth’s crust) in a region considered to
be tectonically active, (2) that the recording be located at or near ground level and exhibit no known embedment
or topographic effects, (3) that the earthquake have enough recordings to reliably represent the mean horizontal
ground motion (especially for small-magnitude events), and (4) that the earthquake or the recording be
considered reliable according to criteria set forth in Campbell and Bozorgnia (2007).
2. The 14th World Conference on Earthquake Engineering
October 12-17, 2008, Beijing, China
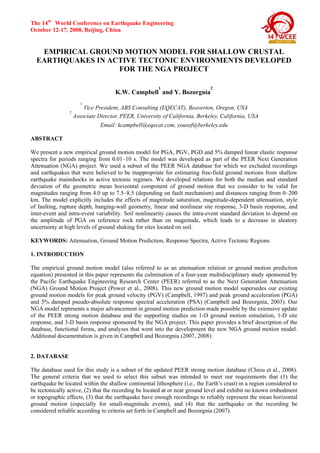
Application of the above criteria resulted in the selection of 1561 recordings from 64 earthquakes with moment
magnitudes (M) ranging from 4.3–7.9 and rupture distances (RRUP) ranging from 0.1–199 km. Table 1 of
Campbell and Bozorgnia (2008) presents a summary of these earthquakes. A complete list of the selected
earthquakes and recording stations are given in Appendix A of Campbell and Bozorgnia (2007). The distribution
of the recordings with respect to magnitude and distance is shown in Fig. 1.
8.0
Moment Magnitude
7.5
7.0
6.5
6.0
5.5
5.0
4.5
4.0 -1
10
10 0
10 1
10 2
10 3
Closest Distance to Rupture (km)
Figure 1. Database used in the analysis.
3. GROUND MOTION MODEL
The functional forms used to define our NGA model were either developed by us or evaluated from those
available from the literature or proposed during the NGA project. Final functional forms were selected
according to (1) their sound seismological basis; (2) their unbiased residuals; (3) their ability to be extrapolated
to values of magnitude, distance, and other explanatory variables that are important for use in engineering and
seismology; and (4) their simplicity, although this latter consideration was not an overriding factor. The third
criterion was the most difficult to achieve because the data did not always allow the functional forms of some
explanatory variables to be developed empirically. In such cases, theoretical constraints were used to define the
functional forms based on supporting studies sponsored by the NGA project (Power et al., 2008).
During the model development phase of the study, regression analyses were performed in two stages for a
limited set of oscillator periods (T) using a two-stage nonlinear regression procedure. In Stage 1, the
mathematical terms involving individual recordings (the intra-event terms) were fit by the method of nonlinear
least squares using all of the recordings. In Stage 2, the mathematical terms common to all recordings of a
specific earthquake (the inter-event terms) were fit by the method of weighted least squares using the event
terms from Stage 1 as the “data”. Each event term was assigned a weight that was inversely proportional to its
calculated variance from Stage 1. This two-stage analysis allowed us to decouple the intra-event and inter-event
terms, which stabilized the regression analysis and allowed us to independently evaluate and model magnitude
scaling effects at large magnitudes. Once the functional forms for all of the mathematical terms were established,
a series of iterative random-effects regression analyses were performed for the entire range of periods in order to
derive a smoothed set of model coefficients and to calculate the final values of the inter-event and intra-event
standard deviations.
3.1. Definition of Ground Motion Component
The ground motion component used in our NGA model is not the traditional geometric mean of the two
“as-recorded” horizontal components that has been used in past studies. The principle drawback of the old
geometric mean is its dependence on the orientation of the sensors as installed in the field. The new geometric
mean, referred to as “GMRotI50” by Boore et al. (2006), is independent of both sensor orientation and oscillator
period and, as a result, represents a more robust horizontal ground motion component. It was found to have a
value that is on average within a few percent of the old geometric mean. In some engineering applications it is
3. The 14th World Conference on Earthquake Engineering
October 12-17, 2008, Beijing, China
necessary to calculate the median and aleatory uncertainty of the arbitrary horizontal component (Baker and
Cornell, 2006). The median estimate of this component is equivalent to the median estimate of the traditional
geometric mean. However, as discussed latter in the paper, its variance must be increased by the variance of the
component-to-component variability between the two horizontal components of the recording. The relationship
between the new geometric mean and other horizontal ground motion components, such as the maximum
arbitrary (as-recorded) horizontal component, the maximum rotated horizontal component, and the
strike-normal component can be found in Campbell and Bozorgnia (2007, 2008) and references therein.
3.2. Median Ground Motion Model
The median estimate of ground motion can be calculated from the general equation
ln Yij = f mag + f dis + f flt + f hng + f site + f sed
(3.1)
where
f mag
⎧c0 + c1M;
⎪
= ⎨c0 + c1M + c2 (M − 5.5);
⎪c + c M + c (M − 5.5) + c (M − 6.5);
⎩ 0 1
2
3
f dis = (c4 + c5 M ) ln
(
2
2
RRUP + c6
M ≤ 5.5
5.5 < M ≤ 6.5
M > 6.5
)
(3.3)
f flt = c7 FRV f flt , Z + c8 FNM
(3.4)
ZTOR < 1
⎧ ZTOR ;
f flt , Z = ⎨
⎩1;
(3.5)
ZTOR ≥ 1
f hng = c9 f hng , R f hng , M f hng , Z f hng ,δ
f hng , R
(3.6)
⎧1;
⎪
⎪
2
2
= ⎨ ⎡ max RRUP , RJB + 1 − RJB ⎤ max RRUP , RJB + 1 ;
⎣
⎦
⎪
⎪
⎩( RRUP − RJB ) / RRUP ;
(
)
f hng , M
(
⎧0;
⎪
= ⎨ 2 (M − 6.0);
⎪1;
⎩
)
6.0 < M < 6.5
RJB > 0, ZTOR < 1
(3.7)
RJB > 0, ZTOR ≥ 1
(3.8)
M ≥ 6.5
ZTOR ≥ 20
⎩(20 − Z TOR ) / 20;
0 ≤ Z TOR < 20
⎧1;
f hng ,δ = ⎨
⎩(90 − δ ) / 20;
RJB = 0
M ≤ 6.0
⎧0;
f hng , Z = ⎨
(3.2)
δ ≤ 70
δ > 70
(3.9)
(3.10)
4. The 14th World Conference on Earthquake Engineering
October 12-17, 2008, Beijing, China
f site
n
⎧
⎧ ⎡
⎫
⎛ VS 30 ⎞
⎛ VS 30 ⎞ ⎤
⎪
⎪
⎪c10 ln ⎜
⎟ + k2 ⎨ln ⎢ A1100 + c ⎜
⎟ ⎥ − ln [ A1100 + c ]⎬ ;
⎪
⎝ k1 ⎠
⎝ k1 ⎠ ⎥
⎪ ⎢
⎪
⎦
⎩ ⎣
⎭
⎪
⎛V ⎞
⎪
= ⎨(c10 + k 2 n) ln ⎜ S 30 ⎟ ;
⎝ k1 ⎠
⎪
⎪
⎛ 1100 ⎞
⎪(c10 + k2 n) ln ⎜
⎟;
⎪
⎝ k1 ⎠
⎩
f sed
⎧c11 ( Z 2.5 − 1);
⎪
⎪
= ⎨0;
⎪
−0.25( Z
−0.75
⎪c12 k3e ⎡1 − e
⎣
⎩
VS 30 < k1
k1 ≤ VS 30 < 1100
(3.11)
VS 30 ≥ 1100
Z 2.5 < 1
1 ≤ Z 2.5 ≤ 3
2.5 − 3)
⎤;
⎦
(3.12)
Z 2.5 > 3
In the above equations, Yij is the median estimate of the geometric mean horizontal component (GMRotI50) of
PGA (g), PGV (cm/s), PGD (cm) or PSA (g) for site j of event i; M is moment magnitude; RRUP is the closest
distance to the coseismic rupture plane (km); RJB is the closest distance to the surface projection of the
coseismic rupture plane (km); FRV is an indicator variable representing reverse and reverse-oblique faulting,
where FRV = 1 for 30° < λ < 150°, FRV = 0 otherwise, and λ is the rake defined as the average angle of slip
measured in the plane of rupture between the strike direction and the slip vector; FNM is an indicator variable
representing normal and normal-oblique faulting, where FNM = 1 for –150° < λ < –30° and FNM = 0 otherwise;
ZTOR is the depth to the top of the coseismic rupture plane (km); δ is the dip of the rupture plane (°); VS30 is the
time-averaged shear-wave velocity in the top 30 m of the site profile (m/s); A1100 is the median estimate of PGA
on a reference rock outcrop with VS30 = 1100 m/s (g); and Z2.5 is the depth to the 2.5 km/s shear-wave velocity
horizon, typically referred to as basin or sediment depth (km). The empirical coefficients ci and the theoretical
coefficients c, n and ki are listed in Table 1. When PSA < PGA and T ≤ 0.25 s, PSA should be set equal to PGA
to be consistent with the definition of pseudo-absolute acceleration.
T (s)
0.010
0.020
0.030
0.050
0.075
0.10
0.15
0.20
0.25
0.30
0.40
0.50
0.75
1.0
1.5
2.0
3.0
4.0
5.0
c0
-1.715
-1.680
-1.552
-1.209
-0.657
-0.314
-0.133
-0.486
-0.890
-1.171
-1.466
-2.569
-4.844
-6.406
-8.692
-9.701
-10.556
-11.212
-11.684
Table 1. Coefficients for the median ground motion model
c1
c2
c3
c4
c5
c6
0.500
-0.530
-0.262
-2.118
0.170
5.60
0.500
-0.530
-0.262
-2.123
0.170
5.60
0.500
-0.530
-0.262
-2.145
0.170
5.60
0.500
-0.530
-0.267
-2.199
0.170
5.74
0.500
-0.530
-0.302
-2.277
0.170
7.09
0.500
-0.530
-0.324
-2.318
0.170
8.05
0.500
-0.530
-0.339
-2.309
0.170
8.79
0.500
-0.446
-0.398
-2.220
0.170
7.60
0.500
-0.362
-0.458
-2.146
0.170
6.58
0.500
-0.294
-0.511
-2.095
0.170
6.04
0.500
-0.186
-0.592
-2.066
0.170
5.30
0.656
-0.304
-0.536
-2.041
0.170
4.73
0.972
-0.578
-0.406
-2.000
0.170
4.00
1.196
-0.772
-0.314
-2.000
0.170
4.00
1.513
-1.046
-0.185
-2.000
0.170
4.00
1.600
-0.978
-0.236
-2.000
0.170
4.00
1.600
-0.638
-0.491
-2.000
0.170
4.00
1.600
-0.316
-0.770
-2.000
0.170
4.00
1.600
-0.070
-0.986
-2.000
0.170
4.00
c7
0.280
0.280
0.280
0.280
0.280
0.280
0.280
0.280
0.280
0.280
0.280
0.280
0.280
0.255
0.161
0.094
0.000
0.000
0.000
c8
-0.120
-0.120
-0.120
-0.120
-0.120
-0.099
-0.048
-0.012
0.000
0.000
0.000
0.000
0.000
0.000
0.000
0.000
0.000
0.000
0.000
5. The 14th World Conference on Earthquake Engineering
October 12-17, 2008, Beijing, China
7.5
10.0
PGA
PGV
PGD
-12.505
-13.087
-1.715
0.954
-5.270
1.600
1.600
0.500
0.696
1.600
-0.070
-0.070
-0.530
-0.309
-0.070
-0.656
-0.422
-0.262
-0.019
0.000
-2.000
-2.000
-2.118
-2.016
-2.000
0.170
0.170
0.170
0.170
0.170
4.00
4.00
5.60
4.00
4.00
0.000
0.000
0.280
0.245
0.000
0.000
0.000
-0.120
0.000
0.000
T (s)
0.010
0.020
0.030
0.050
0.075
0.10
0.15
0.20
0.25
0.30
0.40
0.50
0.75
1.0
1.5
2.0
3.0
4.0
5.0
7.5
10.0
PGA
PGV
PGD
c9
0.490
0.490
0.490
0.490
0.490
0.490
0.490
0.490
0.490
0.490
0.490
0.490
0.490
0.490
0.490
0.371
0.154
0.000
0.000
0.000
0.000
0.490
0.358
0.000
c10
1.058
1.102
1.174
1.272
1.438
1.604
1.928
2.194
2.351
2.460
2.587
2.544
2.133
1.571
0.406
-0.456
-0.820
-0.820
-0.820
-0.820
-0.820
1.058
1.694
-0.820
c11
0.040
0.040
0.040
0.040
0.040
0.040
0.040
0.040
0.040
0.040
0.040
0.040
0.077
0.150
0.253
0.300
0.300
0.300
0.300
0.300
0.300
0.040
0.092
0.300
c12
0.610
0.610
0.610
0.610
0.610
0.610
0.610
0.610
0.700
0.750
0.850
0.883
1.000
1.000
1.000
1.000
1.000
1.000
1.000
1.000
1.000
0.610
1.000
1.000
k1
865
865
908
1054
1086
1032
878
748
654
587
503
457
410
400
400
400
400
400
400
400
400
865
400
400
k2
-1.186
-1.219
-1.273
-1.346
-1.471
-1.624
-1.931
-2.188
-2.381
-2.518
-2.657
-2.669
-2.401
-1.955
-1.025
-0.299
0.000
0.000
0.000
0.000
0.000
-1.186
-1.955
0.000
k3
1.839
1.840
1.841
1.843
1.845
1.847
1.852
1.856
1.861
1.865
1.874
1.883
1.906
1.929
1.974
2.019
2.110
2.200
2.291
2.517
2.744
1.839
1.929
2.744
c
1.88
1.88
1.88
1.88
1.88
1.88
1.88
1.88
1.88
1.88
1.88
1.88
1.88
1.88
1.88
1.88
1.88
1.88
1.88
1.88
1.88
1.88
1.88
1.88
n
1.18
1.18
1.18
1.18
1.18
1.18
1.18
1.18
1.18
1.18
1.18
1.18
1.18
1.18
1.18
1.18
1.18
1.18
1.18
1.18
1.18
1.18
1.18
1.18
3.3. Aleatory Uncertainty Model
Consistent with the random-effects regression analysis that was used to derive the median ground motion model,
the aleatory uncertainty model is defined by the equation
ln yij = ln Yij + ηi + ε ij
(3.13)
where ηi is the inter-event residual for event i and y, yij and εij are the predicted value, the observed value, and
the intra-event residual for recording j of event i. The independent normally distributed variables ηi and εij have
zero means and an estimated inter-event standard deviation (τ) and intra-event standard deviation (σ) given by
the equations
τ = τ ln Y
(3.14)
2
2
2
σ = σ ln Y + σ ln AF + α 2σ ln A + 2αρσ ln Y σ ln A
B
which result in a total standard deviation of
B
B
B
(3.15)
6. The 14th World Conference on Earthquake Engineering
October 12-17, 2008, Beijing, China
σT = σ 2 +τ 2
(3.16)
In the above equations, τlnY is the standard deviation of the inter-event residuals; σlnYB = (σ2lnY – σ2lnAF)1/2 is the
estimated standard deviation of ground motion at the base of the site profile; σlnY is the standard deviation of the
intra-event residuals; σlnAF is the estimated standard deviation of the logarithm of the site amplification factor fsite
assuming linear site response; σlnAB = (σ2lnPGA – σ2lnAF)1/2 is the estimated standard deviation of PGA on
reference rock at the base of the site profile; σlnPGA is the standard deviation of PGA; ρ is the correlation
coefficient between the intra-event residuals of the ground motion parameter of interest and PGA; and α is the
linearized functional relationship between fsite and ln A1100, which is estimated from the partial derivative
α=
∂f site
∂ ln A1100
{
n −1
−1
⎧k A
⎪ 2 1100 ⎡ A1100 + c (VS 30 k1 ) ⎤ − ( A1100 + c )
⎣
⎦
=⎨
⎪0
⎩
}
VS 30 < k1
(3.17)
VS 30 ≥ k1
where the coefficients k1, k2, c and n are listed in Table 1. The standard deviations τlnY, σlnY, σlnPGA and σlnAF and
the correlation coefficient ρ are listed in Table 2. Details summarizing the development of the nonlinear site
amplification model are given in Campbell and Bozorgnia (2007, 2008).
As discussed previously, in some applications engineers require an estimate of the aleatory uncertainty of the
arbitrary horizontal component (Baker and Cornell, 2006), which is given by the equation
2
σ Arb = σ T2 + σ C
(3.18)
where σC is defined as
2
σC =
1
N
∑ (ln y
4N
1j
− ln y2 j ) 2 ,
(3.19)
j =1
In the above equations, yij is the value of the ground motion parameter for component i of recording j and N is
the total number of recordings. Values of σC are listed in Table 2. Also listed in this table for reference are the
values of σT and σArb for ground motions that are subject to linear site response (i.e., for VS30 ≥ k1 or for small
values of A1100). For ground motions subject to nonlinear site response, these standard deviations should be
calculated from Eqns. 3.15–3.19 using the values listed in Table 2.
Table 2. Standard deviations for the aleatory uncertainty model
T (s)
0.010
σlnY
τlnY
σC
σT
σArb
ρ
0.478
0.219
0.166
0.526
0.551
1.000
0.020
0.480
0.219
0.166
0.528
0.553
0.999
0.030
0.489
0.235
0.165
0.543
0.567
0.989
0.050
0.510
0.258
0.162
0.572
0.594
0.963
0.075
0.520
0.292
0.158
0.596
0.617
0.922
0.10
0.531
0.286
0.170
0.603
0.627
0.898
0.15
0.532
0.280
0.180
0.601
0.628
0.890
0.20
0.534
0.249
0.186
0.589
0.618
0.871
0.25
0.534
0.240
0.191
0.585
0.616
0.852
7. The 14th World Conference on Earthquake Engineering
October 12-17, 2008, Beijing, China
0.30
0.544
0.215
0.198
0.585
0.618
0.831
0.40
0.541
0.217
0.206
0.583
0.618
0.785
0.50
0.550
0.214
0.208
0.590
0.626
0.735
0.75
0.568
0.227
0.221
0.612
0.650
0.628
1.0
0.568
0.255
0.225
0.623
0.662
0.534
1.5
0.564
0.296
0.222
0.637
0.675
0.411
2.0
0.571
0.296
0.226
0.643
0.682
0.331
3.0
0.558
0.326
0.229
0.646
0.686
0.289
4.0
0.576
0.297
0.237
0.648
0.690
0.261
5.0
0.601
0.359
0.237
0.700
0.739
0.200
7.5
0.628
0.428
0.271
0.760
0.807
0.174
10.0
0.667
0.485
0.290
0.825
0.874
0.174
PGA
0.478
0.219
0.166
0.526
0.551
1.000
PGV
0.484
0.203
0.190
0.525
0.558
0.691
PGD
0.667
0.485
0.290
0.825
0.874
0.174
4. CONCLUSIONS
We consider our new NGA ground motion prediction equations to be appropriate for estimating PGA, PGV,
PGD and linear elastic response spectra (T = 0.01–10 s) for shallow continental earthquakes occurring in
western North America and other regimes of similar active tectonics such as southern Europe (Campbell and
Bozorgnia, 2006; Stafford et al., 2008). The model is considered most reliable when evaluated for (1) M > 4.0;
(2) M < 8.5 for strike-slip faulting, M < 8.0 for reverse faulting, and M < 7.5 for normal faulting; (3) RRUP =
0–200 km; (4) VS30 = 150–1500 m/s or alternatively NEHRP site classes B (VS30 = 1070 m/s), C (VS30 = 525 m/s),
D (VS30 = 255 m/s) and E (VS30 = 150 m/s); (4) Z2.5 = 0–10 km; (5) ZTOR = 0–15 km; and (6) δ = 15– 90°. As an
example, the predicted attenuation and magnitude scaling characteristics of PGA and response spectra (M = 7.0
and RRUP = 10 km, respectively) for rock with VS30 = 760 m/s, a sediment depth of 2.5 km, and strike-slip
faulting are displayed in Figs. 2 and 3.
ACKNOLWDEMENTS
This study was sponsored by the Pacific Earthquake Engineering Research Center’s (PEER’s) Program of
Applied Earthquake Engineering Research of Lifelines Systems supported by the California Department of
Transportation, the California Energy Commission, and the Pacific Gas and Electric Company. This work made
use of the Earthquake Engineering Research Centers Shared Facilities supported by the National Science
Foundation, under award number EEC-9701568 through PEER. Any opinions, findings, and conclusions or
recommendations expressed in this material are those of the authors and do not necessarily reflect those of the
National Science Foundation.
REFERENCES
Baker, J.W. and Cornell, C.A. (2006). Which spectral acceleration are you using? Earthquake Spectra 22,
293–312.
Boore, D.M., Watson-Lamprey, J. and Abrahamson, N. (2006). Orientation-independent measures of ground
8. The 14th World Conference on Earthquake Engineering
October 12-17, 2008, Beijing, China
motion, Bulletin of the Seismological Society of America 96, 1502–1511.
Chiou, B., Darragh, R., Gregor, N. and Silva, W. (2008). NGA project strong-motion database. Earthquake
Spectra 24, 23–44.
Campbell, K.W. (1997). Empirical near-source attenuation relationships for horizontal and vertical components
of peak ground acceleration, peak ground velocity, and pseudo-absolute acceleration response spectra.
Seismological Research Letters 68, 154–179.
Campbell, K.W. and Bozorgnia, Y. (2003). Updated near-source ground motion (attenuation) relations for the
horizontal and vertical components of peak ground acceleration and acceleration response spectra. Bulletin of
the Seismological Society of America 93, 314–331.
Campbell, K.W. and Bozorgnia, Y. (2006). Next generation attenuation (NGA) empirical ground motion models:
can they be used in Europe?, in Proceedings, First European Conference on Earthquake Engineering and
Seismology, Paper No. 458, Geneva, Switzerland.
Campbell, K.W. and Bozorgnia, Y. (2007). Campbell-Bozorgnia NGA ground motion relations for the geometric
mean horizontal component of peak and spectral ground motion parameters, PEER Report No. 2007/02, Pacific
Earthquake Engineering Research Center, University of California, Berkeley, California, USA.
Campbell, K.W. and Bozorgnia, Y. (2008). NGA ground motion model for the geometric mean horizontal
component of PGA, PGV, PGD and 5% damped linear elastic response spectra for periods ranging from 0.01 to
10 s. Earthquake Spectra 24, 139–171.
Power, M., Chiou, B., Abrahamson, N., Bozorgnia, Y., Shantz, T. and Roblee, C. (2008). An overview of the
NGA project. Earthquake Spectra 24, 3–21.
Stafford, P.J., Strasser, F.O. and Bommer, J.J. (2008). An evaluation of the applicability of the NGA models to
ground-motion prediction in the Euro-Mediterranean region. Bulletin of Earthquake Engineering 6, 149–177.
10 1
Spectral Acceleration (g)
Acceleration (g)
10 0
10 -1
M=
M=
M=
M=
8.0
7.0
6.0
5.0
10 -2 0
10
10 1
Rrup =
Rrup =
Rrup =
Rrup =
10 0
10 -1
10 -2
10 -3 -2
10
10 2
10 -1
Closest Distance to Rupture (km)
10 1
10 0
10 1
10 0
Spectral Acceleration (g)
Acceleration (g)
10 0
Period (s)
10 0
10 -1
10 -2
Rrup =
Rrup =
Rrup =
Rrup =
10 -3
4.5
0
10
50
200
5.0
5.5
6.0
6.5
7.0
7.5
0 km
10 km
50 km
200 km
8.0
8.5
Moment Magnitude
Figure 2. Predicted estimates of PGA.
10 -1
10 -2
10 -3
10 -4 -2
10
M=
M=
M=
M=
8.0
7.0
6.0
5.0
10 -1
Period (s)
Figure 3. Predicted estimates of PSA.