
Empfohlen
Weitere ähnliche Inhalte
Was ist angesagt?
Was ist angesagt? (20)
Andere mochten auch
Andere mochten auch (15)
Ähnlich wie Demand and supply questions
Ähnlich wie Demand and supply questions (20)
Kürzlich hochgeladen
Kürzlich hochgeladen (20)
Demand and supply questions
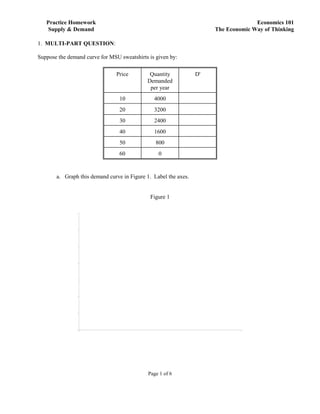
- 1. Page 1 of 6 Practice Homework Supply & Demand Economics 101 The Economic Way of Thinking 1. MULTI-PART QUESTION: Suppose the demand curve for MSU sweatshirts is given by: Price Quantity Demanded per year D' 10 4000 20 3200 30 2400 40 1600 50 800 60 0 a. Graph this demand curve in Figure 1. Label the axes. Figure 1
- 2. Page 2 of 6 Suppose the supply curve for MSU sweatshirts is given by: Price Quantity Supplied per year S' 10 400 20 800 30 1200 40 1600 50 2000 60 2400 b. Graph the supply for MSU sweatshirts in Figure 1. c. At what price does equilibrium occur? __________What quantity is traded at that price? __________ . At this equilibrium, how much in total dollars is spent on MSU sweatshirts? __________. d. Suppose the price of cotton (a production input for sweatshirts) falls such that at each price, quantity supplied changes by 1200 units. Complete the column of the supply table labeled S'. Graph the new supply curve in Figure 1. Label it S'. e. What is the new equilibrium price? _____________ quantity? _____________. At this equilibrium, how much in total dollars is spent on MSU sweatshirts? __________ f. Starting with the original demand and supply figures, suppose that the price of sweatpants ( a compliment consumption good to sweatshirts) falls. As a result, the quantity of MSU sweatshirts demanded changes by 1200 at each price. Complete column D' of the demand table. Graph the new demand curve in Figure 1. Label it D'. g. What is the new equilibrium price? ___________ quantity? ___________. At this equilibrium, how much in total dollars is spent on MSU sweatshirts? __________
- 3. Page 3 of 6 2. Find an article in a recent newspaper or magazine illustrating a change in equilibrium price or quantity in some market. It doesn’t matter what product is involved, but you should avoid advertisements (they generally don’t contain enough useful information) and don’t look at the stock market or commodity market unless you have a very good understanding of finance. Attach a copy of the article to this sheet, and then answer the following questions: a. Is the change in the result of an increase or a decrease in demand? If so, what is likely to have caused it (refer to the factors that shift demand) and why. b. Is the change the result of an increase or a decrease in supply? If so, what is likely to have caused it (refer to the factors that shift supply) and why. c. In Figure 2 below, draw supply and demand curves to illustrate what changed. Be sure to label your graph clearly and indicate which curve shifts and the old and new equilibria. Figure 2
- 4. Page 4 of 6 3. Draw one supply and demand diagram for milk in each of the four cells of the table below. Then illustrate: in cell (1) an increase in demand; in cell (2) an increase in supply; in cell (3) a decrease in demand, and in cell (4) a decrease in supply. Show what happens to equilibrium price and equilibrium quantity in each case (each graph should show an original demand and supply curve, the original equilibrium price and quantity, the shifted demand or supply curve, and the resulting equilibrium price and quantity) and offer a possible reason for each of the shifts you illustrate (for cell (1), for example, what factors could cause an increase in the demand for milk). 1 2 3 4
- 5. Page 5 of 6 Homework 2 - Multiple Choice 1. According to the law of supply, price and quantity supplied are a. inversely related b. positively related c. not related d. the same e. negatively related 2. Successful advertising by the Camel Cigarette Company would a. cause a downward movement along the existing demand curve for Camel cigarettes b. cause an upward movement along the existing demand curve for Camel cigarettes c. shift the demand curve for Camel cigarettes to the left d. shift the demand curve for Camel cigarettes to the right 3. If lima beans are an inferior good for Alice, a decrease in her income would a. shift her demand curve for lima beans to the left b. shift her demand curve for lima beans to the right c. cause her to move upward along her existing demand curve for lima beans d. cause her to move downward along her existing demand curve for lima beans 4. When we draw a supply curve for automobiles, which of the following is allowed to vary among the different points on the supply curve? a. costs of inputs for suppliers b. future expectations of suppliers c. technology available to suppliers d. the price of automobiles e. all of the above 5. Which of the following will result in an increase in the quantity demanded of Canadian wheat, ceteris paribus? a. a decrease in the price of Canadian wheat b. a decrease in the number of farmers growing Canadian wheat c. an increase in the cost of producing Canadian wheat d. a decrease in the price of U.S. wheat e. all of the above 6. A decrease in the price of a movie ticket creates an increase in consumers' purchasing power, so that they can afford to buy more movie tickets. This is called the a. substitution effect b. income effect c. demand effect d. diminishing marginal utility effect e. power play 7. Which of the following would shift the supply curve for cigarettes? a. A change in household incomes b. A change in the price of cigars, a substitute good in consumption but not production. c. A change in the number of smokers d. New, higher taxes on tobacco production
- 6. Page 6 of 6 8. When economists say that the supply of dry cleaning services has decreased, they mean that a. there was a downward movement along the supply curve for dry cleaning services b. there was an upward movement along the supply curve for dry cleaning services c. the supply curve for dry cleaning services has shifted to the right d. the supply curve for dry cleaning services has shifted to the left 9. Which of the following is held constant along the supply curve? a. price of the good c. technology b. both a and d d. quantity 10. Which of the following is likely to result in a shift in the supply curve for sweaters? a. an increase in consumer incomes b. an increase in tariffs that forces sweater manufacturers to import wool at higher prices c. an increase in sweater prices d. higher prices for coats, which are substitutes in consumption but not substitutes in production