1. Diketahui Keuntungan bersih Holding Company
Besarnya Bonus yang akan dibagikan dari keuntungan 25% atau sebesar
Pembagian Bonus untuk PT. Super Metro 80% atau sebesar
Pembagian Bonus untuk PT. Super Hero 30% atau sebesar
Diketahui Jumlah Karyawan dari kedua divisi tersebut
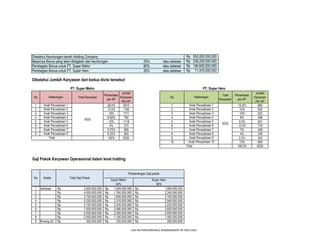
No Total Karyawan
Persentase
per AP
Jumlah
Karyawan
Per AP
No
Total
Karyawan
Persentase
per AP
Jumlah
Karyawan
Per AP
1 28.0% 2610 1 15.5% 965
2 12.5% 1165 2 15% 934
3 19% 1771 3 10% 623
4 8.50% 792 4 8% 498
5 12% 1118 5 9.5% 591
6 4% 373 6 12.5% 778
7 9.75% 909 7 7% 436
8 6.25% 583 8 4% 249
100% 9320 9 5.5% 342
10 13% 809
100.0% 6225
Gaji Pokok Karyawan Operasional dalam level holding
1 Istimewa
2
3
4
5
6
7
8
9 Kurang (K)
953,000,000,000Rp
238,250,000,000Rp
190,600,000,000Rp
71,475,000,000Rp
2,800,000,000Rp
1,400,000,000Rp
280,000,000Rp
1,960,000,000Rp
2,240,000,000Rp
2,100,000,000Rp
2,940,000,000Rp
3,220,000,000Rp
3,920,000,000Rp
Anak Perusahaan 8
Keterangan
44%
3,500,000,000Rp 1,540,000,000Rp
4,000,000,000Rp
Anak Perusahaan 1
Anak Perusahaan 2
Anak Perusahaan 3
Anak Perusahaan 4
Anak Perusahaan 5
2,500,000,000Rp 1,100,000,000Rp
5,750,000,000Rp 2,530,000,000Rp
7,000,000,000Rp 3,080,000,000Rp
5,000,000,000Rp 2,200,000,000Rp
Super Metro
Anak Perusahaan 6
Anak Perusahaan 7
Anak Perusahaan 9
Anak Perusahaan 10
No Grade Total Gaji Pokok
Perbandingan Gaji pokok
Super Hero
56%
9320
Total
Anak Perusahaan 5
Anak Perusahaan 6
Anak Perusahaan 7
Anak Perusahaan 8
500,000,000Rp 220,000,000Rp
Keterangan
Anak Perusahaan 1
Anak Perusahaan 2
Anak Perusahaan 3
Anak Perusahaan 4
3,750,000,000Rp 1,650,000,000Rp
5,250,000,000Rp 2,310,000,000Rp
1,760,000,000Rp
PT. Super Metro PT. Super Hero
6225
Total
UAS HR PERFORMANCE MANAGEMENT BY ADE FAUJI
2. Pengelompokan System Penilaian Per Anak Perusahaan (AP) di PT. Super Metro
No Grade Persentase AP 1 AP 2 AP 3 AP 4 AP 5 AP 6 AP 7 AP 8 Total
1 Istimewa 2% 52 23 35 16 22 7 18 12 186
2 3% 78 35 53 24 34 11 27 17 280
3 5% 130 58 89 40 56 19 45 29 466
4 10% 261 117 177 79 112 37 91 58 932
5 20% 522 233 354 158 224 75 182 117 1864
6 40% 1044 466 708 317 447 149 363 233 3728
7 10% 261 117 177 79 112 37 91 58 932
8 8% 209 93 142 63 89 30 73 47 746
9 Kurang (K) 2% 52 23 35 16 22 7 18 12 186
100% 2610 1165 1771 792 1118 373 909 583 9320
Pengelompokan System Penilaian Per Anak Perusahaan (AP) di PT. Super Hero
No Grade Persentase AP 1 AP 2 AP 3 AP 4 AP 5 AP 6 AP 7 AP 8 AP 9 AP 10 Total
1 Istimewa 2% 19 19 12 10 12 16 9 5 7 16 125
2 3% 29 28 19 15 18 23 13 7 10 24 187
3 5% 48 47 31 25 30 39 22 12 17 40 311
4 10% 96 93 62 50 59 78 44 25 34 81 623
5 20% 193 187 125 100 118 156 87 50 68 162 1245
6 40% 386 374 249 199 237 311 174 100 137 324 2490
7 10% 96 93 62 50 59 78 44 25 34 81 623
8 8% 77 75 50 40 47 62 35 20 27 65 498
9 Kurang (K) 2% 19 19 12 10 12 16 9 5 7 16 125
100% 965 934 623 498 591 778 436 249 342 809 6225
Besaran Pembagian Bonus di PT. Super Metro
% MP
1 Istimewa 2% 186.4 25% 240 44.74
2 3% 280 20% 170 25.41
3 5% 466 16% 150 14.52
Bonus yang didapatkan
per orang
Pengkali
Bonus
255,633,047Rp
136,337,625Rp
65,442,060Rp
Persentase Bonus Per Grade
Besaran Bonus
47,650,000,000Rp
38,120,000,000Rp
30,496,000,000Rp
5,713,519Rp
5,364,807Rp
4,506,438Rp
No Grade Persentase Total Karyawan Gaji Pokok Per Grade Gaji Pokok Per orang
1,065,000,000Rp
1,500,000,000Rp
2,100,000,000Rp
Total
Total
20,860,000,000RpTotal 37,250,000,000Rp 16,390,000,000Rp
UAS HR PERFORMANCE MANAGEMENT BY ADE FAUJI
4. Pembagian Per Anak Perusahaan sesuai Grade di PT. Super Metro
1
2
3
4
5
6
7
8
9
Total
Grand Total
Besaran Pembagian Bonus di PT. Super Hero
% MP
1 Istimewa 2% 124.5 25% 240 16.78
2 3% 187 20% 170 9.53
3 5% 311 16% 150 5.45
4 10% 623 12% 142 2.86
5 20% 1245 10% 124 1.79
6 40% 2490 8% 80 1.27
7 10% 623 4% 52 0.66
8 8% 498 3% 29 0.54
9 Kurang (K) 2% 125 2% 13 2.86
100% 6225 100% 1000
Pembagian Per Anak Perusahaan Sesuai Grade di PT. Super Hero
Total 25,015,000,000Rp 71,475,000,000Rp
500,000,000Rp 4,016,064Rp 1,429,500,000Rp 11,481,928Rp
4,000,000,000Rp 8,032,129Rp 2,144,250,000Rp 4,305,723Rp
4,500,000,000Rp 1,807,229Rp 5,718,000,000Rp 2,296,386Rp
4,350,000,000Rp 6,987,952Rp 2,859,000,000Rp 4,592,771Rp
3,000,000,000Rp 4,819,277Rp 8,577,000,000Rp 13,778,313Rp
4,000,000,000Rp 3,212,851Rp 7,147,500,000Rp 5,740,964Rp
1,500,000,000Rp 8,032,129Rp 14,295,000,000Rp 76,546,185Rp
2,100,000,000Rp 6,746,988Rp 11,436,000,000Rp 36,742,169Rp
Persentase Bonus Per Grade Bonus yang didapatkan
per orang
Pengkali
BonusBesaran Bonus
1,065,000,000Rp 8,554,217Rp 17,868,750,000Rp 143,524,096Rp
9,053,500,000Rp
7,242,800,000Rp
5,794,240,000Rp
4,345,680,000Rp
3,621,400,000Rp
2,897,120,000Rp
1,448,560,000Rp
1,086,420,000Rp
724,280,000Rp
36,214,000,000Rp
4,050,250,000Rp
3,240,200,000Rp
2,592,160,000Rp
1,944,120,000Rp
1,620,100,000Rp
No Grade Persentase Total Karyawan Gaji Pokok Per Grade Gaji Pokok Per orang
Besar Bonus Besar Bonus Besar Bonus Besar Bonus Besar Bonus Besar Bonus
Anak Perusahaan 4 Anak Perusahaan 5 Anak Perusahaan 6 Anak Perusahaan 7
No
Anak Perusahaan 1
Besar Bonus
Anak Perusahaan 2 Anak Perusahaan 3
1,296,080,000Rp
648,040,000Rp
486,030,000Rp
324,020,000Rp1,067,360,000Rp 476,500,000Rp
5,956,250,000Rp
4,765,000,000Rp
3,812,000,000Rp
2,859,000,000Rp
2,382,500,000Rp
1,906,000,000Rp
953,000,000Rp
714,750,000Rp
13,342,000,000Rp
10,673,600,000Rp
8,538,880,000Rp
6,404,160,000Rp
5,336,800,000Rp
4,269,440,000Rp
2,134,720,000Rp
1,601,040,000Rp
457,440,000Rp
1,906,000,000Rp
1,524,800,000Rp
1,219,840,000Rp
914,880,000Rp
762,400,000Rp
609,920,000Rp
304,960,000Rp
228,720,000Rp
152,480,000Rp
5,718,000,000Rp
4,574,400,000Rp
3,659,520,000Rp
2,744,640,000Rp
2,287,200,000Rp
1,829,760,000Rp
914,880,000Rp
686,160,000Rp
371,670,000Rp
4,645,875,000Rp
3,716,700,000Rp
2,973,360,000Rp
2,230,020,000Rp
1,858,350,000Rp
1,486,680,000Rp
743,340,000Rp
557,505,000Rp
53,368,000,000Rp 23,825,000,000Rp 16,201,000,000Rp 22,872,000,000Rp 7,624,000,000Rp 18,583,500,000Rp
190,600,000,000Rp
UAS HR PERFORMANCE MANAGEMENT BY ADE FAUJI
5. 1
2
3
4
5
6
7
8
9
Total
Grand Total
No
Anak Perusahaan 1 Anak Perusahaan 2 Anak Perusahaan 3 Anak Perusahaan 4
Besar Bonus Besar Bonus Besar Bonus Besar Bonus Besar Bonus Besar Bonus Besar Bonus
Anak Perusahaan 5 Anak Perusahaan 6 Anak Perusahaan 7
2,144,250,000Rp
1,715,400,000Rp
1,286,550,000Rp
1,072,125,000Rp
857,700,000Rp
428,850,000Rp
321,637,500Rp
2,769,656,250Rp
2,215,725,000Rp
1,772,580,000Rp
1,329,435,000Rp
1,107,862,500Rp
886,290,000Rp
1,786,875,000Rp
1,429,500,000Rp
1,143,600,000Rp
857,700,000Rp
714,750,000Rp
571,800,000Rp
1,697,531,250Rp
1,358,025,000Rp
114,360,000Rp
228,720,000Rp
171,540,000Rp
1,086,420,000Rp
814,815,000Rp
679,012,500Rp
543,210,000Rp
1,250,812,500Rp
1,000,650,000Rp
800,520,000Rp
5,003,250,000Rp
71,475,000,000Rp
600,390,000Rp
500,325,000Rp
400,260,000Rp
200,130,000Rp
150,097,500Rp
100,065,000Rp
271,605,000Rp
203,703,750Rp
135,802,500Rp
1,072,125,000Rp
893,437,500Rp
714,750,000Rp
357,375,000Rp
268,031,250Rp
443,145,000Rp
332,358,750Rp
221,572,500Rp 214,425,000Rp
11,078,625,000Rp 10,721,250,000Rp 7,147,500,000Rp 5,718,000,000Rp 6,790,125,000Rp 8,934,375,000Rp
2,233,593,750Rp
1,786,875,000Rp
1,429,500,000Rp
178,687,500Rp
285,900,000Rp
214,425,000Rp
142,950,000Rp
1,429,500,000Rp
1,143,600,000Rp
914,880,000Rp
686,160,000Rp
571,800,000Rp
457,440,000Rp
2,680,312,500Rp
UAS HR PERFORMANCE MANAGEMENT BY ADE FAUJI