- The document discusses using "thought experiments" to analyze potential bubbles in the stock market. It uses the analogy of an observer inside a growing bubble being unable to see its expansion compared to an outside observer.
- It analyzes historical data on growth and value stock styles from 1975-2006, finding the current dominance of value stocks over the last 6+ years is unprecedented. This suggests a potential "bubble" exists favoring value stocks.
- Plan sponsors who are significantly invested in large value stocks could face unexpected risks if the bias shifts back toward growth stocks. Maintaining awareness of anomalous market conditions is important.
Uneak White's Personal Brand Exploration Presentation
Pension Scope Style Bubbles
1. Style Bubbles: Observations in the Current Market
By Timothy A. Hope, Applied Research Analyst, Navellier & Associates
Albert Einstein used “thought experiments” to develop his ideas on various topics in physics.
Interestingly, the same technique can also be used to consider what might be happening in the financial
markets today. For example, imagine an individual who is encased within a large, roomy, crystal clear
and pliable sphere, in other words, a bubble. Should that bubble begin to expand uniformly, the observer
inside may have a difficult time recognizing the growth of the bubble. However, given a different point
of view, an outside observer may easily be able to notice the growth of the bubble sphere. Anyone who
has ever blown up balloons at a birthday party can attest to sensing that, at some given point, a balloon
will burst with any additional air.
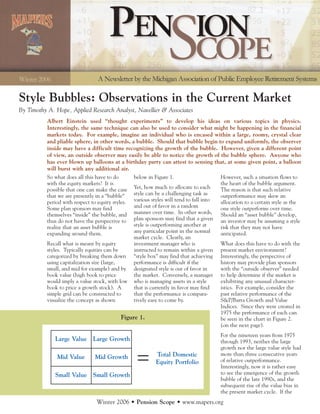
So what does all this have to do below in Figure 1. However, such a situation flows to
with the equity markets? It is the heart of the bubble argument.
possible that one can make the case Yet, how much to allocate to each The reason is that such relative
that we are presently in a “bubble” style can be a challenging task as outperformance may skew an
period with respect to equity styles. various styles will tend to fall into allocation to a certain style as the
Some plan sponsors may find and out of favor in a random one style outperforms over time.
themselves “inside” the bubble, and manner over time. In other words, Should an “asset bubble” develop,
thus do not have the perspective to plan sponsors may find that a given an investor may be assuming a style
realize that an asset bubble is style is outperforming another at risk that they may not have
expanding around them. any particular point in the normal anticipated.
market cycle. Clearly, an
Recall what is meant by equity investment manager who is What does this have to do with the
styles. Typically equities can be instructed to remain within a given present market environment?
categorized by breaking them down “style box” may find that achieving Interestingly, the perspective of
using capitalization size (large, performance is difficult if the history may provide plan sponsors
small, and mid for example) and by designated style is out of favor in with the “outside observer” needed
book value (high book to price the market. Conversely, a manager to help determine if the market is
would imply a value stock, with low who is managing assets in a style exhibiting any unusual character-
book to price a growth stock). A that is currently in favor may find istics. For example, consider the
simple grid can be constructed to that the performance is compara- past relative performance of the
visualize the concept as shown tively easy to come by. S&P/Barra Growth and Value
Indices. Since they were created in
1975 the performance of each can
Figure 1. be seen in the chart in Figure 2.
(on the next page).
For the nineteen years from 1975
Large Value Large Growth through 1993, neither the large
growth nor the large value style had
Total Domestic more than three consecutive years
Mid Value Mid Growth
Equity Portfolio of relative outperformance.
Interestingly, now it is rather easy
Small Value Small Growth to see the emergence of the growth
bubble of the late 1990s, and the
subsequent rise of the value bias in
the present market cycle. If the
Winter 2006 • Pension Scope • www.mapers.org
2. Figure 2. Taken from sources believed to be reliable. Past performance no assurance of future results.
current performance trend between the indexes, what does the plot reveal? bias toward the large value style. It is
large growth and large value continues (Figure 3.) possible that when the bias moves back
in 2006, it would represent an unprece- toward the growth style, plan sponsors
dented seventh consecutive year of It is pretty easy to pick out the who are significantly overweighted in
value dominance. aforementioned growth bubble of the the large value sector could find
late 1990s as evidenced by the sharp themselves exposed to an unanticipated
To gain yet another perspective of upward spike; but note the current risk, namely, style risk.
where we are in the present market value trend falling below the red dotted
cycle, consider the creation of a simple average line. The duration and depth While it is difficult, if not impossible, to
ratio using the prices of the Russell of the value bias is unique and consid- predict when such anomalous trends
1000 Growth and Russell 1000 Value erable. may change course, plan sponsors would
indices, including dividends. By be well served to be cognizant of the
dividing the aforementioned growth Thus, it can be argued that we may be current environment. Although an
index by its value cousin it is possible to in an unusual point in time with respect observer inside the bubble may be
plot the result to see which style might to the large growth and value styles. A unaware of its expansion, the outside
be more prominent. historical snapshot provides an observer can more easily recognize and
interesting perspective that perhaps a adapt to such anomalies.
bubble presently exists with respect to
Russell 1000 Growth (numerator)
Figure 3.
Russell 1000 Value (denominator)
If the two numbers are equal, then the
ratio result will be 1. Recall from
simple arithmetic that as the numerator
gets larger (in this case the numerator is
the large growth style) relative to the
value denominator, the plotted result
will begin to get larger. Obviously the
opposite is also true, meaning that, as
the denominator (large value) gets
larger relative to the large growth
Dec-78
Dec-79
Dec-80
Dec-81
Dec-82
Dec-83
Dec-84
Dec-85
Dec-86
Dec-87
Dec-88
Dec-89
Dec-90
Dec-91
Dec-92
Dec-93
Dec-94
Dec-95
Dec-96
Dec-97
Dec-98
Dec-99
Dec-00
Dec-01
Dec-02
Dec-03
Dec-04
Dec-05
Sep-06
numerator, the result will get smaller
and smaller. Russell 1000 Growth Index Divided By Russell 1000 Value Index Sinice Inception 12/31/1978
Source: Ned Davis Research, Navellier Applied Research
So, over the entire history of the two
Winter 2006 • Pension Scope • www.mapers.org