SlideShare ist ein Scribd-Unternehmen logo
1 von 17
Downloaden Sie, um offline zu lesen
The highest incidence of poverty
                     in the country is in the mining sector.
                            Is this the industry that’s the hope of our economy?


     Numbers don’t lie.                              I n a swe e p ing study on pover ty conducted by
     Dean Arsenio M. Balisacan of the University of the Philippines School of Economics, data across different
     industries compared the state of workers using various indices of human deprivations, including income
     poverty. The results:
     Poverty is decreasing in most sectors. In mining, it has gone up by 74% since 1988.


                                Poverty Incidence (Population), 1988 - 2009, (in %)                        Truth and the common
              Group: Sector          1988    1991     1994      1997      2000     2003    2006    2009
                                                                                                           good should dictate the
                  Agriculture        56.33   54.61    51.15     47.10      48.28   46.10   47.84   47.92   future of mining in our
                                                                                                           country.
                   MINING            27.84   28.63    30.22     29.50     34.80    41.27   34.64   48.71
                                                                                                           Sign up now.
                Manufacturing        24.29   22.13    15.71     13.72     14.96    14.51   16.19   17.79   www.no2mininginpalawan.com
                    Utilities        8.73    11.41     8.23      7.58      4.43     4.12    7.44   3.23
                Construction         37.21   34.70    29.40      22.27    25.83    21.49   25.19   24.52
                      Trade          21.42   21.31    15.77      13.34    12.89    10.72   13.87   13.12
         Transport & communication   27.28   20.89    18.45      14.33    15.16    12.79   15.62   18.25
                     Finance         10.21    9.27     4.85      3.60      7.37     4.83    4.13   2.54
                    Services         17.42   15.09    12.35      9.76      9.56     9.06   12.41   11.94

       Study by Arsenio M. Balisacan, UP School of Economics, Quezon City, 2011


                                                                                                                              Paid advertisement


PALAWAN poverty ad.indd 1                                                                                                               11/23/11 3:18 PM
Poverty	
  Incidence	
  
                  Table A1. Poverty Incidence (Population), 1988-2009, (in %)
                Group                        1988      1991      1994      1997      2000      2003      2006      2009


Agriculture                                56.33	
   54.61	
   51.15	
   47.10	
   48.28	
   46.10	
  47.84 47.92	
  
Mining                                     27.84	
   28.63	
   30.22	
   29.50	
   34.80	
   41.27	
   34.64	
   48.71	
  
Manufacturing                              24.29	
   22.13	
   15.71	
   13.72	
   14.96	
   14.51	
   16.19	
   17.79	
  
Utilities                                   8.73	
   11.41	
   8.23	
   7.58	
   4.43	
   4.12	
   7.44	
   3.23	
  
Construction                               37.21	
   34.70	
   29.40	
   22.27	
   25.83	
   21.49	
   25.19	
   24.52	
  
Trade                                      21.42	
   21.31	
   15.77	
   13.34	
   12.89	
   10.72	
   13.87	
   13.12	
  
Transportation & Communication             27.28	
   20.89	
   18.45	
   14.33	
   15.16	
   12.79	
   15.62	
   18.25	
  
Finance                                    10.21	
   9.27	
   4.85	
   3.60	
   7.37	
   4.83	
   4.13	
   2.54	
  
Services                                   17.42	
   15.09	
   12.35	
   9.76	
   9.56	
   9.06	
   12.41	
   11.94	
  
Unemployed                                 23.28	
   19.53	
   16.81	
   13.01	
   13.13	
   10.51	
   12.65	
   12.83	
  
B1	
  
                  Table B1. Poverty Incidence (Household), 1988-2009, (in %)
                Group                       1988       1991       1994       1997       2000       2003       2006       2009

Agriculture                                50.28	
   48.46	
   44.59	
   40.47	
   41.04	
   38.80	
   40.08	
   39.60	
  
Mining                                     23.92	
   24.11	
   28.18	
   22.82	
   27.60	
   33.90	
   28.16	
   41.40	
  
Manufacturing                              20.36	
   18.42	
   13.40	
   11.25	
   12.04	
   10.97	
   12.92	
   13.74	
  
Utilities                                   7.00	
     9.46	
     5.89	
     7.50	
     4.37	
     2.85	
     4.88	
     2.53	
  
Construction                               32.20	
   29.31	
   24.26	
   18.20	
   20.85	
   16.82	
   20.10	
   19.15	
  
Trade                                      18.04	
   17.43	
   13.14	
   10.95	
   10.21	
         8.00	
   10.53	
      9.72	
  
Transportation & Communication             22.79	
   17.66	
   14.76	
   11.67	
   11.74	
         9.97	
   11.96	
   14.01	
  
Finance                                     9.08	
     7.39	
     3.86	
     2.89	
     0.88	
     1.14	
     0.26	
     1.89	
  
Services                                   14.78	
   12.73	
   10.29	
       7.91	
     7.74	
     6.42	
     7.93	
     8.98	
  
Unemployed                                 20.18	
   17.90	
   15.24	
   11.16	
   11.32	
         8.90	
   10.14	
   10.75	
  
C1	
  
                      Table C1. Poverty Gap (Population), 1988-2009 (in %)
              Group              1988          1991         1994         1997         2000         2003         2006        2009

Agriculture                        19.30	
      18.42	
      16.87	
      15.10	
      15.11	
      14.54	
   14.74	
   14.22	
  
Mining                              8.43	
       7.58	
       6.66	
      11.48	
       8.21	
      11.17	
   11.54	
   13.80	
  
Manufacturing                       6.36	
       5.83	
       3.82	
       3.29	
       3.70	
       3.68	
      3.86	
      4.34	
  
Utilities                           2.53	
       2.48	
       1.93	
       2.34	
       1.17	
       0.69	
      0.82	
      0.78	
  
Construction                        9.49	
       8.99	
       7.36	
       5.11	
       6.69	
       4.99	
      6.25	
      5.65	
  
Trade                               5.31	
       5.78	
       4.02	
       3.09	
       3.06	
       2.42	
      3.32	
      3.09	
  
Transportation &
Communication                       6.58	
       5.44	
       4.40	
       3.23	
       3.73	
       2.83	
      3.84	
      3.96	
  
Finance                             2.06	
       2.04	
       1.13	
       0.47	
       0.25	
       0.21	
      0.11	
      0.49	
  
Services                            4.58	
       3.79	
       2.92	
       2.41	
       2.35	
       2.04	
      2.62	
      2.85	
  
Unemployed                          6.13	
       5.54	
       4.47	
       3.52	
       3.42	
       2.63	
      3.15	
      2.98	
  
G1	
  
                      Table G1. Average Per Capita Income, 1988-2009 (in 2009 prices)
              Group                     1988            1991           1994           1997           2000            2003          2006          2009


Agriculture                          20,108	
  	
   20,701	
  	
   21,321	
  	
   24,031	
  	
   24,053	
  	
   24,327	
  	
   23,818	
  	
   24,042	


Mining                               27,172	
  	
   35,591	
  	
   34,279	
  	
   33,944	
  	
   31,167	
  	
   31,991	
  	
   25,902	
  	
   24,095	


Manufacturing                        38,003	
  	
   42,602	
  	
   48,702	
  	
   58,058	
  	
   53,539	
  	
   54,657	
  	
   48,457	
  	
   45,404	


Utilities                            53,145	
  	
   49,526	
  	
   58,280	
  	
   69,233	
  	
   74,274	
  	
   88,364	
  	
   71,907	
  	
   70,837	


Construction                         27,669	
  	
   31,258	
  	
   29,984	
  	
   39,997	
  	
   35,539	
  	
   36,692	
  	
   34,401	
  	
   32,636	


Trade                                45,336	
  	
   49,540	
  	
   51,530	
  	
   60,451	
  	
   56,827	
  	
   59,488	
  	
   55,703	
  	
   56,179	
  	
  
Transportation &
Communication                        32,982	
  	
   43,168	
  	
   39,599	
  	
   46,522	
  	
   46,702	
  	
   46,055	
  	
   45,471	
  	
   42,434	


Finance                              71,644	
  	
   79,666	
  	
   76,820	
  	
   121,589	
  	
  123,936	
  	
  108,788	
  	
  100,740	
  115,482	


Services                             46,420	
  	
   49,921	
  	
   50,973	
  	
   66,865	
  	
   75,689	
  	
   70,149	
  	
   68,403	
  	
   64,920	


Unemployed                           42,825	
  	
   46,908	
  	
   48,849	
  	
   59,241	
  	
   62,586	
  	
   66,606	
  	
   62,858	
  	
   57,949	
  	
  
G2	
  
                   Table G2. Average Household Income, 1988-2009 (in 2009 prices)
              Group                 1988    1991    1994     1997     2000     2003                                         2006          2009


Agriculture                       108,962	
  	
  110,819	
  	
  114,839	
  	
  124,921	
  	
  126,148	
  	
  122,277	
  	
  119,036	
  118,670	


Mining                            155,031	
  	
  195,455	
  	
  191,418	
  	
  181,801	
  	
  173,991	
  	
  157,890	
  	
  136,101	
  129,670	


Manufacturing                     200,152	
  	
  225,842	
  	
  260,475	
  	
  295,644	
  	
  279,063	
  	
  251,739	
  	
  231,030	
  213,964	


Utilities                         274,956	
  	
  293,445	
  	
  332,639	
  	
  375,899	
  	
  403,118	
  	
  444,332	
  	
  371,436	
  375,311	


Construction                      157,705	
  	
  179,567	
  	
  172,330	
  	
  220,783	
  	
  197,478	
  	
  190,790	
  	
  183,442	
  171,468	


Trade                             232,964	
  	
  253,631	
  	
  262,861	
  	
  303,898	
  	
  283,210	
  	
  277,707	
  	
  258,304	
  255,887	


Transportation &
Communication                     185,707	
  	
  237,471	
  	
  220,771	
  	
  249,000	
  	
  250,245	
  	
  230,769	
  	
  228,438	
  208,657	


Finance                           377,192	
  	
  414,605	
  	
  400,860	
  	
  615,600	
  	
  617,844	
  	
  499,009	
  	
  441,000	
  514,254	


Services                          246,681	
  	
  269,579	
  	
  272,679	
  	
  342,596	
  	
  387,003	
  	
  332,043	
  	
  325,700	
  303,076	


Unemployed                        200,922	
  	
  218,222	
  	
  229,105	
  	
  272,447	
  	
  284,320	
  	
  284,574	
  	
  272,901	
  246,597	


Table J1. Subsistence Incidence (Household), 1988-2009, (in %)
                             Group                                1988     1991        1994       1997   2000   2003   2006   2009
Philippines                                                       19.1      18.6       15.1      10.4     9.5    7.8    8.2    7.6
 Locality
   Urban                                                           7.8      10.0        7.5       3.7     3.2    2.4    2.8    2.6
   Rural                                                          25.9      27.1       22.7      16.5    15.5   13.1   13.5   12.5
 Region
   Ilocos Region                                                  16.3      16.3       12.5       8.1     6.4    4.4    6.5    4.5
   Cagayan Valley                                                 17.8      17.8       12.2       5.8     4.1    3.2    3.0    3.2
   Central Luzon                                                  10.8       9.5        9.7       3.3     3.1    1.8    2.7    2.9
   CALABARZON                                                     18.4      11.2        7.7       4.7     3.3    2.5    2.4    2.3
   MIMAROPA                                                       29.1      24.5       16.8      12.0    12.3   11.4   14.0   11.1
   Bicol Region                                                   32.0      33.1       28.6      20.1    21.2   15.9   15.5   10.6
   Western Visayas                                                18.1      18.8       13.5       7.6     9.5    7.2    6.6    6.8
   Central Visayas                                                35.7      31.9       26.9      20.8    19.8   17.8   18.4   15.6
   Eastern Visayas                                                25.3      27.2       24.4      22.3    16.3   11.1   12.3   14.0
   Zamboanga Peninsula                                            21.0      22.4       23.6      12.1    20.0   23.5   19.5   20.2
   Northern Mindanao                                              22.8      30.4       26.1      18.5    18.1   16.2   16.1   15.2
   Davao Region                                                   25.3      25.2       22.6      16.8    11.5   11.7   11.5   11.0
   SOCCSKSARGEN                                                   27.1      28.9       22.9      17.8    11.4    9.3   10.7   10.1
   NCR                                                             5.0       1.9        0.8       0.7     0.6    0.4    0.5    0.6
   CAR                                                            15.5      24.1       14.6      11.3     8.5    4.4    5.1    4.7
   ARMM                                                            6.1      12.5        5.3       4.1     7.5    7.6   11.5    8.6
   CARAGA                                                         16.9      26.1       23.7      19.9    14.8   16.2   14.7   18.4
 Sector
   Agriculture                                                    30.2      29.8       25.5      19.5    18.4   16.2   16.8   15.5
   Mining                                                         13.6      19.1       15.3      14.2     7.7   16.2   15.9   19.8
   Manufacturing                                                  11.9      11.1        6.6       4.2     4.5    3.8    3.7    5.0
   Utilities                                                       4.1       7.0        2.8       2.1     1.1    0.8    0.8    1.0
   Construction                                                   18.1      18.8       15.2       7.5    10.0    5.7    6.9    7.0
   Trade                                                           8.3       9.3        6.2       3.7     3.8    2.5    3.5    2.7
   Transportation & Communication                                 12.0      10.2        7.6       4.3     4.2    3.2    3.8    3.9
   Finance                                                         3.0       3.7        0.8       0.6     0.1    0.3    0.3    0.4
Services                                                      7.8    6.6    4.8    3.4    2.7    2.1    2.8    2.9
 Unemployed                                                    9.7    8.9    8.1    4.7    4.3    2.8    3.5    3.4
Class of Worker
 Worked for private household                                 25.7   25.9   27.9   15.7   15.0    7.5    7.2    8.2
 Worked for private establishment                             17.6   17.3   13.7    8.0    9.2    6.6    7.8    8.2
 Worked for government/government corporation                  3.5    4.8    4.2    2.7    2.4    2.0    2.2    2.6
 Worked with pay in own family-operated farm or business      14.2   25.2   16.3    3.2    8.2   10.5    5.5   17.6
 Worked without pay in own family-operated farm or business    8.8   14.4   13.9    5.8    4.4    3.4    3.9    6.0
 Self-employed without any employee                           26.2   25.4   20.3   15.7   13.7   12.5   12.6   10.9
 Employer in own family-operated farm or business              8.4   10.9    9.5    6.0    8.0    6.1    5.6    5.3
Educational Attainment
 No Education                                                 25.8   30.1   24.7   18.4   20.4   21.6   22.1   23.6
 Elementary Undergraduate                                     30.8   28.8   25.0   19.2   14.0   16.7   16.5   16.2
 Elementary Graduate                                          23.4   23.2   18.7   12.8    4.6    9.5   11.1    9.4
 Highschool Undergraduate                                     17.0   17.9   14.2    9.3    2.0    6.6    7.8    7.6
 Highschool Graduate                                           8.7    9.2    6.7    4.7    1.9    3.1    3.5    3.4
 College Undergraduate                                         3.7    4.0    2.9    1.6    2.1    1.1    1.1    1.1
 College Graduate                                              0.9    0.6    0.5    0.5    0.2    0.2    0.2    0.2
Table I2. Subsistence Magnitude (Population), 1988-2009
                             Group                                         1988           1991            1994                                        1997                    2000                   2003                   2006                   2009
Philippines                                                            12,892,506              14,117,372              12,502,631         9,628,161                    9,784,395               8,521,505              9,503,252              9,239,844
 Locality
   Urban                                                                 2,103,575               3,853,240               3,178,146         1,708,068                   1,669,330               1,382,443              1,694,741              1,710,490
   Rural                                                               10,788,931              10,264,132                9,324,485         7,920,093                   8,115,065               7,139,062              7,808,511              7,529,354
 Region
   Ilocos Region                                                             692,899                 713,387                 597,848                444,807               394,170                 286,570                423,728                328,512
   Cagayan Valley                                                            478,122                 512,074                 413,869                223,957               150,437                 122,925                135,619                138,375
   Central Luzon                                                             759,344                 771,938                 863,612                340,629               364,474                 243,558                356,804                391,441
   CALABARZON                                                            1,087,530                   907,343                 677,249                456,037               397,569                 348,529                376,789                408,138
   MIMAROPA                                                                  598,344                 550,534                 410,907                334,408               398,300                 379,161                506,038                439,929
   Bicol Region                                                          1,568,857               1,783,749               1,632,829              1,306,101              1,564,174               1,045,344              1,125,442                 791,610
   Western Visayas                                                       1,155,058               1,357,539               1,076,511                  656,932               846,500                 665,868                633,527                666,102
   Central Visayas                                                       1,712,419               1,645,877               1,517,823              1,297,315              1,318,973               1,325,414              1,460,679              1,362,527
   Eastern Visayas                                                           943,314             1,091,991               1,060,489              1,043,204                 779,066                 598,912                696,395                794,891
   Zamboanga Peninsula                                                       532,954                 615,225                 674,953                396,066               701,468                 813,894                764,238                794,143
   Northern Mindanao                                                         693,219             1,070,093               1,004,069                  802,115               821,894                 753,103                831,395                815,939
   Davao Region                                                              804,625                 858,153                 848,391                722,063               579,932                 606,658                614,908                621,576
   SOCCSKSARGEN                                                              671,044                 785,202                 650,927                635,345               535,900                 451,594                528,467                539,846
   NCR                                                                       503,690                 237,162                 124,207                103,148                  89,765                  72,278                 92,829              109,637
   CAR                                                                       216,877                 357,436                 237,160                208,062               173,285                    90,362              110,029                102,294
   ARMM                                                                      146,097                 293,766                 152,449                139,858               246,375                 276,494                424,099                364,751
   CARAGA                                                                    328,113                 565,904                 559,339                518,112               422,114                 440,839                422,269                570,131
 Sector
   Agriculture                                                           9,032,623               9,913,353               9,029,004              7,134,908              6,855,747               6,298,934              6,605,825              6,133,595
   Mining                                                                      87,128                115,732                   55,986                 86,830                 89,695                  68,758                 87,111              113,775
   Manufacturing                                                             611,325                 676,935                 373,027                261,937               326,674                 302,674                261,345                354,055
   Utilities                                                                   15,175                  30,058                  13,749                 12,085                   4,206                   3,695                  4,391                  7,344
   Construction                                                              675,718                 870,612                 821,498                550,528               701,270                 463,728                574,110                641,190
   Trade                                                                     475,709                 578,468                 441,028                311,711               426,257                 320,997                496,858                430,496
   Transportation & Communication                                            556,389                 486,008                 472,320                317,931               420,789                 364,243                433,600                417,797
   Finance                                                                     34,531                  45,511                  12,200                 12,049                      774                  1,692                  1,364                  1,631
   Services                                                                  663,032                 634,669                 462,553                393,909               363,564                 308,473                448,034                543,668
   Unemployed                                                                655,314                 766,026                 816,174                546,274               595,420                 388,310                590,616                596,293
 Class of Worker
  Worked for private household                                               468,000                 471,656                 579,995                350,081               303,894                 117,568                103,780                187,091
  Worked for private establishment                                       3,589,407               3,719,298               3,278,098              2,286,620              2,778,716               2,509,909              2,936,118              3,203,710
  Worked for government/government corporation                               203,247                 293,734                 245,155                174,447               205,747                 149,580                175,334                229,883
  Worked with pay in own family-operated farm or business                      12,883                  28,509                  16,955                   5,430                17,112                  14,825                   8,739                  8,269
  Worked without pay in own family-operated farm or business                   29,020                  86,535                131,212                  26,739                 38,166                  24,985                 25,704                 48,246
  Self-employed without any employee                                     7,649,719               8,288,663               7,042,724              5,932,224              5,167,714               4,730,318              5,154,984              4,412,503
Employer in own family-operated farm or business                284,916                 462,953                 392,318             310,093                 677,627               586,010               507,979               553,848
Educational Attainment
 No Education                                                    900,680             1,048,903                   888,734                627,997              746,084               662,720               611,361               694,708
 Elementary Undergraduate                                    5,597,781               5,645,934               5,062,849              4,078,853             7,733,674             3,879,443             4,085,053             4,024,873
 Elementary Graduate                                         3,916,210               4,383,913               3,982,864              2,917,220             1,016,281             2,122,844             2,529,686             2,211,062
 Highschool Undergraduate                                    1,272,575               1,531,763               1,304,627                  982,428              220,377               916,106            1,183,540             1,142,660
 Highschool Graduate                                             939,068             1,188,358               1,003,875                  821,594                 26,079             764,041               905,810               979,097
 College Undergraduate                                           210,216                 277,073                 227,261                156,197                 21,360             147,448               157,391               166,180
 College Graduate                                                  55,977                  41,427                  32,420                 43,873                20,540                28,904                30,412                21,264
Table J2. Subsistence Magnitude (Household), 1988-2009
                             Group                                         1988          1991          1994           1997                                                    2000                    2003                    2006                    2009
Philippines                                                              2,009,167              2,226,338              1,928,671              1,473,514               1,448,112                1,287,853               1,427,753               1,398,231
 Locality
   Urban                                                                    310,657                593,199                473,795                 247,177                241,181                  199,169                 242,406                 240,089
   Rural                                                                 1,698,509              1,633,139              1,454,876              1,226,338               1,206,932                1,088,685               1,185,347               1,158,142
 Region
   Ilocos Region                                                            102,030                109,786                   88,134                 63,356                  51,605                   38,910                  61,329                  45,487
   Cagayan Valley                                                              77,747                 86,920                 63,590                 33,810                  23,088                   18,976                  18,731                  20,699
   Central Luzon                                                            115,103                116,864                126,379                   49,030                  47,964                   31,882                  52,127                  58,137
   CALABARZON                                                               171,627                136,754                100,914                   69,747                  59,435                   54,409                  54,885                  56,016
   MIMAROPA                                                                    94,310                 88,422                 64,793                 50,915                  55,149                   56,874                  76,580                  65,281
   Bicol Region                                                             235,912                272,347                251,338                 194,848                232,488                  150,458                 156,194                 113,217
   Western Visayas                                                          173,256                201,459                152,836                   95,203               115,491                     90,950                  90,634                  98,674
   Central Visayas                                                          296,176                288,690                256,628                 218,047                218,668                  216,657                 237,623                 214,589
   Eastern Visayas                                                          151,621                180,002                169,508                 167,184                119,973                     83,977                  99,915               121,497
   Zamboanga Peninsula                                                         79,994                 96,198              107,734                   60,551               108,506                  137,718                 121,430                 133,449
   Northern Mindanao                                                        111,768                168,581                154,809                 123,045                124,540                  119,792                 127,177                 127,778
   Davao Region                                                             123,507                138,086                132,048                 110,135                   83,383                   94,601                  96,340                  96,931
   SOCCSKSARGEN                                                                98,802              119,542                102,103                   97,895                  76,622                   65,771                  80,475                  80,674
   NCR                                                                         71,836                 31,290                 14,787                 13,139                  13,297                     8,480                 12,069                  14,615
   CAR                                                                         33,017                 54,839                 35,268                 29,165                  23,491                   12,351                  15,517                  15,175
   ARMM                                                                        21,667                 48,666                 21,851                 16,755                  33,980                   38,542                  61,638                  49,293
   CARAGA                                                                      50,796                 87,892                 85,953                 80,688                  60,432                   67,505                  65,093                  86,720
 Sector
   Agriculture                                                           1,404,345              1,563,340              1,382,035              1,092,885               1,009,805                   956,581                 992,336                 925,623
   Mining                                                                      12,636                 17,124                   9,007                11,305                  12,220                   10,456                  12,247                  17,351
   Manufacturing                                                               97,522              103,309                   58,629                 41,796                  48,213                   46,600                  41,506                  54,398
   Utilities                                                                     2,231                  4,576                  1,992                  1,941                      805                      528                     627                     789
   Construction                                                                96,435              126,387                117,497                   76,267                  99,949                   64,422                  76,845                  85,050
   Trade                                                                       74,084                 91,170                 66,076                 46,829                  62,407                   47,395                  74,328                  59,828
   Transportation & Communication                                              78,774                 73,232                 64,779                 46,409                  56,715                   50,331                  60,713                  62,326
   Finance                                                                       5,328                  7,212                  1,695                  1,689                        97                     282                     273                     466
   Services                                                                 102,794                   93,613                 73,716                 60,313                  51,732                   45,289                  67,916                  79,786
   Unemployed                                                               121,357                146,375                152,191                   94,080               106,169                     65,969               100,963                 112,615
 Class of Worker
  Worked for private household                                                 76,578                 77,884                 94,212                 57,030                  46,796                   18,648                  18,610                  28,101
  Worked for private establishment                                          548,326                578,302                487,315                 338,509                401,020                  366,020                 427,153                 476,134
  Worked for government/government corporation                                 27,865                 40,555                 36,258                 25,087                  26,885                   21,472                  24,260                  32,377
  Worked with pay in own family-operated farm or business                        1,942                  6,064                  2,879                      
                                                                                                                                                         776                  2,280                    2,252                   1,474                   1,138
  Worked without pay in own family-operated farm or business                     4,387                14,870                 23,006                   4,604                   5,827                    4,167                   3,823                   6,914
  Self-employed without any employee                                     1,188,235              1,294,703              1,073,583                  909,061                757,167                  725,043                 777,148                 661,323
Employer in own family-operated farm or business                40,477                 67,583                 59,226                 44,835              101,969                   84,283                 74,323                 79,631
Educational Attainment
 No Education                                                 159,233                198,501                163,392                 114,061               127,212                113,875                105,488                114,916
 Elementary Undergraduate                                     885,832                895,493                793,981                 631,729            1,137,992                 596,278                630,607                620,694
 Elementary Graduate                                          591,104                667,888                589,609                 425,896               142,144                307,754                365,226                326,710
 Highschool Undergraduate                                     191,461                235,518                193,801                 146,002                  31,927              136,329                167,682                166,518
 Highschool Graduate                                          139,408                181,094                150,050                 124,446                    3,517             109,260                131,358                142,007
 College Undergraduate                                           33,989                 41,288                 32,817                 24,594                   2,275                20,413                 23,526                 24,013
 College Graduate                                                  8,139                  6,556                  5,020                  6,787                  3,046                  3,945                  3,866                  3,373
$	
  14-­‐B	
  Investments	
  in	
  Mining	
  Eyed	
  from	
  China	
  
                     Inquirer,	
  September	
  7,	
  2011	
  
MacroAsia,	
  Jinchuan	
  to	
  invest	
  $1	
  B	
  in	
  nickel	
  mine	
  
          The	
  Philippine	
  Star	
  (Business),	
  September	
  8,	
  2011	
  
Mining	
  in	
  Surigao	
  del	
  Sur	
  (September	
  2010)	
  
Canatuan Mining, Production & Shipment


                                         9

Weitere ähnliche Inhalte

Ähnlich wie Poverty in Mining Sector Rises 74

statistical abstract
statistical abstractstatistical abstract
statistical abstractruchisingh77
 
Red Cross and Red Crescent World Disaster Report - Selected Data Tables
Red Cross and Red Crescent World Disaster Report - Selected Data TablesRed Cross and Red Crescent World Disaster Report - Selected Data Tables
Red Cross and Red Crescent World Disaster Report - Selected Data TablesRichard Allaway
 
2008- Useche’s Course - 2001 Impact Ven. Agrarian Reform
2008- Useche’s Course - 2001 Impact Ven. Agrarian Reform2008- Useche’s Course - 2001 Impact Ven. Agrarian Reform
2008- Useche’s Course - 2001 Impact Ven. Agrarian ReformAlfonso Sintjago
 
Fundamental Equity Analysis - World Gold Miners
Fundamental Equity Analysis - World Gold MinersFundamental Equity Analysis - World Gold Miners
Fundamental Equity Analysis - World Gold MinersBCV
 
présidentielle : les votes en Belgique
présidentielle : les votes en Belgiqueprésidentielle : les votes en Belgique
présidentielle : les votes en Belgiquelesoirbe
 
Table 7, mdg 7 ensure environmental sustainability
Table 7, mdg 7  ensure environmental sustainabilityTable 7, mdg 7  ensure environmental sustainability
Table 7, mdg 7 ensure environmental sustainabilityBread for the World
 
The State of EFW in Canada: An Overview of Policy Options and Political Chall...
The State of EFW in Canada: An Overview of Policy Options and Political Chall...The State of EFW in Canada: An Overview of Policy Options and Political Chall...
The State of EFW in Canada: An Overview of Policy Options and Political Chall...SWANA Northern Lights Chapter
 
Cement industry
Cement industryCement industry
Cement industryRavi Gupta
 
City of Cape Town Water Tariff History 2010 to 2018 by David Lipschitz
City of Cape Town Water Tariff History 2010 to 2018 by David LipschitzCity of Cape Town Water Tariff History 2010 to 2018 by David Lipschitz
City of Cape Town Water Tariff History 2010 to 2018 by David LipschitzDavid Lipschitz
 
Local_and_Regional_Authorities_Facing_Climate_Change__examples_and_good_pract...
Local_and_Regional_Authorities_Facing_Climate_Change__examples_and_good_pract...Local_and_Regional_Authorities_Facing_Climate_Change__examples_and_good_pract...
Local_and_Regional_Authorities_Facing_Climate_Change__examples_and_good_pract...Cédric van Riel
 
บรรยายภาวะเศรษฐกิจวิทยาลัยกองทัพบก 25 ธันวาคม 2555
บรรยายภาวะเศรษฐกิจวิทยาลัยกองทัพบก 25 ธันวาคม 2555บรรยายภาวะเศรษฐกิจวิทยาลัยกองทัพบก 25 ธันวาคม 2555
บรรยายภาวะเศรษฐกิจวิทยาลัยกองทัพบก 25 ธันวาคม 2555ชำนิ รักษายศ
 
Stat word-assign-
Stat word-assign-Stat word-assign-
Stat word-assign-tanvir616
 

Ähnlich wie Poverty in Mining Sector Rises 74 (20)

Bravee
BraveeBravee
Bravee
 
Philippine Trade Policies and Agriculture Domestic System
Philippine Trade Policies and Agriculture Domestic SystemPhilippine Trade Policies and Agriculture Domestic System
Philippine Trade Policies and Agriculture Domestic System
 
statistical abstract
statistical abstractstatistical abstract
statistical abstract
 
Eco dev final
Eco dev finalEco dev final
Eco dev final
 
Red Cross and Red Crescent World Disaster Report - Selected Data Tables
Red Cross and Red Crescent World Disaster Report - Selected Data TablesRed Cross and Red Crescent World Disaster Report - Selected Data Tables
Red Cross and Red Crescent World Disaster Report - Selected Data Tables
 
2008- Useche’s Course - 2001 Impact Ven. Agrarian Reform
2008- Useche’s Course - 2001 Impact Ven. Agrarian Reform2008- Useche’s Course - 2001 Impact Ven. Agrarian Reform
2008- Useche’s Course - 2001 Impact Ven. Agrarian Reform
 
Food security in_india
Food security in_indiaFood security in_india
Food security in_india
 
Fundamental Equity Analysis - World Gold Miners
Fundamental Equity Analysis - World Gold MinersFundamental Equity Analysis - World Gold Miners
Fundamental Equity Analysis - World Gold Miners
 
présidentielle : les votes en Belgique
présidentielle : les votes en Belgiqueprésidentielle : les votes en Belgique
présidentielle : les votes en Belgique
 
Msrdc case study
Msrdc case studyMsrdc case study
Msrdc case study
 
Table 7, mdg 7 ensure environmental sustainability
Table 7, mdg 7  ensure environmental sustainabilityTable 7, mdg 7  ensure environmental sustainability
Table 7, mdg 7 ensure environmental sustainability
 
Results tracker 15.10.11
Results tracker 15.10.11Results tracker 15.10.11
Results tracker 15.10.11
 
CASE Network Studies and Analyses 200 (Part 2) - Institutional arrangements o...
CASE Network Studies and Analyses 200 (Part 2) - Institutional arrangements o...CASE Network Studies and Analyses 200 (Part 2) - Institutional arrangements o...
CASE Network Studies and Analyses 200 (Part 2) - Institutional arrangements o...
 
The State of EFW in Canada: An Overview of Policy Options and Political Chall...
The State of EFW in Canada: An Overview of Policy Options and Political Chall...The State of EFW in Canada: An Overview of Policy Options and Political Chall...
The State of EFW in Canada: An Overview of Policy Options and Political Chall...
 
Cement industry
Cement industryCement industry
Cement industry
 
City of Cape Town Water Tariff History 2010 to 2018 by David Lipschitz
City of Cape Town Water Tariff History 2010 to 2018 by David LipschitzCity of Cape Town Water Tariff History 2010 to 2018 by David Lipschitz
City of Cape Town Water Tariff History 2010 to 2018 by David Lipschitz
 
Local_and_Regional_Authorities_Facing_Climate_Change__examples_and_good_pract...
Local_and_Regional_Authorities_Facing_Climate_Change__examples_and_good_pract...Local_and_Regional_Authorities_Facing_Climate_Change__examples_and_good_pract...
Local_and_Regional_Authorities_Facing_Climate_Change__examples_and_good_pract...
 
บรรยายภาวะเศรษฐกิจวิทยาลัยกองทัพบก 25 ธันวาคม 2555
บรรยายภาวะเศรษฐกิจวิทยาลัยกองทัพบก 25 ธันวาคม 2555บรรยายภาวะเศรษฐกิจวิทยาลัยกองทัพบก 25 ธันวาคม 2555
บรรยายภาวะเศรษฐกิจวิทยาลัยกองทัพบก 25 ธันวาคม 2555
 
Simplified Sensex
Simplified SensexSimplified Sensex
Simplified Sensex
 
Stat word-assign-
Stat word-assign-Stat word-assign-
Stat word-assign-
 

Mehr von No to mining in Palawan

Philippine_ EITI_ Report_Volume_I_Contextual_Information_Final
Philippine_ EITI_ Report_Volume_I_Contextual_Information_FinalPhilippine_ EITI_ Report_Volume_I_Contextual_Information_Final
Philippine_ EITI_ Report_Volume_I_Contextual_Information_FinalNo to mining in Palawan
 
Philippine _EITI_ Report_Volume_II_Reconciliation_Report_Final
Philippine _EITI_ Report_Volume_II_Reconciliation_Report_FinalPhilippine _EITI_ Report_Volume_II_Reconciliation_Report_Final
Philippine _EITI_ Report_Volume_II_Reconciliation_Report_FinalNo to mining in Palawan
 
Philippine_EITI_Annexes_ Volume I_Contextual_Information
Philippine_EITI_Annexes_ Volume I_Contextual_InformationPhilippine_EITI_Annexes_ Volume I_Contextual_Information
Philippine_EITI_Annexes_ Volume I_Contextual_InformationNo to mining in Palawan
 
Speech by Julian Payne, President, Canadian Chamber of Commerce of the Philip...
Speech by Julian Payne, President, Canadian Chamber of Commerce of the Philip...Speech by Julian Payne, President, Canadian Chamber of Commerce of the Philip...
Speech by Julian Payne, President, Canadian Chamber of Commerce of the Philip...No to mining in Palawan
 
Mining Arangkada-3rd-Anniversary-Assesment
Mining Arangkada-3rd-Anniversary-AssesmentMining Arangkada-3rd-Anniversary-Assesment
Mining Arangkada-3rd-Anniversary-AssesmentNo to mining in Palawan
 
Philippine Metallic Mining December 2013
Philippine Metallic Mining December 2013Philippine Metallic Mining December 2013
Philippine Metallic Mining December 2013No to mining in Palawan
 
Intex Breach of Duty to Publicly Disclose Information
Intex Breach of Duty to Publicly Disclose InformationIntex Breach of Duty to Publicly Disclose Information
Intex Breach of Duty to Publicly Disclose InformationNo to mining in Palawan
 
Philippine Mining Production Export Figures
Philippine Mining Production Export FiguresPhilippine Mining Production Export Figures
Philippine Mining Production Export FiguresNo to mining in Palawan
 
CSM Summary Senate Hearing March 19 2013
CSM Summary Senate Hearing March 19 2013CSM Summary Senate Hearing March 19 2013
CSM Summary Senate Hearing March 19 2013No to mining in Palawan
 
Pollution Adjudication Board fines Philex Mining over Clean Water Act Violations
Pollution Adjudication Board fines Philex Mining over Clean Water Act ViolationsPollution Adjudication Board fines Philex Mining over Clean Water Act Violations
Pollution Adjudication Board fines Philex Mining over Clean Water Act ViolationsNo to mining in Palawan
 

Mehr von No to mining in Palawan (20)

Philippine_ EITI_ Report_Volume_I_Contextual_Information_Final
Philippine_ EITI_ Report_Volume_I_Contextual_Information_FinalPhilippine_ EITI_ Report_Volume_I_Contextual_Information_Final
Philippine_ EITI_ Report_Volume_I_Contextual_Information_Final
 
Philippine _EITI_ Report_Volume_II_Reconciliation_Report_Final
Philippine _EITI_ Report_Volume_II_Reconciliation_Report_FinalPhilippine _EITI_ Report_Volume_II_Reconciliation_Report_Final
Philippine _EITI_ Report_Volume_II_Reconciliation_Report_Final
 
Philippine_EITI_Annexes_ Volume I_Contextual_Information
Philippine_EITI_Annexes_ Volume I_Contextual_InformationPhilippine_EITI_Annexes_ Volume I_Contextual_Information
Philippine_EITI_Annexes_ Volume I_Contextual_Information
 
Mining Presentation-11142014
Mining Presentation-11142014Mining Presentation-11142014
Mining Presentation-11142014
 
Cetim cetim's statements at the un
Cetim   cetim's statements at the unCetim   cetim's statements at the un
Cetim cetim's statements at the un
 
Speech by Julian Payne, President, Canadian Chamber of Commerce of the Philip...
Speech by Julian Payne, President, Canadian Chamber of Commerce of the Philip...Speech by Julian Payne, President, Canadian Chamber of Commerce of the Philip...
Speech by Julian Payne, President, Canadian Chamber of Commerce of the Philip...
 
Mining Arangkada-3rd-Anniversary-Assesment
Mining Arangkada-3rd-Anniversary-AssesmentMining Arangkada-3rd-Anniversary-Assesment
Mining Arangkada-3rd-Anniversary-Assesment
 
Philippine Metallic Mining December 2013
Philippine Metallic Mining December 2013Philippine Metallic Mining December 2013
Philippine Metallic Mining December 2013
 
Study Tampakan HRIA
Study Tampakan HRIAStudy Tampakan HRIA
Study Tampakan HRIA
 
Intex Breach of Duty to Publicly Disclose Information
Intex Breach of Duty to Publicly Disclose InformationIntex Breach of Duty to Publicly Disclose Information
Intex Breach of Duty to Publicly Disclose Information
 
Mineral Industry Statistics_May_2013
Mineral Industry Statistics_May_2013Mineral Industry Statistics_May_2013
Mineral Industry Statistics_May_2013
 
Philippine Mining Production Export Figures
Philippine Mining Production Export FiguresPhilippine Mining Production Export Figures
Philippine Mining Production Export Figures
 
Position Paper on Philex Mining Spill
Position Paper on Philex Mining SpillPosition Paper on Philex Mining Spill
Position Paper on Philex Mining Spill
 
CSM Summary Senate Hearing March 19 2013
CSM Summary Senate Hearing March 19 2013CSM Summary Senate Hearing March 19 2013
CSM Summary Senate Hearing March 19 2013
 
Philex Padcal Mine PAB Resolution
Philex Padcal Mine PAB ResolutionPhilex Padcal Mine PAB Resolution
Philex Padcal Mine PAB Resolution
 
Mining Arangkada Assessment_2013
Mining  Arangkada Assessment_2013Mining  Arangkada Assessment_2013
Mining Arangkada Assessment_2013
 
Mining Survey 2012-2013
Mining Survey 2012-2013Mining Survey 2012-2013
Mining Survey 2012-2013
 
Ochoa Tampakan Decision
Ochoa Tampakan DecisionOchoa Tampakan Decision
Ochoa Tampakan Decision
 
Macventures MPSA 016_93_XIII
Macventures MPSA 016_93_XIIIMacventures MPSA 016_93_XIII
Macventures MPSA 016_93_XIII
 
Pollution Adjudication Board fines Philex Mining over Clean Water Act Violations
Pollution Adjudication Board fines Philex Mining over Clean Water Act ViolationsPollution Adjudication Board fines Philex Mining over Clean Water Act Violations
Pollution Adjudication Board fines Philex Mining over Clean Water Act Violations
 

Kürzlich hochgeladen

Call Girls in Dwarka Mor Delhi Contact Us 9654467111
Call Girls in Dwarka Mor Delhi Contact Us 9654467111Call Girls in Dwarka Mor Delhi Contact Us 9654467111
Call Girls in Dwarka Mor Delhi Contact Us 9654467111Sapana Sha
 
Introduction to ArtificiaI Intelligence in Higher Education
Introduction to ArtificiaI Intelligence in Higher EducationIntroduction to ArtificiaI Intelligence in Higher Education
Introduction to ArtificiaI Intelligence in Higher Educationpboyjonauth
 
Industrial Policy - 1948, 1956, 1973, 1977, 1980, 1991
Industrial Policy - 1948, 1956, 1973, 1977, 1980, 1991Industrial Policy - 1948, 1956, 1973, 1977, 1980, 1991
Industrial Policy - 1948, 1956, 1973, 1977, 1980, 1991RKavithamani
 
POINT- BIOCHEMISTRY SEM 2 ENZYMES UNIT 5.pptx
POINT- BIOCHEMISTRY SEM 2 ENZYMES UNIT 5.pptxPOINT- BIOCHEMISTRY SEM 2 ENZYMES UNIT 5.pptx
POINT- BIOCHEMISTRY SEM 2 ENZYMES UNIT 5.pptxSayali Powar
 
mini mental status format.docx
mini    mental       status     format.docxmini    mental       status     format.docx
mini mental status format.docxPoojaSen20
 
Z Score,T Score, Percential Rank and Box Plot Graph
Z Score,T Score, Percential Rank and Box Plot GraphZ Score,T Score, Percential Rank and Box Plot Graph
Z Score,T Score, Percential Rank and Box Plot GraphThiyagu K
 
Grant Readiness 101 TechSoup and Remy Consulting
Grant Readiness 101 TechSoup and Remy ConsultingGrant Readiness 101 TechSoup and Remy Consulting
Grant Readiness 101 TechSoup and Remy ConsultingTechSoup
 
18-04-UA_REPORT_MEDIALITERAСY_INDEX-DM_23-1-final-eng.pdf
18-04-UA_REPORT_MEDIALITERAСY_INDEX-DM_23-1-final-eng.pdf18-04-UA_REPORT_MEDIALITERAСY_INDEX-DM_23-1-final-eng.pdf
18-04-UA_REPORT_MEDIALITERAСY_INDEX-DM_23-1-final-eng.pdfssuser54595a
 
Employee wellbeing at the workplace.pptx
Employee wellbeing at the workplace.pptxEmployee wellbeing at the workplace.pptx
Employee wellbeing at the workplace.pptxNirmalaLoungPoorunde1
 
Sanyam Choudhary Chemistry practical.pdf
Sanyam Choudhary Chemistry practical.pdfSanyam Choudhary Chemistry practical.pdf
Sanyam Choudhary Chemistry practical.pdfsanyamsingh5019
 
How to Make a Pirate ship Primary Education.pptx
How to Make a Pirate ship Primary Education.pptxHow to Make a Pirate ship Primary Education.pptx
How to Make a Pirate ship Primary Education.pptxmanuelaromero2013
 
Web & Social Media Analytics Previous Year Question Paper.pdf
Web & Social Media Analytics Previous Year Question Paper.pdfWeb & Social Media Analytics Previous Year Question Paper.pdf
Web & Social Media Analytics Previous Year Question Paper.pdfJayanti Pande
 
Activity 01 - Artificial Culture (1).pdf
Activity 01 - Artificial Culture (1).pdfActivity 01 - Artificial Culture (1).pdf
Activity 01 - Artificial Culture (1).pdfciinovamais
 
A Critique of the Proposed National Education Policy Reform
A Critique of the Proposed National Education Policy ReformA Critique of the Proposed National Education Policy Reform
A Critique of the Proposed National Education Policy ReformChameera Dedduwage
 
BASLIQ CURRENT LOOKBOOK LOOKBOOK(1) (1).pdf
BASLIQ CURRENT LOOKBOOK  LOOKBOOK(1) (1).pdfBASLIQ CURRENT LOOKBOOK  LOOKBOOK(1) (1).pdf
BASLIQ CURRENT LOOKBOOK LOOKBOOK(1) (1).pdfSoniaTolstoy
 
1029 - Danh muc Sach Giao Khoa 10 . pdf
1029 -  Danh muc Sach Giao Khoa 10 . pdf1029 -  Danh muc Sach Giao Khoa 10 . pdf
1029 - Danh muc Sach Giao Khoa 10 . pdfQucHHunhnh
 
Mastering the Unannounced Regulatory Inspection
Mastering the Unannounced Regulatory InspectionMastering the Unannounced Regulatory Inspection
Mastering the Unannounced Regulatory InspectionSafetyChain Software
 
Q4-W6-Restating Informational Text Grade 3
Q4-W6-Restating Informational Text Grade 3Q4-W6-Restating Informational Text Grade 3
Q4-W6-Restating Informational Text Grade 3JemimahLaneBuaron
 

Kürzlich hochgeladen (20)

Call Girls in Dwarka Mor Delhi Contact Us 9654467111
Call Girls in Dwarka Mor Delhi Contact Us 9654467111Call Girls in Dwarka Mor Delhi Contact Us 9654467111
Call Girls in Dwarka Mor Delhi Contact Us 9654467111
 
Introduction to ArtificiaI Intelligence in Higher Education
Introduction to ArtificiaI Intelligence in Higher EducationIntroduction to ArtificiaI Intelligence in Higher Education
Introduction to ArtificiaI Intelligence in Higher Education
 
Industrial Policy - 1948, 1956, 1973, 1977, 1980, 1991
Industrial Policy - 1948, 1956, 1973, 1977, 1980, 1991Industrial Policy - 1948, 1956, 1973, 1977, 1980, 1991
Industrial Policy - 1948, 1956, 1973, 1977, 1980, 1991
 
POINT- BIOCHEMISTRY SEM 2 ENZYMES UNIT 5.pptx
POINT- BIOCHEMISTRY SEM 2 ENZYMES UNIT 5.pptxPOINT- BIOCHEMISTRY SEM 2 ENZYMES UNIT 5.pptx
POINT- BIOCHEMISTRY SEM 2 ENZYMES UNIT 5.pptx
 
Staff of Color (SOC) Retention Efforts DDSD
Staff of Color (SOC) Retention Efforts DDSDStaff of Color (SOC) Retention Efforts DDSD
Staff of Color (SOC) Retention Efforts DDSD
 
mini mental status format.docx
mini    mental       status     format.docxmini    mental       status     format.docx
mini mental status format.docx
 
Z Score,T Score, Percential Rank and Box Plot Graph
Z Score,T Score, Percential Rank and Box Plot GraphZ Score,T Score, Percential Rank and Box Plot Graph
Z Score,T Score, Percential Rank and Box Plot Graph
 
Grant Readiness 101 TechSoup and Remy Consulting
Grant Readiness 101 TechSoup and Remy ConsultingGrant Readiness 101 TechSoup and Remy Consulting
Grant Readiness 101 TechSoup and Remy Consulting
 
18-04-UA_REPORT_MEDIALITERAСY_INDEX-DM_23-1-final-eng.pdf
18-04-UA_REPORT_MEDIALITERAСY_INDEX-DM_23-1-final-eng.pdf18-04-UA_REPORT_MEDIALITERAСY_INDEX-DM_23-1-final-eng.pdf
18-04-UA_REPORT_MEDIALITERAСY_INDEX-DM_23-1-final-eng.pdf
 
Employee wellbeing at the workplace.pptx
Employee wellbeing at the workplace.pptxEmployee wellbeing at the workplace.pptx
Employee wellbeing at the workplace.pptx
 
Sanyam Choudhary Chemistry practical.pdf
Sanyam Choudhary Chemistry practical.pdfSanyam Choudhary Chemistry practical.pdf
Sanyam Choudhary Chemistry practical.pdf
 
How to Make a Pirate ship Primary Education.pptx
How to Make a Pirate ship Primary Education.pptxHow to Make a Pirate ship Primary Education.pptx
How to Make a Pirate ship Primary Education.pptx
 
TataKelola dan KamSiber Kecerdasan Buatan v022.pdf
TataKelola dan KamSiber Kecerdasan Buatan v022.pdfTataKelola dan KamSiber Kecerdasan Buatan v022.pdf
TataKelola dan KamSiber Kecerdasan Buatan v022.pdf
 
Web & Social Media Analytics Previous Year Question Paper.pdf
Web & Social Media Analytics Previous Year Question Paper.pdfWeb & Social Media Analytics Previous Year Question Paper.pdf
Web & Social Media Analytics Previous Year Question Paper.pdf
 
Activity 01 - Artificial Culture (1).pdf
Activity 01 - Artificial Culture (1).pdfActivity 01 - Artificial Culture (1).pdf
Activity 01 - Artificial Culture (1).pdf
 
A Critique of the Proposed National Education Policy Reform
A Critique of the Proposed National Education Policy ReformA Critique of the Proposed National Education Policy Reform
A Critique of the Proposed National Education Policy Reform
 
BASLIQ CURRENT LOOKBOOK LOOKBOOK(1) (1).pdf
BASLIQ CURRENT LOOKBOOK  LOOKBOOK(1) (1).pdfBASLIQ CURRENT LOOKBOOK  LOOKBOOK(1) (1).pdf
BASLIQ CURRENT LOOKBOOK LOOKBOOK(1) (1).pdf
 
1029 - Danh muc Sach Giao Khoa 10 . pdf
1029 -  Danh muc Sach Giao Khoa 10 . pdf1029 -  Danh muc Sach Giao Khoa 10 . pdf
1029 - Danh muc Sach Giao Khoa 10 . pdf
 
Mastering the Unannounced Regulatory Inspection
Mastering the Unannounced Regulatory InspectionMastering the Unannounced Regulatory Inspection
Mastering the Unannounced Regulatory Inspection
 
Q4-W6-Restating Informational Text Grade 3
Q4-W6-Restating Informational Text Grade 3Q4-W6-Restating Informational Text Grade 3
Q4-W6-Restating Informational Text Grade 3
 

Poverty in Mining Sector Rises 74

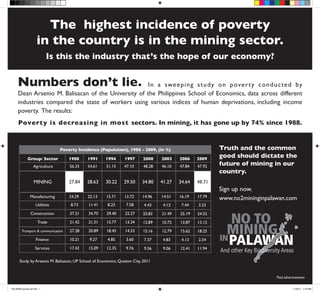
  • 1. The highest incidence of poverty in the country is in the mining sector. Is this the industry that’s the hope of our economy? Numbers don’t lie. I n a swe e p ing study on pover ty conducted by Dean Arsenio M. Balisacan of the University of the Philippines School of Economics, data across different industries compared the state of workers using various indices of human deprivations, including income poverty. The results: Poverty is decreasing in most sectors. In mining, it has gone up by 74% since 1988. Poverty Incidence (Population), 1988 - 2009, (in %) Truth and the common Group: Sector 1988 1991 1994 1997 2000 2003 2006 2009 good should dictate the Agriculture 56.33 54.61 51.15 47.10 48.28 46.10 47.84 47.92 future of mining in our country. MINING 27.84 28.63 30.22 29.50 34.80 41.27 34.64 48.71 Sign up now. Manufacturing 24.29 22.13 15.71 13.72 14.96 14.51 16.19 17.79 www.no2mininginpalawan.com Utilities 8.73 11.41 8.23 7.58 4.43 4.12 7.44 3.23 Construction 37.21 34.70 29.40 22.27 25.83 21.49 25.19 24.52 Trade 21.42 21.31 15.77 13.34 12.89 10.72 13.87 13.12 Transport & communication 27.28 20.89 18.45 14.33 15.16 12.79 15.62 18.25 Finance 10.21 9.27 4.85 3.60 7.37 4.83 4.13 2.54 Services 17.42 15.09 12.35 9.76 9.56 9.06 12.41 11.94 Study by Arsenio M. Balisacan, UP School of Economics, Quezon City, 2011 Paid advertisement PALAWAN poverty ad.indd 1 11/23/11 3:18 PM
  • 2.
  • 3. Poverty  Incidence   Table A1. Poverty Incidence (Population), 1988-2009, (in %) Group 1988 1991 1994 1997 2000 2003 2006 2009 Agriculture 56.33   54.61   51.15   47.10   48.28   46.10  47.84 47.92   Mining 27.84   28.63   30.22   29.50   34.80   41.27   34.64   48.71   Manufacturing 24.29   22.13   15.71   13.72   14.96   14.51   16.19   17.79   Utilities 8.73   11.41   8.23   7.58   4.43   4.12   7.44   3.23   Construction 37.21   34.70   29.40   22.27   25.83   21.49   25.19   24.52   Trade 21.42   21.31   15.77   13.34   12.89   10.72   13.87   13.12   Transportation & Communication 27.28   20.89   18.45   14.33   15.16   12.79   15.62   18.25   Finance 10.21   9.27   4.85   3.60   7.37   4.83   4.13   2.54   Services 17.42   15.09   12.35   9.76   9.56   9.06   12.41   11.94   Unemployed 23.28   19.53   16.81   13.01   13.13   10.51   12.65   12.83  
  • 4. B1   Table B1. Poverty Incidence (Household), 1988-2009, (in %) Group 1988 1991 1994 1997 2000 2003 2006 2009 Agriculture 50.28   48.46   44.59   40.47   41.04   38.80   40.08   39.60   Mining 23.92   24.11   28.18   22.82   27.60   33.90   28.16   41.40   Manufacturing 20.36   18.42   13.40   11.25   12.04   10.97   12.92   13.74   Utilities 7.00   9.46   5.89   7.50   4.37   2.85   4.88   2.53   Construction 32.20   29.31   24.26   18.20   20.85   16.82   20.10   19.15   Trade 18.04   17.43   13.14   10.95   10.21   8.00   10.53   9.72   Transportation & Communication 22.79   17.66   14.76   11.67   11.74   9.97   11.96   14.01   Finance 9.08   7.39   3.86   2.89   0.88   1.14   0.26   1.89   Services 14.78   12.73   10.29   7.91   7.74   6.42   7.93   8.98   Unemployed 20.18   17.90   15.24   11.16   11.32   8.90   10.14   10.75  
  • 5. C1   Table C1. Poverty Gap (Population), 1988-2009 (in %) Group 1988 1991 1994 1997 2000 2003 2006 2009 Agriculture 19.30   18.42   16.87   15.10   15.11   14.54   14.74   14.22   Mining 8.43   7.58   6.66   11.48   8.21   11.17   11.54   13.80   Manufacturing 6.36   5.83   3.82   3.29   3.70   3.68   3.86   4.34   Utilities 2.53   2.48   1.93   2.34   1.17   0.69   0.82   0.78   Construction 9.49   8.99   7.36   5.11   6.69   4.99   6.25   5.65   Trade 5.31   5.78   4.02   3.09   3.06   2.42   3.32   3.09   Transportation & Communication 6.58   5.44   4.40   3.23   3.73   2.83   3.84   3.96   Finance 2.06   2.04   1.13   0.47   0.25   0.21   0.11   0.49   Services 4.58   3.79   2.92   2.41   2.35   2.04   2.62   2.85   Unemployed 6.13   5.54   4.47   3.52   3.42   2.63   3.15   2.98  
  • 6. G1   Table G1. Average Per Capita Income, 1988-2009 (in 2009 prices) Group 1988 1991 1994 1997 2000 2003 2006 2009 Agriculture 20,108     20,701     21,321     24,031     24,053     24,327     23,818     24,042     Mining 27,172     35,591     34,279     33,944     31,167     31,991     25,902     24,095     Manufacturing 38,003     42,602     48,702     58,058     53,539     54,657     48,457     45,404     Utilities 53,145     49,526     58,280     69,233     74,274     88,364     71,907     70,837     Construction 27,669     31,258     29,984     39,997     35,539     36,692     34,401     32,636     Trade 45,336     49,540     51,530     60,451     56,827     59,488     55,703     56,179     Transportation & Communication 32,982     43,168     39,599     46,522     46,702     46,055     45,471     42,434     Finance 71,644     79,666     76,820     121,589    123,936    108,788    100,740  115,482       Services 46,420     49,921     50,973     66,865     75,689     70,149     68,403     64,920     Unemployed 42,825     46,908     48,849     59,241     62,586     66,606     62,858     57,949    
  • 7. G2   Table G2. Average Household Income, 1988-2009 (in 2009 prices) Group 1988 1991 1994 1997 2000 2003 2006 2009 Agriculture 108,962    110,819    114,839    124,921    126,148    122,277    119,036  118,670       Mining 155,031    195,455    191,418    181,801    173,991    157,890    136,101  129,670       Manufacturing 200,152    225,842    260,475    295,644    279,063    251,739    231,030  213,964       Utilities 274,956    293,445    332,639    375,899    403,118    444,332    371,436  375,311       Construction 157,705    179,567    172,330    220,783    197,478    190,790    183,442  171,468       Trade 232,964    253,631    262,861    303,898    283,210    277,707    258,304  255,887       Transportation & Communication 185,707    237,471    220,771    249,000    250,245    230,769    228,438  208,657       Finance 377,192    414,605    400,860    615,600    617,844    499,009    441,000  514,254       Services 246,681    269,579    272,679    342,596    387,003    332,043    325,700  303,076       Unemployed 200,922    218,222    229,105    272,447    284,320    284,574    272,901  246,597      
  • 8. Table J1. Subsistence Incidence (Household), 1988-2009, (in %) Group 1988 1991 1994 1997 2000 2003 2006 2009 Philippines 19.1 18.6 15.1 10.4 9.5 7.8 8.2 7.6 Locality Urban 7.8 10.0 7.5 3.7 3.2 2.4 2.8 2.6 Rural 25.9 27.1 22.7 16.5 15.5 13.1 13.5 12.5 Region Ilocos Region 16.3 16.3 12.5 8.1 6.4 4.4 6.5 4.5 Cagayan Valley 17.8 17.8 12.2 5.8 4.1 3.2 3.0 3.2 Central Luzon 10.8 9.5 9.7 3.3 3.1 1.8 2.7 2.9 CALABARZON 18.4 11.2 7.7 4.7 3.3 2.5 2.4 2.3 MIMAROPA 29.1 24.5 16.8 12.0 12.3 11.4 14.0 11.1 Bicol Region 32.0 33.1 28.6 20.1 21.2 15.9 15.5 10.6 Western Visayas 18.1 18.8 13.5 7.6 9.5 7.2 6.6 6.8 Central Visayas 35.7 31.9 26.9 20.8 19.8 17.8 18.4 15.6 Eastern Visayas 25.3 27.2 24.4 22.3 16.3 11.1 12.3 14.0 Zamboanga Peninsula 21.0 22.4 23.6 12.1 20.0 23.5 19.5 20.2 Northern Mindanao 22.8 30.4 26.1 18.5 18.1 16.2 16.1 15.2 Davao Region 25.3 25.2 22.6 16.8 11.5 11.7 11.5 11.0 SOCCSKSARGEN 27.1 28.9 22.9 17.8 11.4 9.3 10.7 10.1 NCR 5.0 1.9 0.8 0.7 0.6 0.4 0.5 0.6 CAR 15.5 24.1 14.6 11.3 8.5 4.4 5.1 4.7 ARMM 6.1 12.5 5.3 4.1 7.5 7.6 11.5 8.6 CARAGA 16.9 26.1 23.7 19.9 14.8 16.2 14.7 18.4 Sector Agriculture 30.2 29.8 25.5 19.5 18.4 16.2 16.8 15.5 Mining 13.6 19.1 15.3 14.2 7.7 16.2 15.9 19.8 Manufacturing 11.9 11.1 6.6 4.2 4.5 3.8 3.7 5.0 Utilities 4.1 7.0 2.8 2.1 1.1 0.8 0.8 1.0 Construction 18.1 18.8 15.2 7.5 10.0 5.7 6.9 7.0 Trade 8.3 9.3 6.2 3.7 3.8 2.5 3.5 2.7 Transportation & Communication 12.0 10.2 7.6 4.3 4.2 3.2 3.8 3.9 Finance 3.0 3.7 0.8 0.6 0.1 0.3 0.3 0.4
  • 9. Services 7.8 6.6 4.8 3.4 2.7 2.1 2.8 2.9 Unemployed 9.7 8.9 8.1 4.7 4.3 2.8 3.5 3.4 Class of Worker Worked for private household 25.7 25.9 27.9 15.7 15.0 7.5 7.2 8.2 Worked for private establishment 17.6 17.3 13.7 8.0 9.2 6.6 7.8 8.2 Worked for government/government corporation 3.5 4.8 4.2 2.7 2.4 2.0 2.2 2.6 Worked with pay in own family-operated farm or business 14.2 25.2 16.3 3.2 8.2 10.5 5.5 17.6 Worked without pay in own family-operated farm or business 8.8 14.4 13.9 5.8 4.4 3.4 3.9 6.0 Self-employed without any employee 26.2 25.4 20.3 15.7 13.7 12.5 12.6 10.9 Employer in own family-operated farm or business 8.4 10.9 9.5 6.0 8.0 6.1 5.6 5.3 Educational Attainment No Education 25.8 30.1 24.7 18.4 20.4 21.6 22.1 23.6 Elementary Undergraduate 30.8 28.8 25.0 19.2 14.0 16.7 16.5 16.2 Elementary Graduate 23.4 23.2 18.7 12.8 4.6 9.5 11.1 9.4 Highschool Undergraduate 17.0 17.9 14.2 9.3 2.0 6.6 7.8 7.6 Highschool Graduate 8.7 9.2 6.7 4.7 1.9 3.1 3.5 3.4 College Undergraduate 3.7 4.0 2.9 1.6 2.1 1.1 1.1 1.1 College Graduate 0.9 0.6 0.5 0.5 0.2 0.2 0.2 0.2
  • 10. Table I2. Subsistence Magnitude (Population), 1988-2009 Group 1988 1991 1994 1997 2000 2003 2006 2009 Philippines        12,892,506        14,117,372        12,502,631         9,628,161        9,784,395        8,521,505        9,503,252        9,239,844 Locality Urban          2,103,575          3,853,240          3,178,146         1,708,068        1,669,330        1,382,443        1,694,741        1,710,490 Rural        10,788,931        10,264,132          9,324,485         7,920,093        8,115,065        7,139,062        7,808,511        7,529,354 Region Ilocos Region              692,899              713,387              597,848             444,807           394,170           286,570           423,728           328,512 Cagayan Valley              478,122              512,074              413,869             223,957           150,437           122,925           135,619           138,375 Central Luzon              759,344              771,938              863,612             340,629           364,474           243,558           356,804           391,441 CALABARZON          1,087,530              907,343              677,249             456,037           397,569           348,529           376,789           408,138 MIMAROPA              598,344              550,534              410,907             334,408           398,300           379,161           506,038           439,929 Bicol Region          1,568,857          1,783,749          1,632,829         1,306,101        1,564,174        1,045,344        1,125,442           791,610 Western Visayas          1,155,058          1,357,539          1,076,511             656,932           846,500           665,868           633,527           666,102 Central Visayas          1,712,419          1,645,877          1,517,823         1,297,315        1,318,973        1,325,414        1,460,679        1,362,527 Eastern Visayas              943,314          1,091,991          1,060,489         1,043,204           779,066           598,912           696,395           794,891 Zamboanga Peninsula              532,954              615,225              674,953             396,066           701,468           813,894           764,238           794,143 Northern Mindanao              693,219          1,070,093          1,004,069             802,115           821,894           753,103           831,395           815,939 Davao Region              804,625              858,153              848,391             722,063           579,932           606,658           614,908           621,576 SOCCSKSARGEN              671,044              785,202              650,927             635,345           535,900           451,594           528,467           539,846 NCR              503,690              237,162              124,207             103,148              89,765              72,278              92,829           109,637 CAR              216,877              357,436              237,160             208,062           173,285              90,362           110,029           102,294 ARMM              146,097              293,766              152,449             139,858           246,375           276,494           424,099           364,751 CARAGA              328,113              565,904              559,339             518,112           422,114           440,839           422,269           570,131 Sector Agriculture          9,032,623          9,913,353          9,029,004         7,134,908        6,855,747        6,298,934        6,605,825        6,133,595 Mining                87,128              115,732                55,986               86,830              89,695              68,758              87,111           113,775 Manufacturing              611,325              676,935              373,027             261,937           326,674           302,674           261,345           354,055 Utilities                15,175                30,058                13,749               12,085                4,206                3,695                4,391                7,344 Construction              675,718              870,612              821,498             550,528           701,270           463,728           574,110           641,190 Trade              475,709              578,468              441,028             311,711           426,257           320,997           496,858           430,496 Transportation & Communication              556,389              486,008              472,320             317,931           420,789           364,243           433,600           417,797 Finance                34,531                45,511                12,200               12,049                   774                1,692                1,364                1,631 Services              663,032              634,669              462,553             393,909           363,564           308,473           448,034           543,668 Unemployed              655,314              766,026              816,174             546,274           595,420           388,310           590,616           596,293 Class of Worker Worked for private household              468,000              471,656              579,995             350,081           303,894           117,568           103,780           187,091 Worked for private establishment          3,589,407          3,719,298          3,278,098         2,286,620        2,778,716        2,509,909        2,936,118        3,203,710 Worked for government/government corporation              203,247              293,734              245,155             174,447           205,747           149,580           175,334           229,883 Worked with pay in own family-operated farm or business                12,883                28,509                16,955                 5,430              17,112              14,825                8,739                8,269 Worked without pay in own family-operated farm or business                29,020                86,535              131,212               26,739              38,166              24,985              25,704              48,246 Self-employed without any employee          7,649,719          8,288,663          7,042,724         5,932,224        5,167,714        4,730,318        5,154,984        4,412,503
  • 11. Employer in own family-operated farm or business              284,916              462,953              392,318             310,093           677,627           586,010           507,979           553,848 Educational Attainment No Education              900,680          1,048,903              888,734             627,997           746,084           662,720           611,361           694,708 Elementary Undergraduate          5,597,781          5,645,934          5,062,849         4,078,853        7,733,674        3,879,443        4,085,053        4,024,873 Elementary Graduate          3,916,210          4,383,913          3,982,864         2,917,220        1,016,281        2,122,844        2,529,686        2,211,062 Highschool Undergraduate          1,272,575          1,531,763          1,304,627             982,428           220,377           916,106        1,183,540        1,142,660 Highschool Graduate              939,068          1,188,358          1,003,875             821,594              26,079           764,041           905,810           979,097 College Undergraduate              210,216              277,073              227,261             156,197              21,360           147,448           157,391           166,180 College Graduate                55,977                41,427                32,420               43,873              20,540              28,904              30,412              21,264
  • 12. Table J2. Subsistence Magnitude (Household), 1988-2009 Group 1988 1991 1994 1997 2000 2003 2006 2009 Philippines        2,009,167        2,226,338        1,928,671        1,473,514        1,448,112        1,287,853        1,427,753        1,398,231 Locality Urban           310,657           593,199           473,795            247,177           241,181           199,169           242,406           240,089 Rural        1,698,509        1,633,139        1,454,876        1,226,338        1,206,932        1,088,685        1,185,347        1,158,142 Region Ilocos Region           102,030           109,786              88,134              63,356              51,605              38,910              61,329              45,487 Cagayan Valley              77,747              86,920              63,590              33,810              23,088              18,976              18,731              20,699 Central Luzon           115,103           116,864           126,379              49,030              47,964              31,882              52,127              58,137 CALABARZON           171,627           136,754           100,914              69,747              59,435              54,409              54,885              56,016 MIMAROPA              94,310              88,422              64,793              50,915              55,149              56,874              76,580              65,281 Bicol Region           235,912           272,347           251,338            194,848           232,488           150,458           156,194           113,217 Western Visayas           173,256           201,459           152,836              95,203           115,491              90,950              90,634              98,674 Central Visayas           296,176           288,690           256,628            218,047           218,668           216,657           237,623           214,589 Eastern Visayas           151,621           180,002           169,508            167,184           119,973              83,977              99,915           121,497 Zamboanga Peninsula              79,994              96,198           107,734              60,551           108,506           137,718           121,430           133,449 Northern Mindanao           111,768           168,581           154,809            123,045           124,540           119,792           127,177           127,778 Davao Region           123,507           138,086           132,048            110,135              83,383              94,601              96,340              96,931 SOCCSKSARGEN              98,802           119,542           102,103              97,895              76,622              65,771              80,475              80,674 NCR              71,836              31,290              14,787              13,139              13,297                8,480              12,069              14,615 CAR              33,017              54,839              35,268              29,165              23,491              12,351              15,517              15,175 ARMM              21,667              48,666              21,851              16,755              33,980              38,542              61,638              49,293 CARAGA              50,796              87,892              85,953              80,688              60,432              67,505              65,093              86,720 Sector Agriculture        1,404,345        1,563,340        1,382,035        1,092,885        1,009,805           956,581           992,336           925,623 Mining              12,636              17,124                9,007              11,305              12,220              10,456              12,247              17,351 Manufacturing              97,522           103,309              58,629              41,796              48,213              46,600              41,506              54,398 Utilities                2,231                4,576                1,992                1,941                   805                   528                   627                   789 Construction              96,435           126,387           117,497              76,267              99,949              64,422              76,845              85,050 Trade              74,084              91,170              66,076              46,829              62,407              47,395              74,328              59,828 Transportation & Communication              78,774              73,232              64,779              46,409              56,715              50,331              60,713              62,326 Finance                5,328                7,212                1,695                1,689                     97                   282                   273                   466 Services           102,794              93,613              73,716              60,313              51,732              45,289              67,916              79,786 Unemployed           121,357           146,375           152,191              94,080           106,169              65,969           100,963           112,615 Class of Worker Worked for private household              76,578              77,884              94,212              57,030              46,796              18,648              18,610              28,101 Worked for private establishment           548,326           578,302           487,315            338,509           401,020           366,020           427,153           476,134 Worked for government/government corporation              27,865              40,555              36,258              25,087              26,885              21,472              24,260              32,377 Worked with pay in own family-operated farm or business                1,942                6,064                2,879                     776                2,280                2,252                1,474                1,138 Worked without pay in own family-operated farm or business                4,387              14,870              23,006                4,604                5,827                4,167                3,823                6,914 Self-employed without any employee        1,188,235        1,294,703        1,073,583            909,061           757,167           725,043           777,148           661,323
  • 13. Employer in own family-operated farm or business              40,477              67,583              59,226              44,835           101,969              84,283              74,323              79,631 Educational Attainment No Education           159,233           198,501           163,392            114,061           127,212           113,875           105,488           114,916 Elementary Undergraduate           885,832           895,493           793,981            631,729        1,137,992           596,278           630,607           620,694 Elementary Graduate           591,104           667,888           589,609            425,896           142,144           307,754           365,226           326,710 Highschool Undergraduate           191,461           235,518           193,801            146,002              31,927           136,329           167,682           166,518 Highschool Graduate           139,408           181,094           150,050            124,446                3,517           109,260           131,358           142,007 College Undergraduate              33,989              41,288              32,817              24,594                2,275              20,413              23,526              24,013 College Graduate                8,139                6,556                5,020                6,787                3,046                3,945                3,866                3,373
  • 14. $  14-­‐B  Investments  in  Mining  Eyed  from  China   Inquirer,  September  7,  2011  
  • 15. MacroAsia,  Jinchuan  to  invest  $1  B  in  nickel  mine   The  Philippine  Star  (Business),  September  8,  2011  
  • 16. Mining  in  Surigao  del  Sur  (September  2010)