
Empfohlen
Empfohlen
Weitere ähnliche Inhalte
Was ist angesagt?
Was ist angesagt? (20)
Andere mochten auch
Ähnlich wie Balance sheet repaired
Ähnlich wie Balance sheet repaired (20)
Kürzlich hochgeladen
Kürzlich hochgeladen (20)
Balance sheet repaired
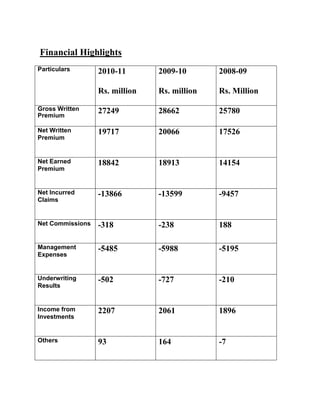
- 1. Financial Highlights Particulars 2010-11 2009-10 2008-09 Rs. million Rs. million Rs. Million Gross Written 27249 28662 25780 Premium Net Written 19717 20066 17526 Premium Net Earned 18842 18913 14154 Premium Net Incurred -13866 -13599 -9457 Claims Net Commissions -318 -238 188 Management -5485 -5988 -5195 Expenses Underwriting -502 -727 -210 Results Income from 2207 2061 1896 Investments Others 93 164 -7
- 2. Profit Before Tax 1798 1498 1679 Provision for Tax -590 -546 -623 Profit After Tax 1208 952 1056 Claim's Ratio 73.6% 72.0% 67% Commission 2% 1% -1% Ratio Management 29% 32% 36% Expenses Ratio Combined Ratio 104% 105% 102% Return on Equity 16% 15% 23% Shareholder's 7928 6725 5748 Equity Assets Under 25315 21938 18632 Management Number of 3506 3973 3603 Employees
- 3. Balance Sheet as at 31st March, 2011 000 st st Particulars 31 March, 2011 31 March, 2010 Sources of fund Shareholders fund Share Capital 1102273 1102273 Reserve and surplus 6,830,724 5,622,446 Fair value change (5094) - Account Borrowings - - Total 7927903 6724719 Application of Funds Investments 25314595 21937504 Loans - - Fixed Assets
- 4. Gross block 2496177 1556866 Less:- accumulated 1227583 1038900 depreciation Net block 1268594 517966 Capital work in 264964 767460 progress including capital advances 1533558 1285426 Deferred tax assets 378480 152080 Current assets Cash and bank 2964880 28490009 balance Advances and other 7132312 5446286 assets Subtotal (A) 10097192 8295295 Current liabilities 18064657 14495261 Provisions 113331265 10450325 Subtotal (B) 29395922 24945586
- 5. Net current (19298730) (16650291) assets(C)= (A - B) Miscellaneous - - Expenditure(to the extent not written off or adjusted) Debit Balances in - - profit and loss account Total 7927903 6724719