This report shows the market activity for home sales in the Dallas/Ft. Worth area including number of sales, list price and county averages and adjustments.
Retail Space for Lease - 1221 W. Main St., Sun Prairie, WI
MLS Housing Report October 2010
1. North Texas Real Estate Information System
MLS Current Month Summary for: October 2010
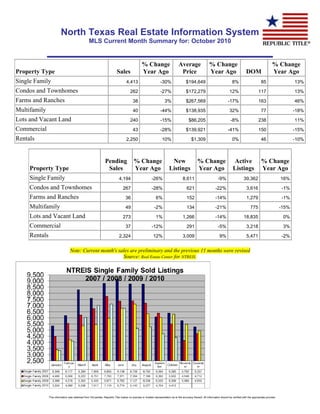
Property Type Sales
% Change
Year Ago
Average
Price
% Change
Year Ago DOM
% Change
Year Ago
Single Family 4,413 -30% $194,649 8% 85 13%
Condos and Townhomes 262 -27% $172,279 12% 117 13%
Farms and Ranches 38 3% $267,569 -17% 163 46%
Multifamily 40 -44% $138,935 32% 77 -18%
Lots and Vacant Land 240 -15% $86,205 -8% 238 11%
Commercial 43 -28% $139,921 -41% 150 -15%
Rentals 2,250 10% $1,309 0% 46 -10%
Note: Current month's sales are preliminary and the previous 11 months were revised
Source: Real Estate Center for NTREIS.
Property Type
Pending
Sales
% Change
Year Ago
New
Listings
% Change
Year Ago
Active
Listings
% Change
Year Ago
Single Family 4,194 -26% 8,611 -9% 39,362 16%
Condos and Townhomes 267 -28% 621 -22% 3,616 -1%
Farms and Ranches 36 6% 152 -14% 1,279 -1%
Multifamily 49 -2% 134 -21% 775 -15%
Lots and Vacant Land 273 1% 1,266 -14% 18,835 0%
Commercial 37 -12% 291 -5% 3,218 3%
Rentals 2,324 12% 3,009 9% 5,471 -2%
This information was obtained from 3rd parties. Republic Title makes no express or implied representation as to the accuracy thereof. All information should be verified with the appropriate provider.
2. NTREIS MLS Area Housing Activity Report
Compiled for North Texas Real Estate Information System
Sales Closed by Price Class for: October 2010
Single Family
Price Class Sales
Percent
Distribution
Sales
Year-to-Date
% Change
Year Ago
Active
Listings
Months
Inventory
$1 to $19,999 64 1.5% 707 12% 173 2.4
$20,000 to $29,999 101 2.3% 1,149 -3% 285 2.5
$30,000 to $39,999 144 3.3% 1,581 3% 475 3.0
$40,000 to $49,999 137 3.1% 1,448 -6% 592 4.1
$50,000 to $59,999 131 3.0% 1,468 -12% 784 5.3
$60,000 to $69,999 148 3.4% 1,783 0% 1,065 6.0
$70,000 to $79,999 202 4.6% 1,957 -8% 1,307 6.7
$80,000 to $89,999 216 4.9% 2,327 -6% 1,488 6.4
$90,000 to $99,999 165 3.7% 2,312 -5% 1,529 6.6
$100,000 to $109,999 182 4.1% 2,329 -5% 1,187 5.1
$110,000 to $119,999 196 4.4% 2,754 -11% 1,903 6.9
$120,000 to $129,999 219 5.0% 2,995 -12% 1,936 6.5
$130,000 to $139,999 190 4.3% 2,731 -14% 1,869 6.8
$140,000 to $149,999 184 4.2% 2,511 -10% 1,705 6.8
$150,000 to $159,999 164 3.7% 2,308 -13% 1,566 6.8
$160,000 to $169,999 163 3.7% 2,216 -6% 1,425 6.4
$170,000 to $179,999 148 3.4% 1,944 -7% 1,358 7.0
$180,000 to $189,999 110 2.5% 1,741 -5% 1,176 6.8
$190,000 to $199,999 130 2.9% 1,355 -15% 1,287 9.5
$200,000 to $249,999 440 10.0% 5,436 -5% 3,848 7.1
$250,000 to $299,999 278 6.3% 3,758 -1% 3,138 8.4
$300,000 to $399,999 359 8.1% 3,876 5% 3,508 9.1
$400,000 to $499,999 125 2.8% 1,607 2% 1,803 11.2
$500,000 to $599,999 78 1.8% 782 2% 1,032 13.2
$600,000 to $699,999 43 1.0% 494 16% 710 14.4
$700,000 to $799,999 28 0.6% 306 16% 486 15.9
$800,000 to $899,999 14 0.3% 220 29% 324 14.7
$900,000 to $999,999 9 0.2% 114 -6% 283 24.8
$1,000,000 and more 42 1.0% 509 20% 1,120 22.0
Total 4,413 54,721 -5% 39,362 7.2
Note: Current month's sales are preliminary and the previous 11 months were revised
Source: Real Estate Center for NTREIS.
This information was obtained from 3rd parties. Republic Title makes no
express or implied representation as to the accuracy thereof. All information
should be verified with the appropriate provider.
3. North Texas Regional Information System (NTREIS) Information
Area Code Descriptions
001 - CEDAR HILL
002 - DESOTO
003 - LANCASTER
004 - WILMER/HUTCHENS
005 - MESQUITE
006 - ELLIS COUNTY
008 - SACHSE/ROWLETT
009 - THE COLONY
010 - ADDISON/FAR NORTH DALLAS
011 - DALLAS NORTH
012 - DALLAS EAST
013 - DALLAS SOUTHEAST
014 - DALLAS NORTH OAK CLIFF
015 - DALLAS SOUTH OAK CLIFF
016 - DALLAS NORTHWEST
017 - DALLAS OAK LAWN
018 - DALLAS NORTHEAST
019 - SUNNYVALE
020 - PLANO
021 - COPPELL
022 - CARROLLTON/FARMERS BRANCH
023 - RICHARDSON
024 - GARLAND
025 - UNIVERSITY PARK/HIGHLAND PARK
026 - IRVING
027 - GRAND PRAIRIE
028 - DUNCANVILLE
031 - DENTON COUNTY
033 - HUNT COUNTY
034 - ROCKWALL COUNTY
035 - KAUFMAN COUNTY
036 - VAN ZANDT COUNTY
037 - GRAYSON COUNTY
038 - JOHNSON COUNTY
041 - DENTON COUNTY SOUTHEAST
042 - HENDERSON COUNTY
043 - COOKE COUNTY
044 - HILL COUNTY
045 - HOPKINS COUNTY
046 - LAMAR COUNTY
047 - DELTA COUNTY
048 - NAVARRO COUNTY
050 - WYLIE ISD
051 - ALLEN ISD
052 - LOVEJOY ISD
053 - MCKINNEY ISD
054 - PRINCETON ISD
055 - FRISCO / DENTON COUNTY EAST
056 - COMMUNITY RHSD
057 - ROYSE CITY ISD
058 - FARMERSVILLE ISD
059 - PROSPER ISD
060 - CELINA ISD
061 - RAINS ISD
062 - VAN ALSTYNE ISD
063 - ANNA ISD
064 - WESTMINISTER ISD
065 - WHITEWRIGHT ISD
066 - TRENTON ISD
067 - BLUE RIDGE ISD
068 - MELISSA RHSD
069 - LEONARD ISD
070 - BLAND ISD
071 - FANNIN COUNTY
072 - WISE COUNTY
073 - HOOD COUNTY
074 - WOOD COUNTY
075 - SOMERVELL CITY
076 - PALO PINTO COUNTY
077 - JACK COUNTY
078 - ERATH COUNTY
079 - ANDERSON COUNTY
080 - ARCHER COUNTY
081 - COMANCHE
082 - ARLINGTON
083 - ARLINGTON
084 - ARLINGTON
085 - ARLINGTON
086 - ARLINGTON
087 - ARLINGTON
088 - ARLINGTON
089 - ARLINGTON
090 - ARLINGTON (KENNEDALE)
091 - HAMILTON COUNTY
092 - BOSQUE COUNTY
093 - WICHITA COUNTY
094 - YOUNG COUNTY
095 - EASTLAND COUNTY
096 - MONTAGUE COUNTY
097 - CLAY COUNTY
098 - SMITH COUNTY
101 - FW (DOWNTOWN)
102 - FORT WORTH(SAGINAW/NORTHSIDE)
104 - FORT WORTH EAST
105 - FORT WORTH-SE (ROSEDALE)
106 - FW SOUTH (EVERMAN/FOREST HILL)
107 - FW-CENTRAL WEST & SOUTHWEST(TCU)
108 - FORT WORTH CENTRAL WEST
109 - FW NW(EAGLE MT.LK/RIV.OAKS/AZLE
111 - FW (SOUTH OF I20/CROWLEY)
112 - FW FAR WEST-BENBROOK/WH.SETTLEM.
120 - BEDFORD
121 - EULESS
122 - HURST
123 - COLLEYVILLE
124 - GRAPEVINE
125 - SOUTHLAKE
126 - KELLER
127 - N RICHLAND HILLS/RICHLAND HILLS
128 - WATAUGA
129 - FW-HALTOM CITY/RIVERSIDE
130 - FW-SUMMERFIELD/PARK GLEN
131 - ROANOKE
132 - TROPHY CLUB/WEST LAKE
140 - PARKER COUNTY
141 - PARKER COUNTY
142 - PARKER COUNTY
143 - PARKER COUNTY
144 - PARKER COUNTY
145 - PARKER COUNTY
146 - PARKER COUNTY
147 - PARKER COUNTY
148 - PARKER COUNTY
149 - PARKER COUNTY
150 - PARKER COUNTY
151 - PARKER COUNTY
152 - PARKER COUNTY
153 - PARKER COUNTY
154 - PARKER COUNTY
155 - PARKER COUNTY
156 - MCCLENNAN COUNTY
157 - LIMESTONE COUNTY
158 - FREESTONE COUNTY
271 - GRAND PRAIRIE-NEW
272 - GRAND PRAIRIE-NEW 1
273 - GRAND PRAIRIE-NEW 2
274 - GRAND PRAIRIE-NEW 3
275 - GRAND PRAIRIE-NEW 4
276 - GRAND PRAIRIE-NEW 5
600 - WEST OF SERVICE AREA
700 - SOUTH OF SERVICE AREA
800 - EAST OF SERVICE AREA
900 - OKLAHOMA
999 - OTHER AREAS