Grateful 7 speech thanking everyone that has helped.pdf
Ib.2008
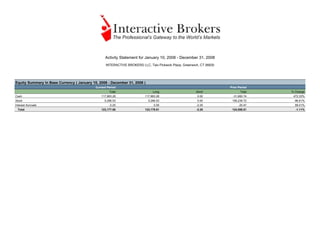
1. Activity Statement for January 10, 2008 - December 31, 2008
INTERACTIVE BROKERS LLC, Two Pickwick Plaza, Greenwich, CT 06830
Equity Summary In Base Currency ( January 10, 2008 - December 31, 2008 )
Current Period Prior Period
Total Long Short Total % Change
Cash 117,883.28 117,883.28 0.00 -31,660.74 472.33%
Stock 5,296.53 5,296.53 0.00 156,239.72 -96.61%
Interest Accruals -2.25 0.00 -2.25 -20.47 89.01%
Total 123,177.56 123,179.81 -2.25 124,558.51 -1.11%
2. Activity Statement for January 10, 2008 - December 31, 2008 Page: 2
Equity Value Time Series ( January 10, 2008 - December 31, 2008 )
Equity Value Distribution
11. Activity Statement for January 10, 2008 - December 31, 2008 Page: 11
Cash Report ( January 10, 2008 - December 31, 2008 )
Cash Detail Total Securities Commodities
Base Currency Summary
Starting Cash -31,660.74 -31,660.75 0.01
Commissions -1,148.44 -1,019.55 -128.90
Deposits/Withdrawals -15,439.20 -15,439.20 0.00
Account Transfers 4.62 4.62 0.00
Internal Transfers 0.00 12,417.89 -12,417.89
Dividends 789.24 789.24 0.00
Broker Interest Paid and Received 328.16 317.62 10.54
Cash Settling MTM 13,575.87 0.00 13,575.87
Net Trades (Sales) 2,113,173.22 2,107,621.34 5,551.89
Net Trades (Purchase) -1,961,199.84 -1,954,589.57 -6,610.27
Other Fees -74.20 -74.20 0.00
Payment In Lieu of Dividends 0.13 0.13 0.00
Transaction Tax -250.19 -250.19 0.00
Withholding Tax -25.30 -25.30 0.00
Cash FX Translation Gain/Loss -190.04 -208.80 18.75
Ending Cash 117,883.28 117,883.27 0.01
Ending Settled Cash 117,883.28 117,883.27 0.01
CAD
Starting Cash -216.52 -216.52 0.00
Account Transfers 0.00 0.00 0.00
Broker Interest Paid and Received -0.71 -0.71 0.00
Net Trades (Sales) 217.23 217.23 0.00
Ending Cash 0.00 0.00 0.00
Ending Settled Cash 0.00 0.00 0.00
EUR
Starting Cash 7.91 7.91 0.00
Account Transfers 0.00 0.00 0.00
Broker Interest Paid and Received 35.67 35.67 0.00
Net Trades (Sales) 286,992.09 286,992.09 0.00
Net Trades (Purchase) -286,992.00 -286,992.00 0.00
Ending Cash 43.67 43.67 0.00
Ending Settled Cash 43.67 43.67 0.00
HKD
Starting Cash -271,808.47 -271,808.47 0.00
Commissions -2,367.76 -1,999.76 -368.00
Deposits/Withdrawals -120,000.00 -120,000.00 0.00
Account Transfers 0.00 0.00 0.00
Internal Transfers 0.00 -4,047.28 4,047.28
Dividends 5,500.00 5,500.00 0.00
Broker Interest Paid and Received -1,603.52 -1,604.24 0.72
Cash Settling MTM 4,620.00 0.00 4,620.00
Net Trades (Sales) 1,641,159.44 1,597,909.44 43,250.00
Net Trades (Purchase) -1,264,117.42 -1,212,567.42 -51,550.00
Transaction Tax -1,947.51 -1,947.51 0.00
Ending Cash -10,565.24 -10,565.24 0.00
12. Activity Statement for January 10, 2008 - December 31, 2008 Page: 12
Ending Settled Cash -10,565.24 -10,565.24 0.00
USD
Starting Cash 3,352.61 3,352.60 0.01
Commissions -844.27 -762.61 -81.66
Account Transfers 4.62 4.62 0.00
Internal Transfers 0.00 12,920.04 -12,920.04
Dividends 84.21 84.21 0.00
Broker Interest Paid and Received 485.49 475.04 10.45
Cash Settling MTM 12,991.25 0.00 12,991.25
Net Trades (Sales) 1,491,534.71 1,491,534.71 0.00
Net Trades (Purchase) -1,388,323.76 -1,388,323.76 0.00
Other Fees -74.20 -74.20 0.00
Payment In Lieu of Dividends 0.13 0.13 0.00
Withholding Tax -25.30 -25.30 0.00
Ending Cash 119,185.50 119,185.49 0.01
Ending Settled Cash 119,185.50 119,185.49 0.01
13. Activity Statement for January 10, 2008 - December 31, 2008 Page: 13
Change In Position Value ( January 10, 2008 - December 31, 2008 )
Stocks
Base Currency Summary
Prior Period Value 156,239.72
Transactions -165,890.90
MTM P/L On Prior Period 1,689.56
MTM P/L On Transactions 13,168.92
Positions FX Translation P/L 89.24
End Of Period Value 5,296.53
HKD
Prior Period Value 301,120.00
Transactions -269,090.00
MTM P/L On Prior Period -33,090.00
MTM P/L On Transactions 6,180.00
End Of Period Value 5,120.00
USD
Prior Period Value 117,675.28
Transactions -131,347.09
MTM P/L On Prior Period 5,936.05
MTM P/L On Transactions 12,371.66
End Of Period Value 4,635.90
Equity and Index Options
Base Currency Summary
Prior Period Value 0.00
Transactions 15,114.38
MTM P/L On Prior Period -17,760.10
MTM P/L On Transactions 2,636.92
Positions FX Translation P/L 8.80
End Of Period Value 0.00
HKD
Prior Period Value 0.00
Transactions 8,300.00
MTM P/L On Prior Period -4,950.00
MTM P/L On Transactions -3,350.00
End Of Period Value 0.00
USD
Prior Period Value 0.00
Transactions 14,056.00
MTM P/L On Prior Period -17,123.34
MTM P/L On Transactions 3,067.35
End Of Period Value 0.00
Futures
Base Currency Summary
Prior Period Value 0.00
MTM P/L On Prior Period 24,017.32
MTM P/L On Transactions -10,441.45
Settled Cash 13,575.87
End Of Period Value 0.00
14. Activity Statement for January 10, 2008 - December 31, 2008 Page: 14
HKD
Prior Period Value 0.00
MTM P/L On Prior Period 7,130.00
MTM P/L On Transactions -2,510.00
Settled Cash 4,620.00
End Of Period Value 0.00
USD
Prior Period Value 0.00
MTM P/L On Prior Period 23,103.00
MTM P/L On Transactions -10,111.75
Settled Cash 12,991.25
End Of Period Value 0.00
Transfers ( January 10, 2008 - December 31, 2008 )
Symbol Date Type Direction Account Cash Amount Quantity Transfer Price Market Value
Cash
USD
-- 2008-01-15 ACAT IN 88265338 4.62 0 0.0000 0.00
Total in USD 4.62 0.00
Codes
Code Meaning
A Assignment
B Automatic Buy-in
C Closing Trade
Ca Cancelled Trade
Cc Cancelled Corporate Action
Co Corrected Trade
E External Transfer
Ep Resulted from an Expired Position
Ex Exercise
I Internal Transfer
L Ordered by IB (Margin Violation)
LI Last In, First Out (LIFO) tax basis election
Lt Long Term P/L
M Entered manually by IB
ML Maximize Losses tax basis election
N Late Trade. Profit or Loss will be recognized on next day's statement
O Opening Trade
P Partial Execution
PI Price Improvement
Plc P/L affected by Corporate Action
Plt P/L affected by Transfer
Po Interest or Dividend Accrual Posting
R Dividend Reinvestment
15. Activity Statement for January 10, 2008 - December 31, 2008 Page: 15
Re Interest or Dividend Accrual Reversal
St Short Term P/L
T Transfer
Notes/Legal Notes
Notes
1. Stock transactions settle on the trade date plus three days and securities options settle on the trade date plus one day. Ending settled cash reflects the cash which has actually settled.
2. Initial and maintenance margin requirements are available within the Account Window of the Trader Workstation.
3. Quantities preceded by a quot;-quot; sign indicate sell transactions. Other transactions are purchases. The settlement date for stock transactions is trade date + 3 business days, except for transactions on XETRA, which settle on
trade date + 2 business days. Option transactions settle on trade date + 1 business day.
4. In case of partial executions, commissions are charged on the total quantity executed on the original order. The commission is displayed on the first partial execution only.
5. All times are local to the exchange.
6. Click here (http://www.interactivebrokers.com/en/accounts/fees/exchangeAndRegulatoryFees.php) to view the applicable commodity Regulatory Fees for your transactions.
Fixed Income Notes
1. Call features for bonds or preferred stocks may affect the yield. For zero coupon, compound interest and multiplier securities, there are no periodic payments and securities may be callable below maturity value without
notice to holder unless registered. For asset-backed securities, the actual yield may vary depending on the speed at which the underlying note is pre-paid. For additional information regarding bond yield, please contact
the IB Help Desk at: help@interactivebrokers.com.If this debt security is unrated by a nationally recognized statistical rating organization, it may pose a high risk of default. You should consult a financial advisor to
determine whether unrated bonds are appropriate for your portfolio in light of your goals and your financial circumstances.
Legal Notes
1. Please promptly report any inaccuracy or discrepancy in this statement, or in your account. Contact the IB Customer Service Department in writing using the form available on the IB website. You may
also contact IB by phone, but if you report an error by phone, you should re-confirm such oral communication in writing in order to protect your rights, including rights under the Securities Investor
Protection Act (SIPA).
Interactive Brokers LLC, www.interactivebrokers.com, 877-442-2757 (U.S.)
Interactive Brokers (UK) (Ltd), www.interactivebrokers.co.uk, 00800-42-276537 (Intl)
Interactive Brokers Canada Inc., www.interactivebrokers.ca, 877-745-4222 (Can.)
2. Unless otherwise noted, Interactive Brokers acted as agent in the execution of the above transactions. For those exchanges where IB is not self-clearing, IB may use one of the following clearing agents: Interactive
Brokers (U.K.) Limited, Timber Hill Canada Company, Timber Hill Europe AG, Timber Hill LLC, Timber Hill Securities Hong Kong Limited, BBVA Bancomer, S.A., BNP Paribas Commodity Futures, Inc., Citibank
International plc, Euroclear Bank S.A./N.V., Fortis Clearing Singapore Pte. Ltd., Fortis Clearing Sydney Pty Limited, Goodmorning Shinhan Securities Co., Ltd., Newedge Group S.A., Skandinaviska Enskilda Banken AB,
Société Générale Zurich branch.
3. IB acts as agent or riskless principal in foreign currency exchange transactions. Such transactions are executed against an IB affiliate or a third party, which acts as principal in such transactions and may have a long or
short position and may have profited or lost in connection with the transaction. Foreign currency exchange transactions executed by Customer through IB are not regulated or overseen by the SEC or the CFTC.
4. Trades marked with the exchange indicator of TMBR were effected by IB as agent through a market making affiliate, which acted as principal in the transaction and may have a long or short position in the security and
may have profited or lost in connection with the transaction.
5. All VWAP trades are effected pursuant to an average price formula based on a reference price provided by a third-party data provider. Additional information and reference prices are available upon request. IB, as agent,
effects VWAP transactions through a market making affiliate, which acts as principal in such transactions and may have a long or short position in the security and may have profited or lost in connection with the
transaction.
6. Except for liquidity rebates that may be paid by ECNs for certain orders routed to those ECNs, IB does not generally accept payment for order flow for stock orders. ECN liquidity rebates are credited against the fees
charged by the ECNs to execute other orders. IB receives payment for some option orders pursuant to exchange-mandated marketing fee programs or other arrangements. IB does not generally accept payment for order
flow for security futures orders. To the extent permissible under exchange rules, IB may direct customer stock, option, futures, or security futures orders to its market making affiliate Timber Hill LLC, or to another affiliate,
for execution. In such cases IB's affiliate may act as principal in the resulting transaction and may earn a profit or incur a loss in connection with the transaction. The source and nature of any compensation received by IB
in connection with any transaction is available upon written request of the customer. For further information, check the IB website or email help@interactivebrokers.com.
7. For security futures trades, if not already indicated on this statement, information about the time of any transaction, the identity of the counterparty to the transaction, and whether IB is acting as agent or principal, as
agent for the counterparty, as agent for both parties to the contract, or as principal, and if acting as principal, whether the transaction was a block transaction or an exchange for physicals transaction, will be available
upon written request of the customer.
8. Customer is requested to promptly advise Interactive Brokers of any material change in Customer's investment objectives or financial situation.
9. A financial statement of Interactive Brokers LLC is available for your personal inspection at www.interactivebrokers.com or at its offices, or a copy of it will be mailed upon your written request.
SIPC Member
Generated at: 2009-05-24, 11:54:37 EDT