SlideShare ist ein Scribd-Unternehmen logo
1 von 35
Addresses of different statements in She-2 package
                 Column-1                            Column-2
A-7     Capital Cost                   I-2
A-48    Proposed Financial Plan        I-47
A-96    Working Capital Requirment     I-94
A-140   Bld. and Civil work            I-139
A-171   Motors & Vehicals              I-185
A-185   Funiture & Fixture             I-212
A-206   Pril. Expenses                 I-284
A-233   Pre-production Expenses        I-332
A-253   Interest during Construction   I-373
A-267   Land & Develop                 I-403
A-283   Plant & Machinery              I-423
A-411   Total Plant Cost.              I-470
he-2 package
               Column-2                             Column-3
       Projt. Income Statement      W-2     Loan Repayment
       Projt. Cash Flow             W-47    Loan Repayment
       Projt. Balance Sheet(Asst)   W-94    Loan Repayment
       Projt. Balance Sheet(Liab)   W-139   Loan Repayment
       Depreciation Schedule        W-186   IFRR
       Projected Sales              W-232   Cost Benefit Ratio
       Raw material requirement     W-280   Payback Period
       Manpower requi.              W-327   Cost Benefit Ratio Discounted
       Utilities                    W-372   Break even analysis
       Stores & Spares
       Gen. & Selling Exp.
       Detailed working Capital
Financial Analysis                                                                                              3-   .


Project Title : Boutique and Garment Factory
Location      : Distt.    Lahore


Table-1
                      CAPITAL COST OF THE PROJECT
                                                                                  (Rs. in ,000)
                   Description                       Local         Foreign           Total
- Land                                                         0                               0   Appendix-1

- Building & Civil Works                                       0                               0   Appendix-2

- Plant & Machinery                                          207              0              207   Appendix-3

- Errection & Installation % of P. & Machin     10            21                              21

- Motors & Vehicles                                            0                               0   Appendix-4

- Furniture & Fixture                                        473                             473   Appendix-5

- Preliminary Expenses * take from Appendix-6            3464                             3464     Appendix-6

- Pre-production Expenses                                     77                              77   Appendix-7

- Intrest During Construction                                  0                               0   Appendix-8

- Contingencies                                              424              0              424

 Fixed Capital Cost                                      4666                 0           4666

 Working Capital                                         2455                             2455     Table-3
                        Total                            7121                 0           7121


Construction Period              =      1 Year

Local Contingencies excluding land & motor & vehicles %                      10
Foreign Contingencies                                 %                       0
Financial Analysis                                                                   3-   .


Table-2
                         PROPSED FINANCIAL PLAN:
                                                                     (Rs. in ,000)
                  Description              Local       Foreign          Total
 Equity
- Local Sponsors                               7121                          7121
- Foreign Sponsors                                               0              0
- Bridge Financing                                0                             0
Total Equity                                   7121              0           7121

Loans
 - Foreign Currency                                              0               0
 - Suppliers Credit                                              0               0
 - LMM                                             0                             0
 - Long Term Finance                               0                             0
 - Custom Debenture                                0                             0

Total Debts                                        0             0               0

                Total Investment               7121              0           7121

       Debt                        %   0          0
       Equity                      % 100       7121
Financial Analysis                                                         3-   .


Table-3
                 Working Capital Requirement

                 Description                Period(Days)   Amount
                                                           Rs. (000)
Raw material imported                                  0               0
Raw material Local                                     0               0
Work in Process                                                     0
Packing Material                                      0             0
Salaries                                             30             0
Utilities                                            30            90
Overheads                                            30             1
Selling & Admin. Expenses                            30           196
Finished Goods Inventory                              0             0
Accounts Recievable                                  45           668
Advances & Deposits                                               500
Cash                                                             1000
Sub Total                                                        2455

Accounts Payable                                       0               0
Short Term Borrowing @ % of stocks      0                              0
Sub Total                                                              0

          Net Initial Working Capital                            2455
Financial Analysis                                                                                 3-   .


Appendix-2
                                  BUILDING & CIVIL WORKS

            Description            Dimension        Area            Rate            Total
                                    Ft. x Ft.       Sq. Ft       Rs. /Sq.Ft.       Rs. (000)
Buildings                             0         0            0                 0               0
Raw Material Store                    0         0            0                 0               0
Stores & Spares                       0         0            0               0                 0
Finished Goods Store                  0         0            0               0                 0
Workshop                              0         0            0               0                 0
Display shop                          0         0            0               0                 0
Labratory                             0         0            0               0                 0
Canteen                               0         0            0               0                 0
Dispensary                            0         0            0               0                 0
Admin Block                           0         0            0               0                 0
Time Office                           0         0            0               0                 0
Staff Colony-A                        0                      0               0                 0
Staff Colony-B                        0                      0               0                 0
Elecctric Sub-station                 0                      0               0                 0
Toilets                               0     15               0             150                 0
Cooling Pond                          0                      0               0                 0
Boudary Wall (running feet)           0                      0               0                 0
Drain (open Excludind Pumps)          1         0            0               0                 0
Cooling Tower                         1         0            0               0                 0
Tubewell                                                     0
Water Tanks(under ground)                                    0                                 0
Water Tanks(Over head)                                       0                                 0
Internal Roads                        0         0            0                 0               0
Others                                0         0            0                 0               0
                      Total                                  0                                 0

Appendix-4
                                MOTORS & VEHICLES
                  Description                       NOs.          Value             Total
                                                                 Rs. (000)         Rs. (000)
Toyota SA Salon 1975cc                                       0                 0               0
Honda VTI Auto 1590CC                                        0                 0               0
Suzuki Baleno 1300cc JXR                                     0                 0               0
Mercedez Bus                                                 0                 0               0
T-3500 Cargo Truck                                           0                 0               0
Fork Lifters                                                 0                                 0
Tractors (Dozer & Cultivator)                                0                                 0
                     Total                                   0                                 0
Financial Analysis                                                                                              3-   .


Appendix-5
                                  FURNITURE & FIXTURE

                      Description                    NOs.          Value           Total
                                                                  Rs. (000)       Rs. (000)
Computers                                                     5            30            150
Printers (Dot Matrix)                                         2             6              12
Printer (Laser)                                               1            20              20
Fax Machine                                                   1            10              10
Type Writer (manual)                                          0             0               0
Cabnets                                                       6            15              90
Office Tables with Chairs                                     6           1.5               9
Chairs                                                       12             1              12
Executive Chairs & Tables etc.                                5             5              25
Telephones & Exchange                                                                      15
Conference Room                                                                            40
Air Conditoners                                               2           20               40
Others                                                                                     50
                Total                                                                    473

Appendix-6
                                           PRELIMINARY EXPENSES
                      Description                   Amount         Period *         Rate        Charged
                                                                  (months)          (%)         Rs. (000)
Project Examination Fee                                       0                            0                0
Commitment Charges
 - FCY Loan                                                   0               6            0             0
 - LMM Loan                                                   0               6            0             0
 - LCY Loan                                                   0               6            0             0
 - Short Term Finance Certificate                             0               6            0             0
Legal Documentation Fee                                                                    0             0
Project Supervision Fee                                                                    0             0
Company Incorporation                                                                                    5
Electric Connection                                                                                     10
Consultancy                                                                                              0
Others                                                                                                  20
                     Total                                                                              35
* Based on one year construction period.
Financial Analysis                                                                                                3-   .


Appendix-7
                                      PRE-PRODUCTION EXPENSES

                       Description                 Amount          Period          Rate *         Charged
                                                                  (months)          (%)           Rs. (000)
Salaries                                                2160                  1             15             27
Utilities                                                191                  1              1              0
Administrative Expense                                     0                  1              1              0
Staff Training                                                                                              0
Travelling/Entertainment etc.                                                                               0
Raw Material                                                                  0                             0
Trial/Commisioning
Others                                                                                                    50
    Sales of Goods
                     Total                                                                                77
* Calculated on the basis of first year expenses


Appendix-8
                                INTEREST DURING CONSTRUCTION
                       Description                 Amount          Period *         Rate          Charged
                                                                  (months)          (%)           Rs. (000)

FCY Loan                                                      0               0               0               0
LMM Loan                                                      0               0               0               0
LCY Loan                                                      0               0               0               0


Others
                           Total                                                                              0

Appendix-1
                                   LAND & DEVELOPMENT
                       Description                   Area          Rate           Total
                                                   (kanals)       Rs. (000)       Rs. (000)

Land                                                          0               0               0
Legal Fee @ 10 %                                                                              0
Access Road/Right of Way @ 5 %                                                                0
Developmenr Charges @ 2 %                                                                     0
Others
                    Total                                                                     0
Financial Analysis                                                                                                3-   .


Appendix-3
                                              PLANT & MACHINERY
              Description                             Rate         NOs.        Rate               Total
                                                      %age                    Rs. (000)          Rs. (000)
Main Equipment:
(A)- Imported FOB Value:
- Rotary Belt Dryer                                                       0               0                   0
- Centrifuge                                                              0               0                   0
- Rotary Belt Vacuum Filter                                               0               0                   0
- Plate Type Exchanger                                                    0               0                   0
- Shell & Tube Exchanger                                                  0               0                   0
- Evaporators                                                             0               0                   0
-                                                                                                             0
-                                                                                                             0
-                                                                                                             0
-                                                                                                             0
-                                                                                                             0
-                                                                                                             0
-                                                                                                             0
-
- Piping & Valves @ % of Eq. cost                          0                                                  0
              Subtotal                                                                                        0
Freight % of FOB                                            0                                                 0
C&F Value                                                                                                     0
Insurance % of FOB                                         0                                                  0
CIF Value                                                                                                     0
Duties % of CIF                                            0                                                  0
Sales Tax % of (CIF + Duties)                              0                                                  0
Iqra Surcharge of CIF                                      0                                                  0
Flood Relief % of CIF                                      0                                                  0
Import Licence Fee % of C&F                                0                                                  0
Bank Charges % of C&F                                      0                                                  0
Clearing Charges 0.5% of FOB                               0                                                  0
Inland Freight *                                                                                              0
Inland Insurance % of CIF                                  0                                                  0
Sundry Expenses**                                                                                             0
                   Total                                                                                      0
* Freight is charged Rs. 1000 per ton from Karachi to up country site.
** Sundry Expenses includes Port handling, Octroi etc.


                                                                                              Continued....
Financial Analysis                                                                         3-   .


           Description              Rate   NOs.         Rate               Total
                                    %age              Rs. (000)          Rs. (000)
(B)- Local Equipment:
- Juki                                            0               0                    0
- Overloc Machine                                 0               0                    0
#NAME?                                            0               0                    0
- Flate Loc Machine                               0               0                    0
- Embroidary Machine (Singer)                     0               0                    0
- Vessels (5 m3) Special                          0               0                    0
- Pumps (1 hp)                                    0               0                    0
- Pumps (0.5 hp) Special                          0               0                    0
- Motors (5 hp)                                   0               0                    0
- Generator (5 hp)                                0               0                    0
- Air Compressor                                  0               0                    0
- Conveyor Belts                                  0               0                    0
- Filters                                         0               0                    0
-                                                                                      0
-                                                                                      0

- Piping & Valves @ % of Eq. cost      0                                               0
             Subtotal                                                                  0
Inland Freight *                                                                      25
Inland Insurance                                                                      10
Sundry Expenses**                                                                     30
             Total (B)                                                                65


                                                                      Continued....
Financial Analysis                                                                        3-   .


            Description                       Rate   NOs.        Rate         Total
                                              %age              Rs. (000)    Rs. (000)
(C)- Electrical & Instrumentation:

Instrumentation including DCS                    0                                    0
Motors/Switch gears/Elect. & Lighting                                                 0
Trasformers                                                                           0
Uninterrupted Power Supply(UPS)                             1           50           50
Motor Control Centers                                                                 0


              Total (C)                                                              50
(D)- Utilities

Tube Well                                                                             0
Boiler ( 10 tons/hr)                                                                  0
Water Treatment (200 gpm)                                                             0
Steam & Air lines with accessories % of Eq.      0                                    0
Insulation (pipes, reactors etc.) % of Eq.       0                                    0
Water lines                                                                           0
Instrument Air compressor                                                             0
Laboratory                                                                            0
Cooling Tower                                                                         0
Air Conditioning unit                                       2           20           80
Duct lines                                                                            0
Workshop Equipment (lath, tools etc)                                                  0
Photocopy machine                                           1           10           12
Overhead crane                                                                        0
Furnace Oil Tank                                                                      0
Paints                                                                                0
Generator
Others
              Total (D)                                                              92
Total (B)+(C)+(D) - local Equipment                                                 207
Total (A)+(B)+(C)+(D) - All Equipment                                               207
Financial Analysis   3-   .
Financial Analysis                                                                                                                      3-     .


Table-4
                                    PROJECTED INCOME STATEMENT                                                                   Rs. (000)
                 Year                1           2         3         4           5         6            7          8         9            10
                                                                         Capacity Utilization in %age
            DESCRIPTION              70          80        90       100         100       100           100       100       100              100
Net Sales                                4900     5600      6300      7000       7000          7000      7000       7000         7000         7000
COST OF GOODS MANF.
- Raw Material                             0          0         0          0          0           0           0         0           0              0
- Catalyst
- Wages & Salaries                        0           0         0         0          0          0           0           0         0            0
- Utilities                            989        1110      1231      1352       1352       1352        1352         1352     1352         1352
- Furnace /Vehicle Oil                    0           0         0         0          0          0           0           0         0            0
- Stores & Spares                         0           0         0         0          0          0           0           0         0            0
- Repair & Maintinance                    0           0         0         0          0          0           0           0         0            0
- Packing Material                        0           0         0         0          0          0           0           0         0            0
- Depreciation                           52          52        52        52         52         52          52          52        52           52
- Manufacturing Overhead %      1        10          12        13        14         14         14          14          14        14           14
C. O. G Manufactured                1051.07     1173.46   1295.84   1418.23    1418.23    1418.23     1418.23     1418.23   1418.23      1418.23
Add: Opening Inventory                    0           0         0         0          0          0           0           0         0            0
Total C.O.G. Manufactured           1051.07     1173.46   1295.84   1418.23    1418.23    1418.23     1418.23     1418.23   1418.23      1418.23
Less: Closing Inventory                   0           0         0         0          0          0           0           0         0            0
Total Cost of Goods Sold            1051.07     1173.46   1295.84   1418.23    1418.23    1418.23     1418.23     1418.23   1418.23      1418.23
Gross Profit                        3848.93     4426.54   5004.16   5581.77    5581.77    5581.77     5581.77     5581.77   5581.77      5581.77
OPERATING EXPENSES
- Admin Salaries                      2160        2236      2314      2395       2479          2565      2655       2748         2844         2944
- General Expenses                     109         124       140       155        155           155       155        155          155          155
- Selling, Marketing Expense             51         58        66        73         73            73        73         73           73           73
Total Operating Expenses            2319.67       2418      2519      2623       2707          2794      2883       2976         3072         3172
Operating Profit                    1529.26       2008      2485      2959       2875          2788      2698       2606         2509         2410
NON OPERATING EXPENSES
Interest On Loans:
- FCY Loan                                 0          0         0          0          0           0           0         0           0              0
- LMM Loan                                 0          0         0          0          0           0           0         0           0              0
- LCY loan                                 0          0         0          0          0           0           0         0           0              0
- Short Term Loan @ %          18          0          0         0          0          0           0           0         0           0              0
- Bridge Financing @ %         18         0           0         0         0          0          0           0           0         0            0
- Debenture                               0           0         0         0          0          0           0           0         0            0
Total Interest                            0           0         0         0          0          0           0           0         0            0
Profit Before W.P.F & Tax           1529.26       2008    2485.02   2958.84    2875.02    2788.27     2698.48     2605.54   2509.36      2409.81
W.P. Fund % of profit          10      153         201       249       296        288        279         270          261      251          241
Profit before Tax                     1376        1808      2237      2663       2588       2509        2429         2345     2258         2169
Tax Provision @ % rate         45      619         813      1006      1198       1164       1129        1093         1055     1016          976
Net Profit after Tax                   757         994      1230      1465       1423       1380        1336         1290     1242         1193
R. O. E %                             10.63       13.96     17.27     20.57      19.98      19.38       18.76       18.11     17.44        16.75
R. O. I %                             10.63       13.96     17.27     20.57      19.98      19.38       18.76       18.11     17.44        16.75
Financial Analysis                                                                                                                         3-     .


Table-5
                                 PROJECTED CASH FLOW STATEMENT                                                                      Rs. (000)
                     Year    0       1           2          3          4           5          6           7          8          9               10
                                                                           Capacity Utilization in %age
DESCRIPTION                          70          80         90         100        100         100         100        100        100             100
SOURCES OF FUNDS:
 - Operating Profit                       1529       2008       2485       2959        2875       2788        2698       2606       2509          2410
 - Depreciation                             52         52         52         52          52         52          52         52         52            52
Total Operating Sources         0         1581       2060       2537       3011        2927       2840        2751       2658       2561          2462
 - Equity/Stock              7121                                  0
 - FCY Loan                      0
 - LMM Loan                      0
 - LCY Loan                      0
 - Bridge Financing              0
 - Debenture                     0
 Decrease in C. Assets
Increase in C. Liabilities                   0          0          0          0           0           0          0          0          0                0
Other Incomes
Total Sourses of Funds       7121         1581       2060       2537       3011        2927       2840        2751       2658       2561          2462
APPLICATION OF FUNDS
Fixed Assets                 4666                                                                   473
Debt Repayment
 - FCY                                       0          0          0          0           0           0          0          0          0                0
 - LMM                                       0          0          0          0           0           0          0          0          0                0
 - LCY                                       0          0          0          0           0           0          0          0          0                0
 - Short Term Loan
 - Bridge Financing                                                0
 - Debenture
Interest Payments
 - FCY                                      0          0          0          0           0           0          0          0           0               0
 - LMM                                      0          0          0          0           0           0          0          0           0               0
 - LCY                                      0          0          0          0           0           0          0          0           0               0
 - Short Term Loan                          0          0          0          0           0           0          0          0           0               0
 - Bridge Financing                         0          0          0          0           0           0          0          0           0               0
 - Debenture
Tax                                        619        813       1006       1198        1164       1129        1093       1055       1016              976
W.P.F                                      153        201        249        296         288        279         270        261        251              241
Investments
Increase in C. Assets                     1090       -489         11         11           0           0          0          0          0                0
Decrease in C. Liabilities
Others
Total Appl. of funds         4666         1862        525       1266       1505        1452       1881      1363       1316       1267            1217
Cash Surplus/Defficit        2455         -281       1535       1271       1506        1475        959      1388       1342       1294            1245
Opening Cash                    0         2455       2175       3710       4981        6486       7962      8921      10309      11650           12945
Closing Cash Balance         2455         2175       3710       4981       6486        7962       8921     10309      11650      12945           14189
Financial Analysis                                                                                                              3-     .


Table-6(a)
                                            PROJECTED BALANCE SHEET

                  Year   0      1           2          3          4           5          6           7        8        9             10
                                                                      Capacity Utilization in %age
DESCRIPTION                     70          80         90         100        100         100         100      100      100           100


ASSETS:
Current Assets:
Cash                     2455        2175       3710       4981       6486        7962       8921     10309    11650    12945         14189
Account Recievable                      0          0          0          0           0          0         0        0        0             0
Inventories
 - Raw Material                         0          0          0          0           0          0         0        0        0             0
 - Work in Process                      0          0          0          0           0          0         0        0        0             0
 - Finished Goods                       0          0          0          0           0          0         0        0        0             0
 - Packing Material                     0          0          0          0           0          0         0        0        0             0
Other Current assets                 1090        601        612        623         623        623       623      623      623           623
Total Current Assets                 3264       4311       5593       7109        8585       9544     10932    12273    13567         14812
Investments
Intangible
Fixed assets at Cost                 4666       4666    4666        4666       4666        5139        5139     5139     5139          5139
Accum. Depreciation                    52        104     156         208        260         312         364      416      468           520
Total Fixed Assets                   4614       4562    4510        4458       4406        4827        4775     4723     4671          4619
Total Assets                         7878       8873   10103       11567      12990       14371       15706    16996    18238         19431
Financial Analysis                                                                                                             3-     .


Table-6(b)
                                              PROJECTED BALANCE SHEET

Year                          0          1         2        3         4         5         6            7         8         9              10
                                                                  Capacity Utilization in %age
DESCRIPTION                       70          80       90       100       100       100          100       100       100            100


LIABILITIES & EQUITY:
Current Liabilities
Bank Borrowing                            0        0        0         0         0         0            0         0         0               0
Account Payable                           0        0        0         0         0         0            0         0         0               0
Dividend Payable
W.P.F Payable
Taxes Payable
Others
Total Current Liabilities                 0        0        0         0         0         0            0         0         0               0
Deffereed Liabilities
Long Term Debt
    - FCY                                 0        0        0         0         0         0            0         0         0               0
    - LMM                                 0        0        0         0         0         0            0         0         0               0
    - LCY                                 0        0        0         0         0         0            0         0         0               0
Total Long-term Liabilities               0        0        0         0         0         0            0         0         0               0
Total Liabilities                         0        0        0         0         0         0            0         0         0               0

EQUITY:
Capital                                7121    7121     7121      7121      7121      7121         7121      7121      7121           7121
Bridge Finance                            0       0        0         0         0         0            0         0         0              0
Retained Earning                        757    1751     2981      4446      5869      7249         8585      9875     11117          12310
Total Equity                           7878    8873    10103     11567     12990     14371        15706     16996     18238          19431
Total Captalization                    7878    8873    10103     11567     12990     14371        15706     16996     18238          19431

Assets - Liabilities                     0         0        0         0         0         0            0         0         0               0
Financial Analysis                                                                                                                  3-       .


Appendix-15
                                                DEPRECIATION SCHEDULE
                                                                                                                        Rs. (000)
                   Year     %       Cost    Contin-     Total     1        2        3        4        5        6            7            8
   DESCRIPTION             Rate              gencies    Cost

- Civil Engineering             0       0           0         0        0        0        0        0        0        0           0                 0
- Plant & Mach.(at site)              207          21       228
- Errection & Install.                 21           2        23
Total Plant & Mach.           0       228          23       250        0        0        0        0        0        0           0                 0
- Motors & Vehicles           0         0           0         0        0        0        0        0        0        0           0                 0
- Furniture & Fixture        10       473          47       520       52       52       52       52       52       52          52                52
Amortized Expenses
- Preliminary Expenses          0    3464         346     3810         0        0        0        0        0        0           0                 0
- Pre Production Exp.           0      77           8       85         0        0        0        0        0        0           0                 0
- Intrest D. Con. FCY                   0           0        0         0        0        0        0        0        0           0                 0
                LMM                     0           0        0         0        0        0        0        0        0           0                 0
                LCY                     0           0        0         0        0        0        0        0        0           0                 0
T.Int. during Construct.                0           0        0         0        0        0        0        0        0           0                 0
Total Amortized                 0    3541         354     3895         0        0        0        0        0        0           0                 0
Total Depreciation                   4242         424     4666        52       52       52       52       52       52          52                52
Financial Analysis                                                                                                                                          3-     .


Appendix-9
                                                                           PROJECTED SALES
                       Year            Quantity     1           2            3          4           5          6           7          8          9               10
                                         100%                                               Capacity Utilization in %age
DESCRIPTION                    %         Rate       70          80           90         100        100         100         100        100        100             100
Export Sales
  - Product-1 Quantity                                     0          0            0          0           0          0           0          0          0               0
                  Value                                    0          0            0          0           0          0           0          0          0               0
Rebate/Duty Draw Back              0                       0          0            0          0           0          0           0          0          0               0
  - Product-2 Quantity                                     0          0            0          0           0          0           0          0          0               0
                  Value                                    0          0            0          0           0          0           0          0          0               0
Rebate/Duty Draw Back              0                       0          0            0          0           0          0           0          0          0               0
  - Product-3 Quantity                                     0          0            0          0           0          0           0          0          0               0
                  Value                                    0          0            0          0           0          0           0          0          0               0
Rebate/Duty Draw Back              0                       0          0            0          0           0          0           0          0          0               0
  - Product-4 Quantity                                     0          0            0          0           0          0           0          0          0               0
                  Value                                     0          0            0          0           0          0           0          0          0              0
Rebate/Duty Draw Back              0                        0          0            0          0           0          0           0          0          0              0
       Sub-total                                            0          0            0          0           0          0           0          0          0              0
Local Sales
  - Product-1 Quantity                      20             14         16           18         20          20         20          20         20         20            20
                 Value                     350           4900       5600         6300       7000        7000       7000        7000       7000       7000          7000
  - Product-2 Quantity                                      0          0            0          0           0          0           0          0          0             0
                 Value                                      0          0            0          0           0          0           0          0          0             0
  - Product-3 Quantity                                      0          0            0          0           0          0           0          0          0             0
                 Value                                      0          0            0          0           0          0           0          0          0             0
  - Product-4 Quantity                                      0          0            0          0           0          0           0          0          0             0
                 Value                                      0          0            0          0           0          0           0          0          0             0
            Sub-total                                    4900       5600         6300       7000        7000       7000        7000       7000       7000          7000
           Total Sales                          0        4900       5600         6300       7000        7000       7000        7000       7000       7000          7000
Opening Inventory(local)                                    0          0            0          0           0          0           0          0          0             0
Closing Inventory(local)                        0           0          0            0          0           0          0           0          0          0             0
          Net Sales                                      4900       5600         6300       7000        7000       7000        7000       7000       7000          7000
Note: 10 days inventory of local sale.
Financial Analysis                                                                                                                           3-     .


Appendix-10
                                                 PROJECTED RAWMATERIAL REQUIREMENT
                      Year          Quantity     1        2        3        4           5         6            7         8         9              10
                                     100%                                       Capacity Utilization in %age
DESCRIPTION                          Rate        70       80       90       100        100       100           100       100       100            100
Imported Rawmaterial
  - Material-1 Quantity
                  Value
             Duty/Charges
  - Material-2 Quantity
                  Value
             Duty/Charges
  - Material-3 Quantity
                  Value
             Duty/Charges
  - Material-4 Quantity
                  Value
             Duty/Charges
            Sub-total                                 0        0        0         0          0         0             0         0         0              0
Local Rawmaterial
  - Cotton Quantity                          0        0        0        0         0          0         0             0         0         0              0
                   Value                     0        0        0        0         0          0         0             0         0         0              0
  - Sil    Quantity                          0        0        0        0         0          0         0             0         0         0              0
                   Value                     0        0        0        0         0          0         0             0         0         0              0
  -Stoon Wash       Quantity                 0        0        0        0         0          0         0             0         0         0              0
                   Value                     0        0        0        0         0          0         0             0         0         0              0
  -Jorjad Quantity                           0        0        0        0         0          0         0             0         0         0              0
                   Value                     0        0        0        0         0          0         0             0         0         0              0
  - Lilion&ShafonQuantity                    0        0        0        0         0          0         0             0         0         0              0
                   Value                     0        0        0        0         0          0         0             0         0         0              0

 @ 10 % of all above                                  0        0        0         0          0         0             0         0         0              0
            Sub-total                                 0        0        0         0          0         0             0         0         0              0
     Total Rawmaterial                                0        0        0         0          0         0             0         0         0              0
Opening Inventory(lmport)                             0        0        0         0          0         0             0         0         0              0
Closing Inventory(lmport)                             0        0        0         0          0         0             0         0         0              0
Opening Inventory(local)                              0        0        0         0          0         0             0         0         0              0
Closing Inventory(local)                              0        0        0         0          0         0             0         0         0              0
      Net Rawmaterial                                 0        0        0         0          0         0             0         0         0              0
Note: 10 days inventory of finished goods.
Financial Analysis                                                                                                                                            3-     .


Appendix-11
                                                MANPOWER REQUIREMENT & COST THEREOFF
                      Year        Monthly           1              2               3        4           5         6            7         8         9               10
                                   Salary                                                       Capacity Utilization in %age
DESCRIPTION                  NOs. Rs. (000)         70            80               90       100        100       100           100       100       100             100
Factory:
Plant Manager                    0          0              0            0               0         0          0           0           0         0          0              0
Production Manager               0          0              0            0               0         0          0           0           0         0          0              0
Engineering Manager              0          0              0            0               0         0          0           0           0         0          0              0
Quality Control Mngr.            0          0              0            0               0         0          0           0           0         0          0              0
Assist. Managers                 0          0              0            0               0         0          0           0           0         0          0              0
Machine operators                0          0              0            0               0         0          0           0           0         0          0              0
Sub-Engineer                     0          0              0            0               0         0          0           0           0         0          0              0
Foremen                          0          0              0            0               0         0          0           0           0         0          0              0
Operators/Drivers                0          0              0            0               0         0          0           0           0         0          0              0
Helpers                          0          0              0            0               0         0          0           0           0         0          0              0
Peons                            0          0              0            0               0         0          0           0           0         0          0              0
Seasonal Labour                  0          0              0            0               0         0          0           0           0         0          0              0
Overheads % *                    0          0              0            0               0         0          0           0           0         0          0              0
      Sub Total                  0                         0            0               0         0          0           0           0         0          0              0
Admin./Sales:
Chief Executive                  0         0               0           0               0        0          0             0         0         0            0            0
General Manager                  0         0               0           0               0        0          0             0         0         0            0            0
G.M. Marketing                   0         0               0           0               0        0          0             0         0         0            0            0
Managers                         2        20             480         497             514      532        551           570       590       611          632          654
Assist. Managers                 2        12             288         298             309      319        330           342       354       366          379          393
Computor Operators               1        10             120         124             129      133        138           143       148       153          158          164
Clerks/Salesmen                  2         8             192         199             206      213        220           228       236       244          253          262
Security Staff                   0         0               0           0               0        0          0             0         0         0            0            0
Peons                            0         0               0           0               0        0          0             0         0         0            0            0
Drivers                          0         0               0           0               0        0          0             0         0         0            0            0
Sweepers                         0         0               0           0               0        0          0             0         0         0            0            0
Seasonal Labour                            0               0           0               0        0          0             0         0         0            0            0
Overheads *                      8         4            1080        1118            1157     1197       1239          1283      1328      1374         1422         1472
       Sub Total                 7                      2160        2236            2314     2395       2479          2565      2655      2748         2844         2944
    Total Expenses               7                      2160        2236            2314     2395       2479          2565      2655      2748         2844         2944
* Overheads 100 % are calculated on basic salary(Basic salary is 70 % of gross).
Financial Analysis                                                                                                                                                      3-     .


Appendix-12
                                                                                       UTILITIES
Power/Elecricity:
                     Connected Laod (Kw)                                                              =                    90
Anual Fixed Charges (Connected Load x 130 x 12)                                                       =                  140.4 Rs. (000)
Anual Variable Charges (Connected Load x 6 x 8 x 1 x 220 x 0.85) =                                                       1212 Rs. (000)

                      Year              0            1              2             3              4            5         6           7              8         9               10
                                        *                                                            Capacity Utilization in %age
DESCRIPTION                         6 month          70             80            90            100           100       100         100            100       100             100

Fixed Charges                           70.2          140.4         140.4          140.4         140.4         140.4     140.4       140.4          140.4     140.4           140.4
Variable Charges                      121.18         848.23          969           1091          1212          1212      1212        1212            1212     1212            1212


           Total                         191         988.63          1110           1231          1352         1352         1352     1352           1352         1352         1352
* Fixed cost taken for 6 months during construction & variable cost at 10 % of 100 % Production Level.


                                                                                          FUEL
                      Year            0              1              2             3              4            5         6           7              8         9               10
                                    Months                                                           Capacity Utilization in %age
DESCRIPTION                             6            70             80            90            100           100       100         100            100       100             100
Fuel for steam Generation
Fuel for Power Generation
Fuel for Vehicles *                          0              0             0              0                0         0          0           0             0          0              0

           Total                             0              0             0              0                0         0          0           0             0          0              0


                                                   STORES & SPARES, REPAIR & MAINTINANCE
                      Year                           1              2             3              4            5         6           7              8         9               10
                                    %age                                                             Capacity Utilization in %age
DESCRIPTION                                          70             80            90            100           100       100         100            100       100             100
Stores & Repairs                             0              0             0              0                0         0          0           0             0          0              0

Repair & Maitinance                          0              0             0              0                0         0          0           0             0          0              0


           Total                                            0             0              0                0         0          0           0             0          0              0
* Stores & Spares are calculated at %age of installed machine cost and with anual increase of                                       0          %
** Repair & Maintinance are calculated at installed cost of Machinery and Building with anual increase of                           0          %
Financial Analysis                                                                                                                            3-     .


Appendix-13
                                          GENERAL & SELLING/MARKETING EXPENSES
                  Year                    1          2          3          4           5         6            7         8         9                10
                               Expenses                                        Capacity Utilization in %age
DESCRIPTION                    @ 100%     70         80         90         100        100        100          100       100       100              100

General Expenses
- Telephone                          5           4          4          5         5           5           5          5         5           5                5
- Fax                                2           1          2          2         2           2           2          2         2           2                2
- Postage                            1           1          1          1         1           1           1          1         1           1                1
- Stationary                        10           7          8          9        10          10          10         10        10          10               10
- Travelling                         8           6          6          7         8           8           8          8         8           8                8
- Legal Expenses                     2           1          2          2         2           2           2          2         2           2                2
- Entertainment                     15          11         12         14        15          15          15         15        15          15               15
- Rents                            100          70         80         90       100         100         100        100       100         100              100
- Others                            12           8         10         11        12          12          12         12        12          12               12
      Sub total                                109        124        140       155         155         155        155       155         155              155
Selling Expenses
- Advertising % of sale 0.13                     6          7          8         9           9           9          9         9           9             9
- Commision %            0.1                     5          6          6         7           7           7          7         7           7             7
- Discounts % of sales 0.1                       5          6          6         7           7           7          7         7           7             7
- Paking Material                     0          0          0          0         0           0           0          0         0           0             0
- Others                             50         35         40         45        50          50          50         50        50          50           50
      Sub total                                 51         58         66        73          73          73         73        73          73           73
        Total                                  160        182        205       228         228         228        228       228         228         228.1
Financial Analysis                                                                                                                         3-     .


Appendix-14

                                                   Working Capital Requirement
                  Year                 1          2          3          4           5         6            7         8         9                10
                              Period                                        Capacity Utilization in %age
DESCRIPTION                   (Days)   70         80         90         100        100        100          100       100       100              100
CURRENT ASSETS:
Raw material imported              0          0          0          0         0           0           0          0         0           0                0
Raw material Local                 0          0          0          0         0           0           0          0         0           0                0
Work in Process                               0          0          0         0           0           0          0         0           0                0
Packing Material                   0          0          0          0         0           0           0          0         0           0                0
Labour                             0          0          0          0         0           0           0          0         0           0                0
Utilities                         30         90        101        112       123         123         123        123       123         123              123
Factory Overheads                  0          0          0          0         0           0           0          0         0           0                0
Selling & Admin. Expenses          0          0          0          0         0           0           0          0         0           0                0
Finished Goods Inventory           0          0          0          0         0           0           0          0         0           0                0
Accounts Recievable                0          0          0          0         0           0           0          0         0           0                0
Advances & Deposits                         500          0          0         0           0           0          0         0           0                0
Cash                                        500        500        500       500         500         500        500       500         500              500
Sub Total                                  1090        601        612       623         623         623        623       623         623              623
CURRENT LIABILITIES:
Accounts Payable                  30         0           0          0         0           0           0          0         0           0                0
Short Term Borrowing     60                  0           0          0         0           0           0          0         0           0                0
@ % of stocks
Sub Total                                    0           0          0         0           0           0          0         0           0                0

    Net Initial Working Capital            1090        601        612       623         623         623        623       623         623              623
Financial Analysis                                                                                                       3-   .


Appendix-16
                                     LOAN REPAYMENT SCHEDULE

       Loan Type         : Foreign Currency
       Total Loan Amount:           0                                                            0       e33
       Rate of Interest :          18 %                                                                          18
       Repayment Period:          3.5 Year                              A. F =            27.66                      9
       Grace Period     :         0.5 Year                                                                           1
       Per Year Installments :          12 (half yearly)                                                             2
       Total Installments    :          36
       Installment Amount :              0 (including intrest during construction for half year)
       Total Amount to be Paid           0
       Total Mark-up Amount              0

                                                                                     Rs. (000)
                     Due Date    Principal Paid          Instal. of      Balance Mark-up Installment      Yearly
                                                         Int. D. Cons                                     Interest
          1                              0             0            0            0               0   0
          2                              0             0            0            0               0   0               0
          3                              0             0            0            0               0   0
          4                              0             0            0            0               0   0               0
          5                              0             0            0            0               0   0
          6                              0             0            0            0               0   0               0
          7                              0             0            0            0               0   0
          8                              0             0            0            0               0   0               0
          9                              0             0            0            0               0   0
          10                             0             0            0            0               0   0               0
          11                             0             0            0            0               0   0
          12                             0             0            0            0               0   0               0
          13                             0             0            0            0               0   0
          14                             0             0            0            0               0   0               0
          15                             0             0            0            0               0   0
          16                             0             0            0            0               0   0               0
          17
          18
          19
          20
Financial Analysis                                                                                                        3-   .


Appendix-17
                                      LOAN REPAYMENT SCHEDULE

       Loan Type         : LMM
       Total Loan Amount:                    0
       Rate of Interest :                    8%
       Repayment Period:                     9 Year                       A. F =            11.65
       Grace Period     :                    1 Year
       Per Year Installments :            2 (half yearly)
       Total Installments    :           16
       Installment Amount :               0 (including intrest during construction for half year)
       Total Amount to be Paid            0
       Total Mark-up Amount               0

                                                                                       Rs. (000)
                     Due Date    Principal        Paid     Instal. of      Balance Mark-up Installment     Yearly
                                                           Int. D. Cons                                    Interest
          1                                  0           0            0            0               0   0
          2                                  0           0            0            0               0   0              0
          3                                  0           0            0            0               0   0
          4                                  0           0            0            0               0   0              0
          5                                  0           0            0            0               0   0
          6                                  0           0            0            0               0   0              0
          7                                  0           0            0            0               0   0
          8                                  0           0            0            0               0   0              0
          9                                  0           0            0            0               0   0
          10                                 0           0            0            0               0   0              0
          11                                 0           0            0            0               0   0
          12                                 0           0            0            0               0   0              0
          13                                 0           0            0            0               0   0
          14                                 0           0            0            0               0   0              0
          15                                 0           0            0            0               0   0
          16                                 0           0            0            0               0   0              0
          17
          18
          19
          20
Financial Analysis                                                                                                       3-   .


Appendix-18
                                      LOAN REPAYMENT SCHEDULE

       Loan Type         : LCY Loan
       Total Loan Amount:         0
       Rate of Interest :         8%
       Repayment Period:          9 Year                                 A. F =            11.65
       Grace Period     :         1 Year
       Per Year Installments :            2 (half yearly)
       Total Installments    :           16
       Installment Amount :               0 (including intrest during construction for half year)
       Total Amount to be Paid            0
       Total Mark-up Amount               0

                                                                                      Rs. (000)
                     Due Date    Principal       Paid     Instal. of      Balance Mark-up Installment     Yearly
                                                          Int. D. Cons                                    Interest
          1                                  0          0            0            0               0   0
          2                                  0          0            0            0               0   0              0
          3                                  0          0            0            0               0   0
          4                                  0          0            0            0               0   0              0
          5                                  0          0            0            0               0   0
          6                                  0          0            0            0               0   0              0
          7                                  0          0            0            0               0   0
          8                                  0          0            0            0               0   0              0
          9                                  0          0            0            0               0   0
          10                                 0          0            0            0               0   0              0
          11                                 0          0            0            0               0   0
          12                                 0          0            0            0               0   0              0
          13                                 0          0            0            0               0   0
          14                                 0          0            0            0               0   0              0
          15                                 0          0            0            0               0   0
          16                                 0          0            0            0               0   0              0
          17
          18
          19
          20
Financial Analysis                                                                                                    3-   .


Appendix-19
                                      LOAN REPAYMENT SCHEDULE

       Loan Type         :
       Total Loan Amount:                    0
       Rate of Interest :                    4%
       Repayment Period:                     8 Year                         A. F =               0
       Grace Period     :                    1 Year
       Per Year Installments :               2 (half yearly)
       Total Installments    :               0
       Installment Amount :                  0 (including intrest during construction for half year)
       Total Amount to be Paid               0
       Total Mark-up Amount                  0

                                                                                     Rs. (000)
                     Due Date    Principal         Paid      Instal. of      Balance Mark-up Installment   Yearly
                                                             Int. D. Cons                                  Interest
          1
          2
          3
          4
          5
          6
          7
          8
          9
          10
          11
          12
          13
          14
          15
          16
          17
          18
          19
          20
Financial Analysis                                                                                                       3-   .


       Table- 9
                          INTERNAL FINANCIAL RATE OF RETURN

        YEAR         CAPITAL           OPER.          DEPREC-     TAXES     W.P.F     NET CASH Discouted value
                     OUTLAY           PROFIT           ATION                           FLOW          @ % age
                                                                                                      175          190
          0                7121                                                           -7121     -7121        -7121

          1                                    1529          52       619       153         809       294         279

          2                                    2008          52       813       201        1046       138         124

          3                                    2485          52      1006       249        1282        62          53

          4                                    2959          52      1198       296        1517        27          21

          5                                    2875          52      1164       288        1475         9           7

          6                                    2788          52      1129       279        1432         3           2

          7                                    2698          52      1093       270        1388         1           1

          8                                    2606          52      1055       261        1342         0           0

          9                                    2509          52      1016       251        1294         0           0

          10                                   2410          52       976       241        1245         0           0
       S. Value                570                                                          570         0           0
               11
                                                                                                  -6586.23   -6633.22


                                     I.F.R.R     =     -1927.279 %
Financial Analysis                                                                                                 3-   .


Appendix-20
                                        BENEFIT-COST RATIO
                                   * Discounted @ Opp. cost rate %         17
        YEAR Project/Production     Sales/        Net       Discoun- Discoun- Discoun- Discounted value of
                     Cost          Benefits       Cash      ted Cost ted      ted Net   Discounted net cash flow
                                                  Flow               Benefits Cash Flow        @ % age

                                                                                                   20         21
          0                 7121              0     -7121       #N/A        #N/A     #N/A        #N/A      #N/A

          1                 3319        4900         1581       #N/A        #N/A     #N/A        #N/A      #N/A

          2                 3540        5600         2060       #N/A        #N/A     #N/A        #N/A      #N/A

          3                 3763        6300         2537       #N/A        #N/A     #N/A        #N/A      #N/A

          4                 3989        7000         3011       #N/A        #N/A     #N/A        #N/A      #N/A

          5                 4073        7000         2927       #N/A        #N/A     #N/A        #N/A      #N/A

          6                 4160        7000         2840       #N/A        #N/A     #N/A        #N/A      #N/A

          7                 4249        7000         2751       #N/A        #N/A     #N/A        #N/A      #N/A

          8                 4342        7000         2658       #N/A        #N/A     #N/A        #N/A      #N/A

          9                 4439        7000         2561       #N/A        #N/A     #N/A        #N/A      #N/A

          10                4538        7000         2462       #N/A        #N/A     #N/A        #N/A      #N/A

                                                                #N/A        #N/A     #N/A        #N/A      #N/A


               BENEFIT COST RATIO       =            #N/A
                                                                       I.F.R.R. =    #N/A %
Financial Analysis                                                                                                         3-   .


       Table-8
                                     PAYBACK PERIOD


        YEAR         CAPITAL          OPER.     DEPREC-    TAXES      W.P.F     NET CASH Payback      Balance
                     OUTLAY          PROFIT      ATION                           FLOW     Years       Net Cash
                                                                                                        Flow
          0                7121                                                     -7121

          1                              1529         52       619        153        809      1.000       -6312

          2                              2008         52       813        201       1046      1.000       -5266

          3                              2485         52      1006        249       1282      1.000       -3984

          4                              2959         52      1198        296       1517      1.000       -2467

          5                              2875         52      1164        288       1475      1.000           -992

          6                              2788         52      1129        279       1432      0.693             0

          7                              2698         52      1093        270       1388      0.000             0

          8                              2606         52      1055        261       1342      0.000             0

          9                              2509         52      1016        251       1294      0.000             0

          10                             2410         52       976        241       1245      0.000             0
       S. Value                570                                                   570

                                                                     Payback Period =       5.693     Years
                                                                                                                     >10
Financial Analysis                                                                                                          3-   .


Appendix-21
                                         BENEFIT-COST RATIO
                                     * Discounted @ Inflation rate %        10
        YEAR Project/Production     Sales/        Net       Discoun- Discoun- Discoun-           Discounted value of
                     Cost          Benefits       Cash      ted Cost ted      ted Net            Discounted net cash flow
                                                  Flow                  Benefits     Cash Flow          @ % age

                                                                                                          20           21
          0                 7121              0     -7121        #N/A        #N/A         #N/A          #N/A        #N/A

          1                 3319        4900         1581        #N/A        #N/A         #N/A          #N/A        #N/A

          2                 3540        5600         2060        #N/A        #N/A         #N/A          #N/A        #N/A

          3                 3763        6300         2537        #N/A        #N/A         #N/A          #N/A        #N/A

          4                 3989        7000         3011        #N/A        #N/A         #N/A          #N/A        #N/A

          5                 4073        7000         2927        #N/A        #N/A         #N/A          #N/A        #N/A

          6                 4160        7000         2840        #N/A        #N/A         #N/A          #N/A        #N/A

          7                 4249        7000         2751        #N/A        #N/A         #N/A          #N/A        #N/A

          8                 4342        7000         2658        #N/A        #N/A         #N/A          #N/A        #N/A

          9                 4439        7000         2561        #N/A        #N/A         #N/A          #N/A        #N/A

          10                4538        7000         2462        #N/A        #N/A         #N/A          #N/A        #N/A

                                                                 #N/A        #N/A         #N/A          #N/A        #N/A


               BENEFIT COST RATIO       =            #N/A
                                                                        I.F.R.R. =        #N/A %
Financial Analysis                                                                         3-   .


Table-7
                     BREAKE-EVEN ANALYSIS
                         @ 100 % Production Capacity


                                                   Fixed       Variable       Total
                     DESCRIPTION                   Cost          Cost         Cost
        - Raw Material                                                    0        0
        - Catalyst                                                        0        0
        - Wages & Salaries                                0                        0
        - Utilities                                   140.4        1212         1352
        - Furnace /Vehicle Oil                                        0            0
        - Stores & Spares                                  0          0            0
        - Repair & Maintinance                             0          0            0
        - Packing Material                                            0            0
        - Depreciation                                   52                       52
        - Manufacturing Overhead                         10               4       14
        - Admin Salaries                               2479                     2479
        - General Expenses                               62           93         155
        - Selling, Marketing Expense                       4          69              73
       Interest On Loans:
       - FCY Loan                                         0                        0
       - LMM Loan                                         0                        0
       - LCY loan                                         0                        0
       - Short Term Loan                                  0                        0
       - Bridge Financing                                 0                        0
       - Debenture                                        0                        0
       W.P. Fund                                        288                      288
       Tax Provision                                   1164                     1164

                         Total                         4198        1378         5577

               Sales          =           7000
               Variable Cost =            1378
               Contrib. Margin =          5622

               Breake-even Point (% age of Capacity Utilization)     =           74.7 %
Financial Analysis   3-   .

Weitere ähnliche Inhalte

Andere mochten auch

Christthe Redeemerin Rio
Christthe Redeemerin RioChristthe Redeemerin Rio
Christthe Redeemerin Rio
guest8045a5
 
Pitch appetify yumyum 3
Pitch appetify yumyum 3Pitch appetify yumyum 3
Pitch appetify yumyum 3
Trung Huynh
 

Andere mochten auch (18)

Sample of internship performance evaluation form
Sample of internship performance evaluation formSample of internship performance evaluation form
Sample of internship performance evaluation form
 
Designing And Managing Integrated Marketing Channels
Designing And Managing Integrated Marketing ChannelsDesigning And Managing Integrated Marketing Channels
Designing And Managing Integrated Marketing Channels
 
Life with social networking websites
Life with social networking websitesLife with social networking websites
Life with social networking websites
 
Basic Definitions Of Business Research Methods
Basic Definitions Of Business Research MethodsBasic Definitions Of Business Research Methods
Basic Definitions Of Business Research Methods
 
Capital market
Capital marketCapital market
Capital market
 
Attitude in Business and Humanizing Business
Attitude in Business and Humanizing BusinessAttitude in Business and Humanizing Business
Attitude in Business and Humanizing Business
 
Team Building
Team BuildingTeam Building
Team Building
 
Introduction To Operation Management
Introduction To Operation ManagementIntroduction To Operation Management
Introduction To Operation Management
 
Math Lab(2)
Math Lab(2)Math Lab(2)
Math Lab(2)
 
Christthe Redeemerin Rio
Christthe Redeemerin RioChristthe Redeemerin Rio
Christthe Redeemerin Rio
 
Ubiquitous Computing
Ubiquitous ComputingUbiquitous Computing
Ubiquitous Computing
 
It
ItIt
It
 
Union Europea
Union EuropeaUnion Europea
Union Europea
 
Ontology Vs Methodology
Ontology Vs MethodologyOntology Vs Methodology
Ontology Vs Methodology
 
Architects skill gap analysis
Architects skill gap analysisArchitects skill gap analysis
Architects skill gap analysis
 
Financial Indicators for Ci Os 2010 - summary
Financial Indicators for Ci Os 2010 - summaryFinancial Indicators for Ci Os 2010 - summary
Financial Indicators for Ci Os 2010 - summary
 
Pitch appetify yumyum 3
Pitch appetify yumyum 3Pitch appetify yumyum 3
Pitch appetify yumyum 3
 
Architecture Driven IT Modernization & Migration roadmap
Architecture Driven IT Modernization & Migration roadmapArchitecture Driven IT Modernization & Migration roadmap
Architecture Driven IT Modernization & Migration roadmap
 

Ähnlich wie Complete financial projection for business plan

097658 M I B P C2009 Business Plan Financials Template
097658  M I B P C2009  Business  Plan  Financials  Template097658  M I B P C2009  Business  Plan  Financials  Template
097658 M I B P C2009 Business Plan Financials Template
Ai'dil Mahumdin
 
Frontline Q3 2012 results presentation
Frontline Q3 2012 results presentationFrontline Q3 2012 results presentation
Frontline Q3 2012 results presentation
TradeWindsnews
 
Proforma cf (1)
Proforma cf (1)Proforma cf (1)
Proforma cf (1)
barsara09
 
Cost Statement For Cps Nov 2008
Cost Statement For Cps Nov 2008Cost Statement For Cps Nov 2008
Cost Statement For Cps Nov 2008
mohamedrsa
 
Midterm solutions
Midterm solutionsMidterm solutions
Midterm solutions
emahacct
 
Ahs provisional-31 st dec 2011 (6)
Ahs provisional-31 st dec 2011 (6)Ahs provisional-31 st dec 2011 (6)
Ahs provisional-31 st dec 2011 (6)
kiransagam
 
Ahs provisional-31 st dec 2011 (6)
Ahs provisional-31 st dec 2011 (6)Ahs provisional-31 st dec 2011 (6)
Ahs provisional-31 st dec 2011 (6)
kiransagam
 
Ahs provisional-31 st dec 2011 (6)
Ahs provisional-31 st dec 2011 (6)Ahs provisional-31 st dec 2011 (6)
Ahs provisional-31 st dec 2011 (6)
kiransagam
 
Assessment of the ANZ-RBS Merger in Asia Pacific
Assessment of the ANZ-RBS Merger in Asia PacificAssessment of the ANZ-RBS Merger in Asia Pacific
Assessment of the ANZ-RBS Merger in Asia Pacific
hbhardwaj
 
Northampton Budget FY2012 as of 31 March 2011
Northampton Budget FY2012 as of 31 March 2011Northampton Budget FY2012 as of 31 March 2011
Northampton Budget FY2012 as of 31 March 2011
Adam Cohen
 
delta air line 2006 sep
delta air line 2006 sepdelta air line 2006 sep
delta air line 2006 sep
finance13
 
Assign 1 sem 3 11 12-revised
Assign 1  sem 3 11 12-revisedAssign 1  sem 3 11 12-revised
Assign 1 sem 3 11 12-revised
nazrinazlan
 

Ähnlich wie Complete financial projection for business plan (20)

097658 M I B P C2009 Business Plan Financials Template
097658  M I B P C2009  Business  Plan  Financials  Template097658  M I B P C2009  Business  Plan  Financials  Template
097658 M I B P C2009 Business Plan Financials Template
 
Ifrs 1 case study with q & a
Ifrs 1 case study with q & aIfrs 1 case study with q & a
Ifrs 1 case study with q & a
 
Frontline Q3 2012 results presentation
Frontline Q3 2012 results presentationFrontline Q3 2012 results presentation
Frontline Q3 2012 results presentation
 
Proforma cf (1)
Proforma cf (1)Proforma cf (1)
Proforma cf (1)
 
Cost Statement For Cps Nov 2008
Cost Statement For Cps Nov 2008Cost Statement For Cps Nov 2008
Cost Statement For Cps Nov 2008
 
Midterm solutions
Midterm solutionsMidterm solutions
Midterm solutions
 
Ahs provisional-31 st dec 2011 (6)
Ahs provisional-31 st dec 2011 (6)Ahs provisional-31 st dec 2011 (6)
Ahs provisional-31 st dec 2011 (6)
 
Ahs provisional-31 st dec 2011 (6)
Ahs provisional-31 st dec 2011 (6)Ahs provisional-31 st dec 2011 (6)
Ahs provisional-31 st dec 2011 (6)
 
Ahs provisional-31 st dec 2011 (6)
Ahs provisional-31 st dec 2011 (6)Ahs provisional-31 st dec 2011 (6)
Ahs provisional-31 st dec 2011 (6)
 
Mca afm qb
Mca afm qbMca afm qb
Mca afm qb
 
Assessment of the ANZ-RBS Merger in Asia Pacific
Assessment of the ANZ-RBS Merger in Asia PacificAssessment of the ANZ-RBS Merger in Asia Pacific
Assessment of the ANZ-RBS Merger in Asia Pacific
 
Northampton Budget FY2012 as of 31 March 2011
Northampton Budget FY2012 as of 31 March 2011Northampton Budget FY2012 as of 31 March 2011
Northampton Budget FY2012 as of 31 March 2011
 
FICPA - What Sureties Want To See In Financial Statements
FICPA - What Sureties Want To See In Financial StatementsFICPA - What Sureties Want To See In Financial Statements
FICPA - What Sureties Want To See In Financial Statements
 
04 Completing the Accounting Cycle
04 Completing the Accounting Cycle04 Completing the Accounting Cycle
04 Completing the Accounting Cycle
 
Management Discussion and Analysis Year Ended
Management Discussion and Analysis Year EndedManagement Discussion and Analysis Year Ended
Management Discussion and Analysis Year Ended
 
Startup - Finance and funding 1
Startup - Finance and funding 1Startup - Finance and funding 1
Startup - Finance and funding 1
 
delta air line 2006 sep
delta air line 2006 sepdelta air line 2006 sep
delta air line 2006 sep
 
IASBO 2012-The Audit, what to look for and what to communicate to your board
IASBO 2012-The Audit, what to look for and what to communicate to your boardIASBO 2012-The Audit, what to look for and what to communicate to your board
IASBO 2012-The Audit, what to look for and what to communicate to your board
 
Simple Cashflow Model
Simple Cashflow ModelSimple Cashflow Model
Simple Cashflow Model
 
Assign 1 sem 3 11 12-revised
Assign 1  sem 3 11 12-revisedAssign 1  sem 3 11 12-revised
Assign 1 sem 3 11 12-revised
 

Kürzlich hochgeladen

The Abortion pills for sale in Qatar@Doha [+27737758557] []Deira Dubai Kuwait
The Abortion pills for sale in Qatar@Doha [+27737758557] []Deira Dubai KuwaitThe Abortion pills for sale in Qatar@Doha [+27737758557] []Deira Dubai Kuwait
The Abortion pills for sale in Qatar@Doha [+27737758557] []Deira Dubai Kuwait
daisycvs
 

Kürzlich hochgeladen (20)

Escorts in Nungambakkam Phone 8250092165 Enjoy 24/7 Escort Service Enjoy Your...
Escorts in Nungambakkam Phone 8250092165 Enjoy 24/7 Escort Service Enjoy Your...Escorts in Nungambakkam Phone 8250092165 Enjoy 24/7 Escort Service Enjoy Your...
Escorts in Nungambakkam Phone 8250092165 Enjoy 24/7 Escort Service Enjoy Your...
 
Uneak White's Personal Brand Exploration Presentation
Uneak White's Personal Brand Exploration PresentationUneak White's Personal Brand Exploration Presentation
Uneak White's Personal Brand Exploration Presentation
 
Call 7737669865 Vadodara Call Girls Service at your Door Step Available All Time
Call 7737669865 Vadodara Call Girls Service at your Door Step Available All TimeCall 7737669865 Vadodara Call Girls Service at your Door Step Available All Time
Call 7737669865 Vadodara Call Girls Service at your Door Step Available All Time
 
Pre Engineered Building Manufacturers Hyderabad.pptx
Pre Engineered  Building Manufacturers Hyderabad.pptxPre Engineered  Building Manufacturers Hyderabad.pptx
Pre Engineered Building Manufacturers Hyderabad.pptx
 
Getting Real with AI - Columbus DAW - May 2024 - Nick Woo from AlignAI
Getting Real with AI - Columbus DAW - May 2024 - Nick Woo from AlignAIGetting Real with AI - Columbus DAW - May 2024 - Nick Woo from AlignAI
Getting Real with AI - Columbus DAW - May 2024 - Nick Woo from AlignAI
 
Katrina Personal Brand Project and portfolio 1
Katrina Personal Brand Project and portfolio 1Katrina Personal Brand Project and portfolio 1
Katrina Personal Brand Project and portfolio 1
 
WheelTug Short Pitch Deck 2024 | Byond Insights
WheelTug Short Pitch Deck 2024 | Byond InsightsWheelTug Short Pitch Deck 2024 | Byond Insights
WheelTug Short Pitch Deck 2024 | Byond Insights
 
Marel Q1 2024 Investor Presentation from May 8, 2024
Marel Q1 2024 Investor Presentation from May 8, 2024Marel Q1 2024 Investor Presentation from May 8, 2024
Marel Q1 2024 Investor Presentation from May 8, 2024
 
Falcon Invoice Discounting: Empowering Your Business Growth
Falcon Invoice Discounting: Empowering Your Business GrowthFalcon Invoice Discounting: Empowering Your Business Growth
Falcon Invoice Discounting: Empowering Your Business Growth
 
Kalyan Call Girl 98350*37198 Call Girls in Escort service book now
Kalyan Call Girl 98350*37198 Call Girls in Escort service book nowKalyan Call Girl 98350*37198 Call Girls in Escort service book now
Kalyan Call Girl 98350*37198 Call Girls in Escort service book now
 
Berhampur CALL GIRL❤7091819311❤CALL GIRLS IN ESCORT SERVICE WE ARE PROVIDING
Berhampur CALL GIRL❤7091819311❤CALL GIRLS IN ESCORT SERVICE WE ARE PROVIDINGBerhampur CALL GIRL❤7091819311❤CALL GIRLS IN ESCORT SERVICE WE ARE PROVIDING
Berhampur CALL GIRL❤7091819311❤CALL GIRLS IN ESCORT SERVICE WE ARE PROVIDING
 
The Abortion pills for sale in Qatar@Doha [+27737758557] []Deira Dubai Kuwait
The Abortion pills for sale in Qatar@Doha [+27737758557] []Deira Dubai KuwaitThe Abortion pills for sale in Qatar@Doha [+27737758557] []Deira Dubai Kuwait
The Abortion pills for sale in Qatar@Doha [+27737758557] []Deira Dubai Kuwait
 
Buy gmail accounts.pdf buy Old Gmail Accounts
Buy gmail accounts.pdf buy Old Gmail AccountsBuy gmail accounts.pdf buy Old Gmail Accounts
Buy gmail accounts.pdf buy Old Gmail Accounts
 
Phases of Negotiation .pptx
 Phases of Negotiation .pptx Phases of Negotiation .pptx
Phases of Negotiation .pptx
 
Horngren’s Cost Accounting A Managerial Emphasis, Canadian 9th edition soluti...
Horngren’s Cost Accounting A Managerial Emphasis, Canadian 9th edition soluti...Horngren’s Cost Accounting A Managerial Emphasis, Canadian 9th edition soluti...
Horngren’s Cost Accounting A Managerial Emphasis, Canadian 9th edition soluti...
 
Cannabis Legalization World Map: 2024 Updated
Cannabis Legalization World Map: 2024 UpdatedCannabis Legalization World Map: 2024 Updated
Cannabis Legalization World Map: 2024 Updated
 
Lucknow Housewife Escorts by Sexy Bhabhi Service 8250092165
Lucknow Housewife Escorts  by Sexy Bhabhi Service 8250092165Lucknow Housewife Escorts  by Sexy Bhabhi Service 8250092165
Lucknow Housewife Escorts by Sexy Bhabhi Service 8250092165
 
Chennai Call Gril 80022//12248 Only For Sex And High Profile Best Gril Sex Av...
Chennai Call Gril 80022//12248 Only For Sex And High Profile Best Gril Sex Av...Chennai Call Gril 80022//12248 Only For Sex And High Profile Best Gril Sex Av...
Chennai Call Gril 80022//12248 Only For Sex And High Profile Best Gril Sex Av...
 
SEO Case Study: How I Increased SEO Traffic & Ranking by 50-60% in 6 Months
SEO Case Study: How I Increased SEO Traffic & Ranking by 50-60%  in 6 MonthsSEO Case Study: How I Increased SEO Traffic & Ranking by 50-60%  in 6 Months
SEO Case Study: How I Increased SEO Traffic & Ranking by 50-60% in 6 Months
 
UAE Bur Dubai Call Girls ☏ 0564401582 Call Girl in Bur Dubai
UAE Bur Dubai Call Girls ☏ 0564401582 Call Girl in Bur DubaiUAE Bur Dubai Call Girls ☏ 0564401582 Call Girl in Bur Dubai
UAE Bur Dubai Call Girls ☏ 0564401582 Call Girl in Bur Dubai
 

Complete financial projection for business plan

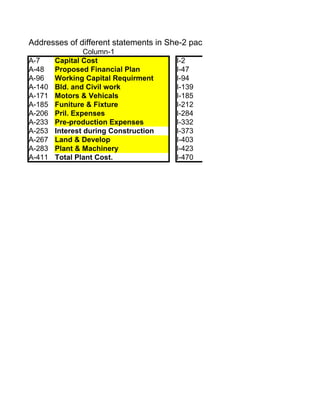
  • 1. Addresses of different statements in She-2 package Column-1 Column-2 A-7 Capital Cost I-2 A-48 Proposed Financial Plan I-47 A-96 Working Capital Requirment I-94 A-140 Bld. and Civil work I-139 A-171 Motors & Vehicals I-185 A-185 Funiture & Fixture I-212 A-206 Pril. Expenses I-284 A-233 Pre-production Expenses I-332 A-253 Interest during Construction I-373 A-267 Land & Develop I-403 A-283 Plant & Machinery I-423 A-411 Total Plant Cost. I-470
  • 2. he-2 package Column-2 Column-3 Projt. Income Statement W-2 Loan Repayment Projt. Cash Flow W-47 Loan Repayment Projt. Balance Sheet(Asst) W-94 Loan Repayment Projt. Balance Sheet(Liab) W-139 Loan Repayment Depreciation Schedule W-186 IFRR Projected Sales W-232 Cost Benefit Ratio Raw material requirement W-280 Payback Period Manpower requi. W-327 Cost Benefit Ratio Discounted Utilities W-372 Break even analysis Stores & Spares Gen. & Selling Exp. Detailed working Capital
  • 3. Financial Analysis 3- . Project Title : Boutique and Garment Factory Location : Distt. Lahore Table-1 CAPITAL COST OF THE PROJECT (Rs. in ,000) Description Local Foreign Total - Land 0 0 Appendix-1 - Building & Civil Works 0 0 Appendix-2 - Plant & Machinery 207 0 207 Appendix-3 - Errection & Installation % of P. & Machin 10 21 21 - Motors & Vehicles 0 0 Appendix-4 - Furniture & Fixture 473 473 Appendix-5 - Preliminary Expenses * take from Appendix-6 3464 3464 Appendix-6 - Pre-production Expenses 77 77 Appendix-7 - Intrest During Construction 0 0 Appendix-8 - Contingencies 424 0 424 Fixed Capital Cost 4666 0 4666 Working Capital 2455 2455 Table-3 Total 7121 0 7121 Construction Period = 1 Year Local Contingencies excluding land & motor & vehicles % 10 Foreign Contingencies % 0
  • 4. Financial Analysis 3- . Table-2 PROPSED FINANCIAL PLAN: (Rs. in ,000) Description Local Foreign Total Equity - Local Sponsors 7121 7121 - Foreign Sponsors 0 0 - Bridge Financing 0 0 Total Equity 7121 0 7121 Loans - Foreign Currency 0 0 - Suppliers Credit 0 0 - LMM 0 0 - Long Term Finance 0 0 - Custom Debenture 0 0 Total Debts 0 0 0 Total Investment 7121 0 7121 Debt % 0 0 Equity % 100 7121
  • 5. Financial Analysis 3- . Table-3 Working Capital Requirement Description Period(Days) Amount Rs. (000) Raw material imported 0 0 Raw material Local 0 0 Work in Process 0 Packing Material 0 0 Salaries 30 0 Utilities 30 90 Overheads 30 1 Selling & Admin. Expenses 30 196 Finished Goods Inventory 0 0 Accounts Recievable 45 668 Advances & Deposits 500 Cash 1000 Sub Total 2455 Accounts Payable 0 0 Short Term Borrowing @ % of stocks 0 0 Sub Total 0 Net Initial Working Capital 2455
  • 6. Financial Analysis 3- . Appendix-2 BUILDING & CIVIL WORKS Description Dimension Area Rate Total Ft. x Ft. Sq. Ft Rs. /Sq.Ft. Rs. (000) Buildings 0 0 0 0 0 Raw Material Store 0 0 0 0 0 Stores & Spares 0 0 0 0 0 Finished Goods Store 0 0 0 0 0 Workshop 0 0 0 0 0 Display shop 0 0 0 0 0 Labratory 0 0 0 0 0 Canteen 0 0 0 0 0 Dispensary 0 0 0 0 0 Admin Block 0 0 0 0 0 Time Office 0 0 0 0 0 Staff Colony-A 0 0 0 0 Staff Colony-B 0 0 0 0 Elecctric Sub-station 0 0 0 0 Toilets 0 15 0 150 0 Cooling Pond 0 0 0 0 Boudary Wall (running feet) 0 0 0 0 Drain (open Excludind Pumps) 1 0 0 0 0 Cooling Tower 1 0 0 0 0 Tubewell 0 Water Tanks(under ground) 0 0 Water Tanks(Over head) 0 0 Internal Roads 0 0 0 0 0 Others 0 0 0 0 0 Total 0 0 Appendix-4 MOTORS & VEHICLES Description NOs. Value Total Rs. (000) Rs. (000) Toyota SA Salon 1975cc 0 0 0 Honda VTI Auto 1590CC 0 0 0 Suzuki Baleno 1300cc JXR 0 0 0 Mercedez Bus 0 0 0 T-3500 Cargo Truck 0 0 0 Fork Lifters 0 0 Tractors (Dozer & Cultivator) 0 0 Total 0 0
  • 7. Financial Analysis 3- . Appendix-5 FURNITURE & FIXTURE Description NOs. Value Total Rs. (000) Rs. (000) Computers 5 30 150 Printers (Dot Matrix) 2 6 12 Printer (Laser) 1 20 20 Fax Machine 1 10 10 Type Writer (manual) 0 0 0 Cabnets 6 15 90 Office Tables with Chairs 6 1.5 9 Chairs 12 1 12 Executive Chairs & Tables etc. 5 5 25 Telephones & Exchange 15 Conference Room 40 Air Conditoners 2 20 40 Others 50 Total 473 Appendix-6 PRELIMINARY EXPENSES Description Amount Period * Rate Charged (months) (%) Rs. (000) Project Examination Fee 0 0 0 Commitment Charges - FCY Loan 0 6 0 0 - LMM Loan 0 6 0 0 - LCY Loan 0 6 0 0 - Short Term Finance Certificate 0 6 0 0 Legal Documentation Fee 0 0 Project Supervision Fee 0 0 Company Incorporation 5 Electric Connection 10 Consultancy 0 Others 20 Total 35 * Based on one year construction period.
  • 8. Financial Analysis 3- . Appendix-7 PRE-PRODUCTION EXPENSES Description Amount Period Rate * Charged (months) (%) Rs. (000) Salaries 2160 1 15 27 Utilities 191 1 1 0 Administrative Expense 0 1 1 0 Staff Training 0 Travelling/Entertainment etc. 0 Raw Material 0 0 Trial/Commisioning Others 50 Sales of Goods Total 77 * Calculated on the basis of first year expenses Appendix-8 INTEREST DURING CONSTRUCTION Description Amount Period * Rate Charged (months) (%) Rs. (000) FCY Loan 0 0 0 0 LMM Loan 0 0 0 0 LCY Loan 0 0 0 0 Others Total 0 Appendix-1 LAND & DEVELOPMENT Description Area Rate Total (kanals) Rs. (000) Rs. (000) Land 0 0 0 Legal Fee @ 10 % 0 Access Road/Right of Way @ 5 % 0 Developmenr Charges @ 2 % 0 Others Total 0
  • 9. Financial Analysis 3- . Appendix-3 PLANT & MACHINERY Description Rate NOs. Rate Total %age Rs. (000) Rs. (000) Main Equipment: (A)- Imported FOB Value: - Rotary Belt Dryer 0 0 0 - Centrifuge 0 0 0 - Rotary Belt Vacuum Filter 0 0 0 - Plate Type Exchanger 0 0 0 - Shell & Tube Exchanger 0 0 0 - Evaporators 0 0 0 - 0 - 0 - 0 - 0 - 0 - 0 - 0 - - Piping & Valves @ % of Eq. cost 0 0 Subtotal 0 Freight % of FOB 0 0 C&F Value 0 Insurance % of FOB 0 0 CIF Value 0 Duties % of CIF 0 0 Sales Tax % of (CIF + Duties) 0 0 Iqra Surcharge of CIF 0 0 Flood Relief % of CIF 0 0 Import Licence Fee % of C&F 0 0 Bank Charges % of C&F 0 0 Clearing Charges 0.5% of FOB 0 0 Inland Freight * 0 Inland Insurance % of CIF 0 0 Sundry Expenses** 0 Total 0 * Freight is charged Rs. 1000 per ton from Karachi to up country site. ** Sundry Expenses includes Port handling, Octroi etc. Continued....
  • 10. Financial Analysis 3- . Description Rate NOs. Rate Total %age Rs. (000) Rs. (000) (B)- Local Equipment: - Juki 0 0 0 - Overloc Machine 0 0 0 #NAME? 0 0 0 - Flate Loc Machine 0 0 0 - Embroidary Machine (Singer) 0 0 0 - Vessels (5 m3) Special 0 0 0 - Pumps (1 hp) 0 0 0 - Pumps (0.5 hp) Special 0 0 0 - Motors (5 hp) 0 0 0 - Generator (5 hp) 0 0 0 - Air Compressor 0 0 0 - Conveyor Belts 0 0 0 - Filters 0 0 0 - 0 - 0 - Piping & Valves @ % of Eq. cost 0 0 Subtotal 0 Inland Freight * 25 Inland Insurance 10 Sundry Expenses** 30 Total (B) 65 Continued....
  • 11. Financial Analysis 3- . Description Rate NOs. Rate Total %age Rs. (000) Rs. (000) (C)- Electrical & Instrumentation: Instrumentation including DCS 0 0 Motors/Switch gears/Elect. & Lighting 0 Trasformers 0 Uninterrupted Power Supply(UPS) 1 50 50 Motor Control Centers 0 Total (C) 50 (D)- Utilities Tube Well 0 Boiler ( 10 tons/hr) 0 Water Treatment (200 gpm) 0 Steam & Air lines with accessories % of Eq. 0 0 Insulation (pipes, reactors etc.) % of Eq. 0 0 Water lines 0 Instrument Air compressor 0 Laboratory 0 Cooling Tower 0 Air Conditioning unit 2 20 80 Duct lines 0 Workshop Equipment (lath, tools etc) 0 Photocopy machine 1 10 12 Overhead crane 0 Furnace Oil Tank 0 Paints 0 Generator Others Total (D) 92 Total (B)+(C)+(D) - local Equipment 207 Total (A)+(B)+(C)+(D) - All Equipment 207
  • 14. Financial Analysis 3- . Table-4 PROJECTED INCOME STATEMENT Rs. (000) Year 1 2 3 4 5 6 7 8 9 10 Capacity Utilization in %age DESCRIPTION 70 80 90 100 100 100 100 100 100 100 Net Sales 4900 5600 6300 7000 7000 7000 7000 7000 7000 7000 COST OF GOODS MANF. - Raw Material 0 0 0 0 0 0 0 0 0 0 - Catalyst - Wages & Salaries 0 0 0 0 0 0 0 0 0 0 - Utilities 989 1110 1231 1352 1352 1352 1352 1352 1352 1352 - Furnace /Vehicle Oil 0 0 0 0 0 0 0 0 0 0 - Stores & Spares 0 0 0 0 0 0 0 0 0 0 - Repair & Maintinance 0 0 0 0 0 0 0 0 0 0 - Packing Material 0 0 0 0 0 0 0 0 0 0 - Depreciation 52 52 52 52 52 52 52 52 52 52 - Manufacturing Overhead % 1 10 12 13 14 14 14 14 14 14 14 C. O. G Manufactured 1051.07 1173.46 1295.84 1418.23 1418.23 1418.23 1418.23 1418.23 1418.23 1418.23 Add: Opening Inventory 0 0 0 0 0 0 0 0 0 0 Total C.O.G. Manufactured 1051.07 1173.46 1295.84 1418.23 1418.23 1418.23 1418.23 1418.23 1418.23 1418.23 Less: Closing Inventory 0 0 0 0 0 0 0 0 0 0 Total Cost of Goods Sold 1051.07 1173.46 1295.84 1418.23 1418.23 1418.23 1418.23 1418.23 1418.23 1418.23 Gross Profit 3848.93 4426.54 5004.16 5581.77 5581.77 5581.77 5581.77 5581.77 5581.77 5581.77 OPERATING EXPENSES - Admin Salaries 2160 2236 2314 2395 2479 2565 2655 2748 2844 2944 - General Expenses 109 124 140 155 155 155 155 155 155 155 - Selling, Marketing Expense 51 58 66 73 73 73 73 73 73 73 Total Operating Expenses 2319.67 2418 2519 2623 2707 2794 2883 2976 3072 3172 Operating Profit 1529.26 2008 2485 2959 2875 2788 2698 2606 2509 2410 NON OPERATING EXPENSES Interest On Loans: - FCY Loan 0 0 0 0 0 0 0 0 0 0 - LMM Loan 0 0 0 0 0 0 0 0 0 0 - LCY loan 0 0 0 0 0 0 0 0 0 0 - Short Term Loan @ % 18 0 0 0 0 0 0 0 0 0 0 - Bridge Financing @ % 18 0 0 0 0 0 0 0 0 0 0 - Debenture 0 0 0 0 0 0 0 0 0 0 Total Interest 0 0 0 0 0 0 0 0 0 0 Profit Before W.P.F & Tax 1529.26 2008 2485.02 2958.84 2875.02 2788.27 2698.48 2605.54 2509.36 2409.81 W.P. Fund % of profit 10 153 201 249 296 288 279 270 261 251 241 Profit before Tax 1376 1808 2237 2663 2588 2509 2429 2345 2258 2169 Tax Provision @ % rate 45 619 813 1006 1198 1164 1129 1093 1055 1016 976 Net Profit after Tax 757 994 1230 1465 1423 1380 1336 1290 1242 1193 R. O. E % 10.63 13.96 17.27 20.57 19.98 19.38 18.76 18.11 17.44 16.75 R. O. I % 10.63 13.96 17.27 20.57 19.98 19.38 18.76 18.11 17.44 16.75
  • 15. Financial Analysis 3- . Table-5 PROJECTED CASH FLOW STATEMENT Rs. (000) Year 0 1 2 3 4 5 6 7 8 9 10 Capacity Utilization in %age DESCRIPTION 70 80 90 100 100 100 100 100 100 100 SOURCES OF FUNDS: - Operating Profit 1529 2008 2485 2959 2875 2788 2698 2606 2509 2410 - Depreciation 52 52 52 52 52 52 52 52 52 52 Total Operating Sources 0 1581 2060 2537 3011 2927 2840 2751 2658 2561 2462 - Equity/Stock 7121 0 - FCY Loan 0 - LMM Loan 0 - LCY Loan 0 - Bridge Financing 0 - Debenture 0 Decrease in C. Assets Increase in C. Liabilities 0 0 0 0 0 0 0 0 0 0 Other Incomes Total Sourses of Funds 7121 1581 2060 2537 3011 2927 2840 2751 2658 2561 2462 APPLICATION OF FUNDS Fixed Assets 4666 473 Debt Repayment - FCY 0 0 0 0 0 0 0 0 0 0 - LMM 0 0 0 0 0 0 0 0 0 0 - LCY 0 0 0 0 0 0 0 0 0 0 - Short Term Loan - Bridge Financing 0 - Debenture Interest Payments - FCY 0 0 0 0 0 0 0 0 0 0 - LMM 0 0 0 0 0 0 0 0 0 0 - LCY 0 0 0 0 0 0 0 0 0 0 - Short Term Loan 0 0 0 0 0 0 0 0 0 0 - Bridge Financing 0 0 0 0 0 0 0 0 0 0 - Debenture Tax 619 813 1006 1198 1164 1129 1093 1055 1016 976 W.P.F 153 201 249 296 288 279 270 261 251 241 Investments Increase in C. Assets 1090 -489 11 11 0 0 0 0 0 0 Decrease in C. Liabilities Others Total Appl. of funds 4666 1862 525 1266 1505 1452 1881 1363 1316 1267 1217 Cash Surplus/Defficit 2455 -281 1535 1271 1506 1475 959 1388 1342 1294 1245 Opening Cash 0 2455 2175 3710 4981 6486 7962 8921 10309 11650 12945 Closing Cash Balance 2455 2175 3710 4981 6486 7962 8921 10309 11650 12945 14189
  • 16. Financial Analysis 3- . Table-6(a) PROJECTED BALANCE SHEET Year 0 1 2 3 4 5 6 7 8 9 10 Capacity Utilization in %age DESCRIPTION 70 80 90 100 100 100 100 100 100 100 ASSETS: Current Assets: Cash 2455 2175 3710 4981 6486 7962 8921 10309 11650 12945 14189 Account Recievable 0 0 0 0 0 0 0 0 0 0 Inventories - Raw Material 0 0 0 0 0 0 0 0 0 0 - Work in Process 0 0 0 0 0 0 0 0 0 0 - Finished Goods 0 0 0 0 0 0 0 0 0 0 - Packing Material 0 0 0 0 0 0 0 0 0 0 Other Current assets 1090 601 612 623 623 623 623 623 623 623 Total Current Assets 3264 4311 5593 7109 8585 9544 10932 12273 13567 14812 Investments Intangible Fixed assets at Cost 4666 4666 4666 4666 4666 5139 5139 5139 5139 5139 Accum. Depreciation 52 104 156 208 260 312 364 416 468 520 Total Fixed Assets 4614 4562 4510 4458 4406 4827 4775 4723 4671 4619 Total Assets 7878 8873 10103 11567 12990 14371 15706 16996 18238 19431
  • 17. Financial Analysis 3- . Table-6(b) PROJECTED BALANCE SHEET Year 0 1 2 3 4 5 6 7 8 9 10 Capacity Utilization in %age DESCRIPTION 70 80 90 100 100 100 100 100 100 100 LIABILITIES & EQUITY: Current Liabilities Bank Borrowing 0 0 0 0 0 0 0 0 0 0 Account Payable 0 0 0 0 0 0 0 0 0 0 Dividend Payable W.P.F Payable Taxes Payable Others Total Current Liabilities 0 0 0 0 0 0 0 0 0 0 Deffereed Liabilities Long Term Debt - FCY 0 0 0 0 0 0 0 0 0 0 - LMM 0 0 0 0 0 0 0 0 0 0 - LCY 0 0 0 0 0 0 0 0 0 0 Total Long-term Liabilities 0 0 0 0 0 0 0 0 0 0 Total Liabilities 0 0 0 0 0 0 0 0 0 0 EQUITY: Capital 7121 7121 7121 7121 7121 7121 7121 7121 7121 7121 Bridge Finance 0 0 0 0 0 0 0 0 0 0 Retained Earning 757 1751 2981 4446 5869 7249 8585 9875 11117 12310 Total Equity 7878 8873 10103 11567 12990 14371 15706 16996 18238 19431 Total Captalization 7878 8873 10103 11567 12990 14371 15706 16996 18238 19431 Assets - Liabilities 0 0 0 0 0 0 0 0 0 0
  • 18. Financial Analysis 3- . Appendix-15 DEPRECIATION SCHEDULE Rs. (000) Year % Cost Contin- Total 1 2 3 4 5 6 7 8 DESCRIPTION Rate gencies Cost - Civil Engineering 0 0 0 0 0 0 0 0 0 0 0 0 - Plant & Mach.(at site) 207 21 228 - Errection & Install. 21 2 23 Total Plant & Mach. 0 228 23 250 0 0 0 0 0 0 0 0 - Motors & Vehicles 0 0 0 0 0 0 0 0 0 0 0 0 - Furniture & Fixture 10 473 47 520 52 52 52 52 52 52 52 52 Amortized Expenses - Preliminary Expenses 0 3464 346 3810 0 0 0 0 0 0 0 0 - Pre Production Exp. 0 77 8 85 0 0 0 0 0 0 0 0 - Intrest D. Con. FCY 0 0 0 0 0 0 0 0 0 0 0 LMM 0 0 0 0 0 0 0 0 0 0 0 LCY 0 0 0 0 0 0 0 0 0 0 0 T.Int. during Construct. 0 0 0 0 0 0 0 0 0 0 0 Total Amortized 0 3541 354 3895 0 0 0 0 0 0 0 0 Total Depreciation 4242 424 4666 52 52 52 52 52 52 52 52
  • 19. Financial Analysis 3- . Appendix-9 PROJECTED SALES Year Quantity 1 2 3 4 5 6 7 8 9 10 100% Capacity Utilization in %age DESCRIPTION % Rate 70 80 90 100 100 100 100 100 100 100 Export Sales - Product-1 Quantity 0 0 0 0 0 0 0 0 0 0 Value 0 0 0 0 0 0 0 0 0 0 Rebate/Duty Draw Back 0 0 0 0 0 0 0 0 0 0 0 - Product-2 Quantity 0 0 0 0 0 0 0 0 0 0 Value 0 0 0 0 0 0 0 0 0 0 Rebate/Duty Draw Back 0 0 0 0 0 0 0 0 0 0 0 - Product-3 Quantity 0 0 0 0 0 0 0 0 0 0 Value 0 0 0 0 0 0 0 0 0 0 Rebate/Duty Draw Back 0 0 0 0 0 0 0 0 0 0 0 - Product-4 Quantity 0 0 0 0 0 0 0 0 0 0 Value 0 0 0 0 0 0 0 0 0 0 Rebate/Duty Draw Back 0 0 0 0 0 0 0 0 0 0 0 Sub-total 0 0 0 0 0 0 0 0 0 0 Local Sales - Product-1 Quantity 20 14 16 18 20 20 20 20 20 20 20 Value 350 4900 5600 6300 7000 7000 7000 7000 7000 7000 7000 - Product-2 Quantity 0 0 0 0 0 0 0 0 0 0 Value 0 0 0 0 0 0 0 0 0 0 - Product-3 Quantity 0 0 0 0 0 0 0 0 0 0 Value 0 0 0 0 0 0 0 0 0 0 - Product-4 Quantity 0 0 0 0 0 0 0 0 0 0 Value 0 0 0 0 0 0 0 0 0 0 Sub-total 4900 5600 6300 7000 7000 7000 7000 7000 7000 7000 Total Sales 0 4900 5600 6300 7000 7000 7000 7000 7000 7000 7000 Opening Inventory(local) 0 0 0 0 0 0 0 0 0 0 Closing Inventory(local) 0 0 0 0 0 0 0 0 0 0 0 Net Sales 4900 5600 6300 7000 7000 7000 7000 7000 7000 7000 Note: 10 days inventory of local sale.
  • 20. Financial Analysis 3- . Appendix-10 PROJECTED RAWMATERIAL REQUIREMENT Year Quantity 1 2 3 4 5 6 7 8 9 10 100% Capacity Utilization in %age DESCRIPTION Rate 70 80 90 100 100 100 100 100 100 100 Imported Rawmaterial - Material-1 Quantity Value Duty/Charges - Material-2 Quantity Value Duty/Charges - Material-3 Quantity Value Duty/Charges - Material-4 Quantity Value Duty/Charges Sub-total 0 0 0 0 0 0 0 0 0 0 Local Rawmaterial - Cotton Quantity 0 0 0 0 0 0 0 0 0 0 0 Value 0 0 0 0 0 0 0 0 0 0 0 - Sil Quantity 0 0 0 0 0 0 0 0 0 0 0 Value 0 0 0 0 0 0 0 0 0 0 0 -Stoon Wash Quantity 0 0 0 0 0 0 0 0 0 0 0 Value 0 0 0 0 0 0 0 0 0 0 0 -Jorjad Quantity 0 0 0 0 0 0 0 0 0 0 0 Value 0 0 0 0 0 0 0 0 0 0 0 - Lilion&ShafonQuantity 0 0 0 0 0 0 0 0 0 0 0 Value 0 0 0 0 0 0 0 0 0 0 0 @ 10 % of all above 0 0 0 0 0 0 0 0 0 0 Sub-total 0 0 0 0 0 0 0 0 0 0 Total Rawmaterial 0 0 0 0 0 0 0 0 0 0 Opening Inventory(lmport) 0 0 0 0 0 0 0 0 0 0 Closing Inventory(lmport) 0 0 0 0 0 0 0 0 0 0 Opening Inventory(local) 0 0 0 0 0 0 0 0 0 0 Closing Inventory(local) 0 0 0 0 0 0 0 0 0 0 Net Rawmaterial 0 0 0 0 0 0 0 0 0 0 Note: 10 days inventory of finished goods.
  • 21. Financial Analysis 3- . Appendix-11 MANPOWER REQUIREMENT & COST THEREOFF Year Monthly 1 2 3 4 5 6 7 8 9 10 Salary Capacity Utilization in %age DESCRIPTION NOs. Rs. (000) 70 80 90 100 100 100 100 100 100 100 Factory: Plant Manager 0 0 0 0 0 0 0 0 0 0 0 0 Production Manager 0 0 0 0 0 0 0 0 0 0 0 0 Engineering Manager 0 0 0 0 0 0 0 0 0 0 0 0 Quality Control Mngr. 0 0 0 0 0 0 0 0 0 0 0 0 Assist. Managers 0 0 0 0 0 0 0 0 0 0 0 0 Machine operators 0 0 0 0 0 0 0 0 0 0 0 0 Sub-Engineer 0 0 0 0 0 0 0 0 0 0 0 0 Foremen 0 0 0 0 0 0 0 0 0 0 0 0 Operators/Drivers 0 0 0 0 0 0 0 0 0 0 0 0 Helpers 0 0 0 0 0 0 0 0 0 0 0 0 Peons 0 0 0 0 0 0 0 0 0 0 0 0 Seasonal Labour 0 0 0 0 0 0 0 0 0 0 0 0 Overheads % * 0 0 0 0 0 0 0 0 0 0 0 0 Sub Total 0 0 0 0 0 0 0 0 0 0 0 Admin./Sales: Chief Executive 0 0 0 0 0 0 0 0 0 0 0 0 General Manager 0 0 0 0 0 0 0 0 0 0 0 0 G.M. Marketing 0 0 0 0 0 0 0 0 0 0 0 0 Managers 2 20 480 497 514 532 551 570 590 611 632 654 Assist. Managers 2 12 288 298 309 319 330 342 354 366 379 393 Computor Operators 1 10 120 124 129 133 138 143 148 153 158 164 Clerks/Salesmen 2 8 192 199 206 213 220 228 236 244 253 262 Security Staff 0 0 0 0 0 0 0 0 0 0 0 0 Peons 0 0 0 0 0 0 0 0 0 0 0 0 Drivers 0 0 0 0 0 0 0 0 0 0 0 0 Sweepers 0 0 0 0 0 0 0 0 0 0 0 0 Seasonal Labour 0 0 0 0 0 0 0 0 0 0 0 Overheads * 8 4 1080 1118 1157 1197 1239 1283 1328 1374 1422 1472 Sub Total 7 2160 2236 2314 2395 2479 2565 2655 2748 2844 2944 Total Expenses 7 2160 2236 2314 2395 2479 2565 2655 2748 2844 2944 * Overheads 100 % are calculated on basic salary(Basic salary is 70 % of gross).
  • 22. Financial Analysis 3- . Appendix-12 UTILITIES Power/Elecricity: Connected Laod (Kw) = 90 Anual Fixed Charges (Connected Load x 130 x 12) = 140.4 Rs. (000) Anual Variable Charges (Connected Load x 6 x 8 x 1 x 220 x 0.85) = 1212 Rs. (000) Year 0 1 2 3 4 5 6 7 8 9 10 * Capacity Utilization in %age DESCRIPTION 6 month 70 80 90 100 100 100 100 100 100 100 Fixed Charges 70.2 140.4 140.4 140.4 140.4 140.4 140.4 140.4 140.4 140.4 140.4 Variable Charges 121.18 848.23 969 1091 1212 1212 1212 1212 1212 1212 1212 Total 191 988.63 1110 1231 1352 1352 1352 1352 1352 1352 1352 * Fixed cost taken for 6 months during construction & variable cost at 10 % of 100 % Production Level. FUEL Year 0 1 2 3 4 5 6 7 8 9 10 Months Capacity Utilization in %age DESCRIPTION 6 70 80 90 100 100 100 100 100 100 100 Fuel for steam Generation Fuel for Power Generation Fuel for Vehicles * 0 0 0 0 0 0 0 0 0 0 0 Total 0 0 0 0 0 0 0 0 0 0 0 STORES & SPARES, REPAIR & MAINTINANCE Year 1 2 3 4 5 6 7 8 9 10 %age Capacity Utilization in %age DESCRIPTION 70 80 90 100 100 100 100 100 100 100 Stores & Repairs 0 0 0 0 0 0 0 0 0 0 0 Repair & Maitinance 0 0 0 0 0 0 0 0 0 0 0 Total 0 0 0 0 0 0 0 0 0 0 * Stores & Spares are calculated at %age of installed machine cost and with anual increase of 0 % ** Repair & Maintinance are calculated at installed cost of Machinery and Building with anual increase of 0 %
  • 23. Financial Analysis 3- . Appendix-13 GENERAL & SELLING/MARKETING EXPENSES Year 1 2 3 4 5 6 7 8 9 10 Expenses Capacity Utilization in %age DESCRIPTION @ 100% 70 80 90 100 100 100 100 100 100 100 General Expenses - Telephone 5 4 4 5 5 5 5 5 5 5 5 - Fax 2 1 2 2 2 2 2 2 2 2 2 - Postage 1 1 1 1 1 1 1 1 1 1 1 - Stationary 10 7 8 9 10 10 10 10 10 10 10 - Travelling 8 6 6 7 8 8 8 8 8 8 8 - Legal Expenses 2 1 2 2 2 2 2 2 2 2 2 - Entertainment 15 11 12 14 15 15 15 15 15 15 15 - Rents 100 70 80 90 100 100 100 100 100 100 100 - Others 12 8 10 11 12 12 12 12 12 12 12 Sub total 109 124 140 155 155 155 155 155 155 155 Selling Expenses - Advertising % of sale 0.13 6 7 8 9 9 9 9 9 9 9 - Commision % 0.1 5 6 6 7 7 7 7 7 7 7 - Discounts % of sales 0.1 5 6 6 7 7 7 7 7 7 7 - Paking Material 0 0 0 0 0 0 0 0 0 0 0 - Others 50 35 40 45 50 50 50 50 50 50 50 Sub total 51 58 66 73 73 73 73 73 73 73 Total 160 182 205 228 228 228 228 228 228 228.1
  • 24. Financial Analysis 3- . Appendix-14 Working Capital Requirement Year 1 2 3 4 5 6 7 8 9 10 Period Capacity Utilization in %age DESCRIPTION (Days) 70 80 90 100 100 100 100 100 100 100 CURRENT ASSETS: Raw material imported 0 0 0 0 0 0 0 0 0 0 0 Raw material Local 0 0 0 0 0 0 0 0 0 0 0 Work in Process 0 0 0 0 0 0 0 0 0 0 Packing Material 0 0 0 0 0 0 0 0 0 0 0 Labour 0 0 0 0 0 0 0 0 0 0 0 Utilities 30 90 101 112 123 123 123 123 123 123 123 Factory Overheads 0 0 0 0 0 0 0 0 0 0 0 Selling & Admin. Expenses 0 0 0 0 0 0 0 0 0 0 0 Finished Goods Inventory 0 0 0 0 0 0 0 0 0 0 0 Accounts Recievable 0 0 0 0 0 0 0 0 0 0 0 Advances & Deposits 500 0 0 0 0 0 0 0 0 0 Cash 500 500 500 500 500 500 500 500 500 500 Sub Total 1090 601 612 623 623 623 623 623 623 623 CURRENT LIABILITIES: Accounts Payable 30 0 0 0 0 0 0 0 0 0 0 Short Term Borrowing 60 0 0 0 0 0 0 0 0 0 0 @ % of stocks Sub Total 0 0 0 0 0 0 0 0 0 0 Net Initial Working Capital 1090 601 612 623 623 623 623 623 623 623
  • 25. Financial Analysis 3- . Appendix-16 LOAN REPAYMENT SCHEDULE Loan Type : Foreign Currency Total Loan Amount: 0 0 e33 Rate of Interest : 18 % 18 Repayment Period: 3.5 Year A. F = 27.66 9 Grace Period : 0.5 Year 1 Per Year Installments : 12 (half yearly) 2 Total Installments : 36 Installment Amount : 0 (including intrest during construction for half year) Total Amount to be Paid 0 Total Mark-up Amount 0 Rs. (000) Due Date Principal Paid Instal. of Balance Mark-up Installment Yearly Int. D. Cons Interest 1 0 0 0 0 0 0 2 0 0 0 0 0 0 0 3 0 0 0 0 0 0 4 0 0 0 0 0 0 0 5 0 0 0 0 0 0 6 0 0 0 0 0 0 0 7 0 0 0 0 0 0 8 0 0 0 0 0 0 0 9 0 0 0 0 0 0 10 0 0 0 0 0 0 0 11 0 0 0 0 0 0 12 0 0 0 0 0 0 0 13 0 0 0 0 0 0 14 0 0 0 0 0 0 0 15 0 0 0 0 0 0 16 0 0 0 0 0 0 0 17 18 19 20
  • 26. Financial Analysis 3- . Appendix-17 LOAN REPAYMENT SCHEDULE Loan Type : LMM Total Loan Amount: 0 Rate of Interest : 8% Repayment Period: 9 Year A. F = 11.65 Grace Period : 1 Year Per Year Installments : 2 (half yearly) Total Installments : 16 Installment Amount : 0 (including intrest during construction for half year) Total Amount to be Paid 0 Total Mark-up Amount 0 Rs. (000) Due Date Principal Paid Instal. of Balance Mark-up Installment Yearly Int. D. Cons Interest 1 0 0 0 0 0 0 2 0 0 0 0 0 0 0 3 0 0 0 0 0 0 4 0 0 0 0 0 0 0 5 0 0 0 0 0 0 6 0 0 0 0 0 0 0 7 0 0 0 0 0 0 8 0 0 0 0 0 0 0 9 0 0 0 0 0 0 10 0 0 0 0 0 0 0 11 0 0 0 0 0 0 12 0 0 0 0 0 0 0 13 0 0 0 0 0 0 14 0 0 0 0 0 0 0 15 0 0 0 0 0 0 16 0 0 0 0 0 0 0 17 18 19 20
  • 27. Financial Analysis 3- . Appendix-18 LOAN REPAYMENT SCHEDULE Loan Type : LCY Loan Total Loan Amount: 0 Rate of Interest : 8% Repayment Period: 9 Year A. F = 11.65 Grace Period : 1 Year Per Year Installments : 2 (half yearly) Total Installments : 16 Installment Amount : 0 (including intrest during construction for half year) Total Amount to be Paid 0 Total Mark-up Amount 0 Rs. (000) Due Date Principal Paid Instal. of Balance Mark-up Installment Yearly Int. D. Cons Interest 1 0 0 0 0 0 0 2 0 0 0 0 0 0 0 3 0 0 0 0 0 0 4 0 0 0 0 0 0 0 5 0 0 0 0 0 0 6 0 0 0 0 0 0 0 7 0 0 0 0 0 0 8 0 0 0 0 0 0 0 9 0 0 0 0 0 0 10 0 0 0 0 0 0 0 11 0 0 0 0 0 0 12 0 0 0 0 0 0 0 13 0 0 0 0 0 0 14 0 0 0 0 0 0 0 15 0 0 0 0 0 0 16 0 0 0 0 0 0 0 17 18 19 20
  • 28. Financial Analysis 3- . Appendix-19 LOAN REPAYMENT SCHEDULE Loan Type : Total Loan Amount: 0 Rate of Interest : 4% Repayment Period: 8 Year A. F = 0 Grace Period : 1 Year Per Year Installments : 2 (half yearly) Total Installments : 0 Installment Amount : 0 (including intrest during construction for half year) Total Amount to be Paid 0 Total Mark-up Amount 0 Rs. (000) Due Date Principal Paid Instal. of Balance Mark-up Installment Yearly Int. D. Cons Interest 1 2 3 4 5 6 7 8 9 10 11 12 13 14 15 16 17 18 19 20
  • 29. Financial Analysis 3- . Table- 9 INTERNAL FINANCIAL RATE OF RETURN YEAR CAPITAL OPER. DEPREC- TAXES W.P.F NET CASH Discouted value OUTLAY PROFIT ATION FLOW @ % age 175 190 0 7121 -7121 -7121 -7121 1 1529 52 619 153 809 294 279 2 2008 52 813 201 1046 138 124 3 2485 52 1006 249 1282 62 53 4 2959 52 1198 296 1517 27 21 5 2875 52 1164 288 1475 9 7 6 2788 52 1129 279 1432 3 2 7 2698 52 1093 270 1388 1 1 8 2606 52 1055 261 1342 0 0 9 2509 52 1016 251 1294 0 0 10 2410 52 976 241 1245 0 0 S. Value 570 570 0 0 11 -6586.23 -6633.22 I.F.R.R = -1927.279 %
  • 30. Financial Analysis 3- . Appendix-20 BENEFIT-COST RATIO * Discounted @ Opp. cost rate % 17 YEAR Project/Production Sales/ Net Discoun- Discoun- Discoun- Discounted value of Cost Benefits Cash ted Cost ted ted Net Discounted net cash flow Flow Benefits Cash Flow @ % age 20 21 0 7121 0 -7121 #N/A #N/A #N/A #N/A #N/A 1 3319 4900 1581 #N/A #N/A #N/A #N/A #N/A 2 3540 5600 2060 #N/A #N/A #N/A #N/A #N/A 3 3763 6300 2537 #N/A #N/A #N/A #N/A #N/A 4 3989 7000 3011 #N/A #N/A #N/A #N/A #N/A 5 4073 7000 2927 #N/A #N/A #N/A #N/A #N/A 6 4160 7000 2840 #N/A #N/A #N/A #N/A #N/A 7 4249 7000 2751 #N/A #N/A #N/A #N/A #N/A 8 4342 7000 2658 #N/A #N/A #N/A #N/A #N/A 9 4439 7000 2561 #N/A #N/A #N/A #N/A #N/A 10 4538 7000 2462 #N/A #N/A #N/A #N/A #N/A #N/A #N/A #N/A #N/A #N/A BENEFIT COST RATIO = #N/A I.F.R.R. = #N/A %
  • 31. Financial Analysis 3- . Table-8 PAYBACK PERIOD YEAR CAPITAL OPER. DEPREC- TAXES W.P.F NET CASH Payback Balance OUTLAY PROFIT ATION FLOW Years Net Cash Flow 0 7121 -7121 1 1529 52 619 153 809 1.000 -6312 2 2008 52 813 201 1046 1.000 -5266 3 2485 52 1006 249 1282 1.000 -3984 4 2959 52 1198 296 1517 1.000 -2467 5 2875 52 1164 288 1475 1.000 -992 6 2788 52 1129 279 1432 0.693 0 7 2698 52 1093 270 1388 0.000 0 8 2606 52 1055 261 1342 0.000 0 9 2509 52 1016 251 1294 0.000 0 10 2410 52 976 241 1245 0.000 0 S. Value 570 570 Payback Period = 5.693 Years >10
  • 32. Financial Analysis 3- . Appendix-21 BENEFIT-COST RATIO * Discounted @ Inflation rate % 10 YEAR Project/Production Sales/ Net Discoun- Discoun- Discoun- Discounted value of Cost Benefits Cash ted Cost ted ted Net Discounted net cash flow Flow Benefits Cash Flow @ % age 20 21 0 7121 0 -7121 #N/A #N/A #N/A #N/A #N/A 1 3319 4900 1581 #N/A #N/A #N/A #N/A #N/A 2 3540 5600 2060 #N/A #N/A #N/A #N/A #N/A 3 3763 6300 2537 #N/A #N/A #N/A #N/A #N/A 4 3989 7000 3011 #N/A #N/A #N/A #N/A #N/A 5 4073 7000 2927 #N/A #N/A #N/A #N/A #N/A 6 4160 7000 2840 #N/A #N/A #N/A #N/A #N/A 7 4249 7000 2751 #N/A #N/A #N/A #N/A #N/A 8 4342 7000 2658 #N/A #N/A #N/A #N/A #N/A 9 4439 7000 2561 #N/A #N/A #N/A #N/A #N/A 10 4538 7000 2462 #N/A #N/A #N/A #N/A #N/A #N/A #N/A #N/A #N/A #N/A BENEFIT COST RATIO = #N/A I.F.R.R. = #N/A %
  • 33. Financial Analysis 3- . Table-7 BREAKE-EVEN ANALYSIS @ 100 % Production Capacity Fixed Variable Total DESCRIPTION Cost Cost Cost - Raw Material 0 0 - Catalyst 0 0 - Wages & Salaries 0 0 - Utilities 140.4 1212 1352 - Furnace /Vehicle Oil 0 0 - Stores & Spares 0 0 0 - Repair & Maintinance 0 0 0 - Packing Material 0 0 - Depreciation 52 52 - Manufacturing Overhead 10 4 14 - Admin Salaries 2479 2479 - General Expenses 62 93 155 - Selling, Marketing Expense 4 69 73 Interest On Loans: - FCY Loan 0 0 - LMM Loan 0 0 - LCY loan 0 0 - Short Term Loan 0 0 - Bridge Financing 0 0 - Debenture 0 0 W.P. Fund 288 288 Tax Provision 1164 1164 Total 4198 1378 5577 Sales = 7000 Variable Cost = 1378 Contrib. Margin = 5622 Breake-even Point (% age of Capacity Utilization) = 74.7 %