BNamericas Project Risk Analytics - June 2015 Inaugural report
1. 1
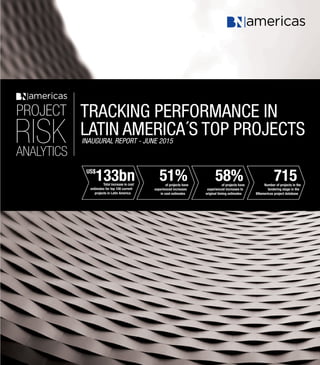
Project Risk Analytics: Tracking performance in Latin America’s top projects
US$
133bn 51% 58% 715Total increase in cost
estimates for top 100 current
projects in Latin America
of projects have
experienced increases to
original timing estimates
Number of projects in the
tendering stage in the
BNamericas project database
of projects have
experienced increases
in cost estimates
TRACKING PERFORMANCE IN
LATIN AMERICA´S TOP PROJECTSinaugural REPORT - JUNE 2015
PROJECT
RISKANALYTICS
2. 2
Project Risk Analytics: Tracking performance in Latin America’s top projects
BNAMERICAS PROJECT RISK ANALYTICS
Tracking performance in Latin America’s top projects
BNamericas Project Risk Analytics tracks changes to estimates of completion dates and overall costs in Latin
American projects during their implementation phase.
The information herein is designed to be used by governments, insurers, reinsurers, project financiers, risk officers,
asset managers and advisers, to analyze upcoming risk to schedules and financing costs, and track the progress of
existing projects.
By providing a top-down analysis of the timeliness and costs of current Latin American projects, BNamericas
provides a new tool to the industry allowing it to learn from past events and improve planning for future projects.
SUBSCRIBE TODAY
PROJECT RISK ANALYTICS
Natan Levy
Head of Project Risk Analytics
nlevy@BNamericas.com
+56 (2) 2941-0386
Arvinder Ludhiarich
Commercial Director
aludhiarich@BNamericas.com
+56 (2) 2941-0300
3. 3
Project Risk Analytics: Tracking performance in Latin America’s top projects
CONTENT
FOREWORD...............................................................................4
SUMMARY.................................................................................5
RESULTS & DISCUSSION.............................................................7
INTRODUCING THE MATURITY PROFILE.................................................8
FACTORS RESPONSIBLE FOR COST OVERRUNS....................................10
CONCLUSIONS..........................................................................12
APPENDIX I - SECTOR AVERAGES..........................................................................................14
APPENDIX II - THE BNAMERICAS PROJECT DATABASE PIPELINE................................................15
METHODOLOGY & PROCEDURES..........................................................................................17
4. 4
Project Risk Analytics: Tracking performance in Latin America’s top projects
This inaugural report by the BNamericas Project Risk
Analytics team marks the beginning of a new approach
undertaken by BNamericas to enhance the information
on project performance in Latin America.
In collating the data, BNamericas aims to track the
progress of the largest Latin American projects - in
electric power, mining, oil & gas (excluding upstream)
and petrochemical - from the start of construction to
final completion, highlighting changes to estimates for
project completion and costs throughout the execution/
implementation phase of a project.
Just as fiscal discipline at the start of the 21st century
encouraged investment aimed at closing the significant
gap in infrastructure investment in the region, the
current economic and fiscal deterioration in the region,
the withdrawal of quantitative easing in the USA and
the hit to investor confidence brought about by cases
of corruption in Brazil, threaten to put a dent in the long
term plans for investment in the region’s infrastructure.
As previously noted by various public bodies, most
notably the OECD, high financing costs due to weak
fiscal sustainability have contributed significantly in the
past to low levels of infrastructure investment in many
parts of Latin America. Should yields rise and financing
become scarcer, the past may well inform future
expectations once again.
In the midst of the unveiling of what is potentially the
largest ever corruption scandal in Brazil, in Latin
America and possibly in the world, the BNamericas
FOREWORD
Project Risk Analytics initiative aims to shed a light on
some of the darkest corners of project management in
the region and improve the level of information available,
thereby enabling benchmarking to take place for public
bodies, financiers, insurers, contractors and other
interested parties.
While there have been a limited number of studies into
delays and cost overruns of projects around the world,
they have tended to be carried out on a global basis using
historic data.
This initiative, targeted solely at Latin America, aims to track
performance until completion - starting with the largest 100
projects - thereby introducing a time dimension to the data.
As the months and years progress, the growth in the data
is designed to lead to a continuous evolution and thus to
greater accuracy around the probability and magnitude of
estimates along the life of a project.
5. 5
Project Risk Analytics: Tracking performance in Latin America’s top projects
The first study by BNamericas’ Project Risk Analytics
covers the 100 largest private and state-owned projects in
Latin America (as defined by investment size), during their
implementation phase, that were initially estimated to cost
US$242bn.
The results, when updated for current estimates up to the
end of March, indicate that the largest 100 projects have
exceeded their original cost estimates by over US$133bn
to reach a total of US$375bn, with delays occurring on
close to 60% of projects.
When considering the global picture and comparing to a
global sample through collaboration with academics at the
University of Oxford’s Saïd Business School, the research
has established that while a typical project performs in
line with the global sample, the tail of the distribution in
Latin America is much fatter; implying that very large cost
and or schedule overruns are more pronounced, thereby
SUMMARY
translating to a higher risk for Latin American projects.
This chimes with previous research by the OECD1
which
found that contract renegotiations for PPPs in Latin
America have been larger and more frequent than what
theory and international experience suggest.
The data however, suggests that the brunt of the delays
experienced and of the increases in cost estimates have
been concentrated on the largest and most complex of
the projects in the region and in particular on refineries and
large hydroelectric projects, lending weight to previous
research associating the complexity and scale of a project
with greater cost overruns.
Notably, the results suggest that - as Bent Flyvbjerg et al2
found with overwhelming statistical significance - when
looking at transportation infrastructure projects globally
- cost estimates used to decide whether such projects
should be built are “highly and systematically misleading,”
and should not be trusted.
With that in mind and given the current developments in
the region, and in Brazil in particular, the results are placed
in greater focus given early evidence suggesting that the
resultant hit to confidence has led to a significant drop in
project finance volumes in the first quarter of 2015, thereby
raising questions over the ongoing push to increase
spending on infrastructure projects in the region.
Finally, the results call into question the traditional concept
of the Cone of Uncertainty whereby uncertainty around
project costs is expected to diminish in line with the
advance of a project from the drawing board, through to
implementation.
Changes from original estimates
Latest estimates
of increase
22
Original project
duration
52
Latest estimates
of Increase
133
Original project
cost
242
70
80
60
50
20
40
10
30
0
350
400
300
250
100
200
50
150
0
Timing (average, months)
Timing
US$bn
Total Costs US$bn
1
Bitran, E., S. Nieto-Parra y J.S. Robledo (2013), “Opening the black box of contract renegotiations: An analysis of road concessions in Chile, Colombia and
Peru”, OECD Development Centre Working Papers, No. 317, OECD Publishing, Paris.
2
Flyvbjerg, B., Holm, M. K. S., & Buhl, S. L. (2002). Cost underestimation in public works projects: Error or lie? Journal of the American
Planning Association, 68(3), 279-295.
6. 6
Project Risk Analytics: Tracking performance in Latin America’s top projects
Introduction to methodology
The methodology used in the research is described
at the back of the report. It has followed a consistent
approach, using the latest available estimates from public
sources and from discussions with companies. Initial
cost estimates are defined as budgeted or forecasted
costs at the time of the decision to build, in line with the
international standard for measuring the inaccuracy of
cost estimates as noted by Flyvbjerg et al, in the case of
private projects.
For state-owned projects, initial costs are taken from the
contracts or news of contracts signed with winning bidders
following tender processes. All costs are calculated in the
individual project’s reported currency and converted to US
dollars as at the date of announcement. Due to a reliance
on publically available official information the study, by
design portrays a conservative bias in its measurements.
7. 7
Project Risk Analytics: Tracking performance in Latin America’s top projects
March Results-Top 100 projects
• On aggregate current cost estimates for the top 100
projects in the region amounted to US$375bn as of March
2015, representing an increase of US$133bn to original
estimates.
• 58% of projects registered an increase from their original
estimate for completion (delay), with 39% on time and 3
projects running ahead of schedule.
• 51% of projects showed an increase from their original
cost estimate, with 43% of projects running in line with
their original budget estimates and 6 projects running
below initial estimates in US dollars.
Severity of changes to timing estimates
• The average length of delay for the top 100 is 21.8
months or 45,3% greater than initially estimated.The
median length of delay in contrast is just 6.5 months or
15.5% greater than originally estimated.
• Of the 58 delayed projects, 28 are experiencing major
changes of over 60% from the original estimates.
• 19 of the 58 projects are showing medium increases of
20% to 60% from original estimates and 11 projects are
showing minor increases of between 5% and 20% from
original estimates.
Severity of changes to cost estimates
• The average increase in cost estimates for the top 100
is 64.0% of the initial estimates.The median increase in
cost estimates in contrast is 10.1% of the initial esti-
mates.
• Of the 51 projects with an increase in cost estimates,
31 projects are experiencing major changes of over 40%
from original estimates.
• 17 of the 51 projects are experiencing medium cost
increases of 20% to 40% and 3 project are experiencing
minor increases of 5% to 20% from original estimates.
Number of projects delayed and over budget
70
60
50
40
20
3
6
43
51
39
58
30
10
0
Delayed On Time Ahead of
Schedule
Over budget To Budget Ahead of
Budget
Average delays and cost overruns
Average delay Average cost
overrun
Median delay Median cost
overrun
70%
30%
50%
10%
60%
20%
40%
0%
45.3%
15.5%
64.0%
10.1%
8. 8
Project Risk Analytics: Tracking performance in Latin America’s top projects
Correlation
• A deeper look at the data illustrates a close relationship
between changes in costs and changes in timing
estimates with their correlation coefficient standing at
0.68, with statistical significance to p<0.001.
• Further, what stands out clearly is the incidence of a
number of projects that have only recently entered their
implementation phase, and have thus not yet recorded an
increase in cost or timing estimates.
• As a consequence, it can be argued that the sample
exhibits statistical outliers that begin from a lower level
than would be expected of a sample of completed
projects, thereby calling for a consideration of the maturity
profile of the sample.
Maturity profile
• Measured by the current average advance of projects as
a percentage of the average initial duration expected – the
overall maturity of the sample stood at 71% at the end of
March 2015.
• The maturity of those projects which have experienced
increases to their timing estimates meanwhile stood at
79%, compared to 55% for those projects which were
estimated to finish on time.
• In the same way, when looking at those projects which
experienced increases to their cost schedules, the
maturity of the sample stood at 79%, compared to 58%
for projects which experienced no increase in estimates.
• The results thereby illustrate that projects which are
further advanced have experienced a change to
estimates.
Changes from original estimates - Scatter
750%
350%
550%
150%
-50%
650%
250%
450%
50%
50%-50%ChangestoCostSchedule
Changes to Timing Schedule
250% 350% 450%
Overall
project
maturity
On time
Delayed
On budget
Over budget
0% 10% 20% 30% 40% 50% 60% 70% 80% 90%
Effect of Project Maturity on changes to estimates
150%
9. 9
Project Risk Analytics: Tracking performance in Latin America’s top projects
Cone of uncertainty
• Readers will be familiar with the Cone of Uncertainty (a
term first used for software projects), which introduced
the idea that the uncertainty around project cost
estimates decreases as projects advance towards their
implementation.
• The Project Management Institute, in its Body of
Knowledge guide notes that “the accuracy of a project
estimate will increase as the project progresses through
the project life cycle”, where, “Later in the project, as
more information is known, definitive estimates could
narrow the range of accuracy to -5% to +10%.”
• The results suggest that such a theory which considers
the potential of estimate changes to diminish as a
project moves towards execution may not apply to the
current sample, possibly due to the influence of mega
projects in the sample which differ in size and complexity
to the average project.
Building a timeline for cost overruns
• Indeed the data in this study calls into question the
validity of such a theory given the large cost increases
experienced during the implementation period. Notably,
it shows that during a project’s implementation phase,
uncertainty is confined almost exclusively to cost
increases.
• By introducing a third dimension, that of the sample’s
duration (or project maturity), the research aims to
map the predicted path of cost overruns over the
implementation phase and through to completion.
• As further data is added over time, the accuracy of the
results will increase and allow for improved prediction of
the timing and scale of cost increases.
+20
-20
+15
-15
+10
-10
+5
-5
Estimate
at final
design
Estimate
at start of
construction
Estimate at
conceptual
design
Marginoferror
Cost uncertainty along the lifetime of a project
800%
700%
600%
500%
400%
200%
300%
100%
-100%
0%
20% 40% 60% 80% 100% 120% 140% 160% 180% 200%0%
Costchanges
Maturity
Project maturity to changes in costs
10. 10
Project Risk Analytics: Tracking performance in Latin America’s top projects
Qualitative analysis - factors causing cost overruns
The analysis used follows the methodology introduced by
a paper in the Research Journal of Applied Sciences,
Engineering and Technology in 20133
.
An analysis of the main factors cited by company contacts,
public bodies and press reports for increases in timing and
cost
estimates on the affected projects uncovered the main
factors to be as follows:
• Of the 100 projects in the sample, the analysis
established sufficient information for 44 of the 51
projects that have exceeded their costs estimates,
where one or more factors were cited for their
contributions to cost increases.
• Financial management was the most-often-cited factor
for cost increases in 23 of the projects and included
cases where cost inflation and failures in budgeting were
cited as the causes as well as those which experienced
difficulties in receiving timely funding.
• Design factors were cited on 15 occasions as having
led to an increase in costs and involved cases of
changes in scope and redesign throughout the
implementation phase.
• Labor factors were the third most common reason
cited for cost increases on 14 occasions and included
labor disputes resulting in strikes as well as difficulties in
finding skilled staff.
• External factors, including changes in commodity prices,
in ownership and political decisions which impacted
costs, were cited in 10 cases as having contributed to
cost increases.
• Project management failures were cited in eight cases
while environmental and community factors were the
least cited reasons for cost increases in the sample.
3
Ade Asmi Abdul Azis,AftabHameedMemon, Ismail Abdul Rahman and Ahmad TarmiziAbd.Karim. (2013) Controlling Cost Overrun Factors in
Construction Projects in Malaysia.Research Journal of Applied Sciences, Engineering and Technology 5(8): 2621-2629.
Factors responsible for cost overruns
Financial Management 23
Design 15
Labor 14
External 10
Project Management 8
Environmental 7
Social & Community 4
11. 11
Project Risk Analytics: Tracking performance in Latin America’s top projects
Further observations
The research undertaken by BNamericas’ Project Risk
Analytics team has come up against the obvious obstacle
of lack of transparency. This has been brought on, not
only by a systemic lack of information but also by the lack
of cooperation when it came to more politically sensitive
projects such as those forming part of Brazil’s plans for the
Olympics.
While the incentives for keeping the information out of the
public eye are understandable if an interested party has
something to lose, they are not justifiable. As the data
shows, bringing the information into the open is clearly
in the public interest and should lead to better future
estimates and greater scrutiny on returns and on project
and bidder selection.
Researchers also came across a myriad of regulatory
agencies, authorities, bidding procedures and monitoring
standards, at times within one state in one country
and even on single roads where different phases
were tendered by different bodies. When multiplied by
the number of states and countries in the region, the
overriding observation is one of inconsistency in applying
best practices across the region.
The result has at times been utter chaos, where projects
involving several government agencies have resulted in
complete paralysis and failure over a number of years to
even tender a contract. When such a situation relates to a
project for the Olympics, due to be completed in less than
a year’s time, the outcome can only be greater uncertainty.
Of all the projects however, Comperj, a refinery complex in
the state of Rio de Janeiro deserves its own section and
perhaps even a book. With the federal auditors estimating
costs for the entire project to reach US$48bn, this project
is not only the biggest outlier in the data sample but is
also greater in value than the 2013 GDP of over 100
countries in the world. Compared to the initial estimated
cost of US$6.5bn in 2006, this project has experienced
an increase of 634% in its estimated cost.
Having been scheduled at the outset to be completed
within a period of 5.5 years, the latest estimate suggests
the project will not be finished before May 2021, nearly
10 years longer than planned, raising questions as to
its viability in its current form. With the owner, Petrobras,
keeping silent while under investigation by the Securities
and Exchange Commission (SEC) in the US over its
disclosure to shareholders, the project is the best
advertisement for the need for improved disclosure in the
region.
12. 12
Project Risk Analytics: Tracking performance in Latin America’s top projects
When considering that Latin America’s annual infrastructure
spending is required to reach US$250bn - from current
spending of US$150bn according to the IADB - in order
to close the investment gap which has been talked about
so often over the years, it becomes clear that greater and
better information is required by all parties to gain an
understanding of the returns, value for money and track
record of investments in the region.
The results from the largest 100 projects representing an
estimated US$375bn support the conclusion that costs
in Latin American projects are not only expanding during
the implementation phase but crucially - from collaboration
with the University of Oxford’s Said School of Business - it
is clear that the tail of the distribution is fatter than the
global benchmark, thus translating into higher risk for the
sample used in this study.
In their seminal work on cost escalation in transportation
infrastructure projects globally, Bent Flyvbjerg et al, found
with overwhelming statistical significance - when looking at
the cost estimates used to decide whether such projects
should be built - that they are “highly and systematically
misleading,” ruling out error and pointing the finger squarely
at dishonesty.
Other studies56789
have been just as clear that project
forecasts are underestimated and benefits exaggerated by
project promoters in order to make projects saleable.
The results of this study on Latin American projects across
a range of industries from infrastructure, to electric power,
to mining, oil & gas (excluding upstream) and petrochemical
projects, while not ascribing blame, support the conclusion
of Flyvbjerg et al, by virtue of their magnitude, that interested
parties “should not trust cost estimates and cost-benefit
CONCLUSIONS
analyses produced by project promoters and their analysts.”
The data also suggests that rather than decreasing as a
project enters its implementation phase, uncertainty around
cost estimates in fact rises, but only when it comes to cost
increases. Decreases in cost estimates seem almost non-
existent.
That financial, labor and design factors were the most
commonly cited factors for cost increases by project
sponsors and contractors, highlights the rise in cost
inflation in the region in recent years which has been
talked about so often, and the impact of labor disputes
which continue to hamper the execution of projects as
they squeeze returns. When combined with a shortage
of skilled manpower and design failures, the challenges
become clear.
If countries in the region are serious about increasing
infrastructure spending as a percentage of their GDP, many
other aspects will need to be addressed, from education,
to workers’ rights, to tackling design issues and clearing up
funding and investment bottlenecks.
This inaugural report sets out the basis for future analysis
by the Project Risk Analytics team at BNamericas,
enabling interested parties to track changes to estimates
of completion dates and overall costs in Latin American
projects during their implementation phase, with a greater
understanding of their future path.
4
Flyvbjerg, B., Holm, M. K. S., & Buhl, S. L. (2002). Cost underestimation in public works projects: Error or lie? Journal of the American Planning Association, 68(3), 279-295.
5
Wachs, M. (1989). “When planners lie with numbers,” Journal of the American Planning Association, 55(4), 476–479
6
Kain, J. F. (1990), “Deception in Dallas: Strategic misrepresentation in rail transit promotion and evaluation”, Journal of the American Planning Association, 56(2), 184–196
7
Pickrell, D. H. (1990) Urban rail transit projects: Forecast versus actual ridership and cost. Washington, DC: U.S. Department of Transportation.
8
Morris, P. W. G., & Hough, G. H. (1987). The anatomy of major projects:A study of the reality of project management. New York: John Wiley and Sons.
9
Morris, Sebastian (1990), “Cost and Time Overruns in Public Sector Projects”, Economic and Political Weekly, Vol. XXV, No.47, pp.M-154-M-168.
13. 13
Project Risk Analytics: Tracking performance in Latin America’s top projects
The next steps
The next report in September 2015, which will include
the results of at least 200 projects where construction is
on-going, will be key to the progress of the analysis. With
the largest projects in the region now covered, moving to
the next tier could provide further evidence as to whether
the most severe increases in costs are associated with the
largest and most complex projects.
By the time of the December report, the sample should
grow to cover the vast majority of suitable projects in the
region, thus allowing for more results to be broken down
further, by sector and by type of project.
The introduction of the maturity profile of the sample will also
help to determine whether the cone of uncertainty theorem
is indeed debunked as greater data is added, allowing the
tracking of delays along the life span of a project’s execution.
Crucially, the research has been dependent on the
cooperation of public bodies and private companies and
in particular, in cases where information has not been as
readily available - for a myriad of reasons - time and great-
er cooperation will lead to greater precision in the results.
14. 14
Project Risk Analytics: Tracking performance in Latin America’s top projects
APPENDIX I - SECTOR AVERAGES
140%
100%
120%
80%
60%
40%
20%
0%
50
45
40
35
30
25
20
15
10
5
Breakdown of results
0
Number of projects Average delay Average cost
overrun
Total over
budget US$bn
Electric Power 18 62% 87% 26.9
Mining 18 37% 74% 25.1
Oil & Gas 16 55% 41% 21.5
Infrastructure 30 36% 51% 11.4
Water & Waste 11 44% 36% 3.6
Petrochem 7 37% 115% 44.4
Grand Total 100 45% 63% 132.9
Petrochem Mining Oil & Gas Infrastructure
Electric
Power
Water
& Waste
Total overbudget US$bn 44.4 26.9 25.1 21.5 11.4 3.6
Average delay 37% 62% 37% 55% 36% 44%
Average cost overrun 115% 87% 74% 41% 51% 36%
15. 15
Project Risk Analytics: Tracking performance in Latin America’s top projects
BNamericas’ entire database of over 2800 projects in-
cludes projects from their initial early works through to
construction and completion.
By comparing the number of projects in construction and in
the tendering stage across sectors a more accurate picture
can be obtained of the project pipeline for the region.
APPENDIX II - BNAMERICAS´ PROJECT PIPELINE
Sector breakdown
300
0
88
281
197
58
166
77
168
160
57 60
Energy MiningInfra O&GWater
400
100
500
200
PipelineConstruction
800
400
600
200
700
300
500
100
0
PipelineConstruction
Number of projects by stage
522
Tender/
inv.decision
488
EIA
302
• Of the 2800, 522 are currently In construction while 488
projects are in the process of being tendered and 302
are undergoing an environmental impact assessment
(EIA).
• The pipeline which includes both projects under tender
and those undergoing an EIA can be seen to include the
greatest number of projects in the energy and infrastruc-
ture sector.
• A breakdown of the figures is included overleaf.
Number of projects by stage
Construction 522
Tender/ Investment decision 488
EIA 302
Total 1,312
16. 16
Project Risk Analytics: Tracking performance in Latin America’s top projects
Sector Country In construction Pipeline
Energy
Argentina 7 11
Brazil 37 9
Chile 31 164
Colombia 8 8
Mexico 19 20
Peru 9 30
Infra
Argentina 8 10
Brazil 36 50
Chile 15 29
Colombia 18 29
Mexico 21 15
Peru 14 17
Oil & Gas
Argentina 4 1
Brazil 11 3
Chile 1 4
Colombia 3 94
Mexico 11 21
Peru 4 22
Water
Argentina 8 9
Brazil 6 26
Chile 7 9
Colombia 7 8
Mexico 13 6
Peru 11 13
Mining
Argentina 4 2
Brazil 9 5
Chile 13 30
Colombia 3 1
Mexico 14 4
Peru 7 13
Projects in construction and in the pipeline for LAC6
17. 17
Project Risk Analytics: Tracking performance in Latin America’s top projects
Definitions
Projects covered include state-owned and private projects in the Infrastructure, Electric Power, Oil & Gas (excluding upstream), Water and Waste,
and Mining sectors.
Where applicable, a project is considered as such until the end of construction and ramp-up to full capacity (with the exception of mining projects,
where the date of commissioning signifies the end of the project). Projects must have a:
• Start date
• Estimate for completion
• Initial investment estimate
Data
For state-owned projects, initial information about the start date and estimates for completion and investment are taken from original signed con-
tracts, along with addendums and annexes.
If original contracts cannot be obtained, information is taken from public documents, presentations, news articles from BNamericas archives, and
external sources.
In cases where contracts are subject to approval by legislators, the start date is the date of the law or legislative approval.
In the case of private projects, information is taken from public sources, such as stock exchange filings, annual reports, company presentations,
third party research and press releases.
In judging the timing of investment decisions for private projects, great care was taken to differentiate between large projects receiving environmental
approval and proceeding directly to construction, and smaller projects where the investment decision hinges on securing financing.
Recorded data is correct at the time of entry and all efforts were made to ensure that each entry is backed with a relevant source.
The greatest care possible was taken to ensure consistency of information in order make a like-for-like comparison in project costs. Insofar as the
figures rely on disclosure by the organization or company responsible, the figures can be considered to be conservative in nature.
No attempt was made to adjust figures for inflation during the course of research or for consideration of the time value of money.
Validation
In the case of state-owned projects, validation is carried out where possible with either a member of the consortium, EPC contractor, a relevant
state agency or advisors to either party.
METHODOLOGY & PROCEDURES
18. 18
Project Risk Analytics: Tracking performance in Latin America’s top projects
tIMING Budget
Language definitions
Where guidance is non-specific as to dates for completion, the following is used.
Project to be completed by 2018 = December 31, 2017
Project to be completed in 2018 = December 31, 2018
Currency
Project costs are measured in US dollars.
Where project costs are measured in a local currency, amounts are converted to US dollars at the date of the relevant announcement, signature or
report.
Severity of deviation from original estimates
The severity of deviation from original estimates is defined according to set criteria.
Changes in Scope
Changes in scope beyond the start date are not accounted for.
Status StatusCondition Condition
Ahead of time
On time
Minor changes
Medium changes
Major changes
Ahead of budget
On budget
Minor changes
Medium changes
Major changes
95% of original estimate or below
(measured in months)
95% of original budget estimate
or below
95% to 105% of original estimate 95% to 105% of original estimate
105% to 120% of original estimate
105% to 120% of original budget
estimate
20% to 160% of original estimate
120% to 140% of original budget
estimate
Over 160% of original estimate
Over 140% of original budget
estimate
Disclaimers
• Figures and dates correspond to the latest publicly available information, as well as information gathered by BNamericas reporters and analysts,
and are subject to change.
• Changes to original budget estimates are shown as the total figure available and may include interest, working capital, inflation adjustments and
other contingencies in addition to capital expenditure.
• Amounts and overall results are shown in US dollars unless otherwise stated.
• BNamericas does not guarantee the sequence, accuracy, adequacy, completeness or availability of any information and is not responsible for
any errors or omissions or for the results obtained from the use of such information. There are no express or implied warranties. In no event shall
BNamericas, its agents, directors, officers, employees, representatives, successors, and assigns be liable for any damages of any nature in
connection with the BNamericas content.
19. 19
Project Risk Analytics: Tracking performance in Latin America’s top projects
About BNamericas Project Risk Analytics
BNamericas’ Project Risk Analytics tracks changes to estimates
of project completions dates and overall costs, in Latin
American infrastructure, energy and mining projects.
Governments, insurers, reinsurers, project financiers, risk
officers, asset managers and advisers can use this information
to analyze upcoming risk to schedules and financing costs,
and track the progress of existing projects for risk management
purposes.
By providing a top-down analysis of the timeliness and costs
of current Latin American projects, BNamericas provides a new
tool to the industry, allowing it to learn from past events and
improve planning for future projects.
In collaborating with the Major Projects research group at the
University of Oxford’s Saïd Business School, BNamericas
utilized the expertise of leading practitioners. The research
group is world-leading in its field with the most cited articles
in the field of major projects, programs and megaprojects in a
wide area of industries, such as transport infrastructure, energy,
civil engineering, IT and mega events.
Researchers advised and reviewed the methodology used by
the team and offered advice on structuring the data analysis to
make sense of the results. This collaboration ensured that the
data and the results are highly robust following international best
practice in terms of data collection and analysis.
About BNamericas
BNamericas delivers on-the-ground insight and trusted
business intelligence to companies and investors in Latin
America. BNamericas analyzes macro movements that
affect everyday business and future developments, including
social, political, economic, regulatory, technological, financial
and labor-related coverage. Connecting our clients with
trustworthy and timely insights, focused on 12 industry sectors,
BNamericas has been shaping the development of Latin
America for 19 years.
PROJECT
RISKANALYTICS
Improve
your planning
Increase
the chances of
successful delivery
Analyze
current projects
Subscribe and get access
to future reports and
individual project matrices
20. Project Risk Analytics: Tracking performance in Latin America’s top projects
www.BNamericas.com
CONTACT US TODAY!
Natan Levy
Head of Project Risk Analytics
nlevy@BNamericas.com
+56 (2) 2941-0386
Arvinder Ludhiarich
Commercial Director
aludhiarich@BNamericas.com
+56 (2) 2941-0300
Business Insight in Latin America
business insight
in latin americaBNamericas delivers on-the-ground insight and trusted business
intelligence to companies and investors active in and entering Latin
America for over 19 years, identifying opportunities early on and
connecting clients with business contacts and decision-makers.
Our subscription gives you access to:
NEWS PROJECT
PROFILES
COMPANY
PROFILES
INTELLIGENCE
REPORTs DATA