SlideShare ist ein Scribd-Unternehmen logo
1 von 96
Downloaden Sie, um offline zu lesen
WPS4122 
The Role of Education Quality in Economic Growth* 
Eric A. Hanushek Ludger Wößmann 
Hoover Institution University of Munich, 
Stanford University Ifo Institute for Economic Research and CESifo 
CESifo and NBER Poschingerstr. 5 
Stanford, CA 94305-6010, United States 81679 Munich, Germany 
Phone: (+1) 650 / 736-0942 Phone: (+49) 89 / 9224-1699 
E-mail: hanushek@stanford.edu E-mail: woessmann@ifo.de 
Internet: www.hanushek.net Internet: www.cesifo.de/woessmann 
Abstract 
The role of improved schooling, a central part of most development strategies, has become controversial 
because expansion of school attainment has not guaranteed improved economic conditions. This paper reviews 
the role of education in promoting economic well-being, with a particular focus on the role of educational 
quality. It concludes that there is strong evidence that the cognitive skills of the population – rather than mere 
school attainment – are powerfully related to individual earnings, to the distribution of income, and to economic 
growth. New empirical results show the importance of both minimal and high level skills, the complementarity 
of skills and the quality of economic institutions, and the robustness of the relationship between skills and 
growth. International comparisons incorporating expanded data on cognitive skills reveal much larger skill 
deficits in developing countries than generally derived from just school enrollment and attainment. The 
magnitude of change needed makes clear that closing the economic gap with developed countries will require 
major structural changes in schooling institutions. 
World Bank Policy Research Working Paper 4122, February 2007 
The Policy Research Working Paper Series disseminates the findings of work in progress to encourage the exchange of 
ideas about development issues. An objective of the series is to get the findings out quickly, even if the presentations are less 
than fully polished. The papers carry the names of the authors and should be cited accordingly. The findings, 
interpretations, and conclusions expressed in this paper are entirely those of the authors. They do not necessarily represent 
the view of the World Bank, its Executive Directors, or the countries they represent. Policy Research Working Papers are 
available online at http://econ.worldbank.org. 
* This project developed through conversations with Harry Patrinos, who provided useful comments and suggestions 
along the way. We have also benefited from comments by Martha Ainsworth, Luis Benveniste, François Bourguignon, 
Deon Filmer, Paul Gertler, Manny Jimenez, Ruth Kagia, Beth King, Lant Pritchett, and Emiliana Vegas. Support has come 
from the World Bank, CESifo, the Program on Education Policy and Governance of Harvard University, and the Packard 
Humanities Institute. 
Public Disclosure Authorized Public Disclosure Authorized Public Disclosure Authorized Public Disclosure Authorized
The Role of School Improvement in Economic Development 
By Eric A. Hanushek and Ludger Wößmann 
1. Introduction ........................................................................................................................................ 1 
2. Individual Returns to Education and Economic Inequality........................................................... 5 
2.1 Impacts of School Attainment on Individual Incomes.................................................................. 5 
2.2 Impacts of Educational Quality on Individual Incomes—Developed Countries.......................... 6 
2.3 Impacts of Educational Quality on Individual Incomes—Developing Countries....................... 11 
2.4 Evidence from the International Adult Literacy Survey ............................................................. 14 
2.5 Causality...................................................................................................................................... 16 
2.6 Income Distribution .................................................................................................................... 17 
3. Quantity of Schooling and Economic Growth............................................................................... 20 
3.1 Results of Initial Cross-country Growth Regressions................................................................. 20 
3.2 More Recent Evidence on the Effects of Levels of and Growth in Years of Schooling............. 22 
4. Quality of Education and Economic Growth ................................................................................ 25 
4.1 A Review of the Basic Results.................................................................................................... 25 
4.2 Issues of Endogeneity ................................................................................................................. 29 
4.3 Some New Evidence ................................................................................................................... 31 
4.4 Distribution of Educational Quality and Economic Growth....................................................... 38 
4.5 Institutions, Education and Growth............................................................................................. 40 
4.6 The Implications of Improved Quality........................................................................................ 43 
Appendix: Data on Quality of Education........................................................................................... 47 
5. Where Does the Developing World Stand?.................................................................................... 51 
5.1 Lack of Quantity of Schooling.................................................................................................... 51 
5.2 Lack of Quality of Education...................................................................................................... 52 
5.3 The Size of the Task at Hand: Schooling Quantity and Educational Quality Combined ........... 55 
6. Educational Spending and Student Outcomes .............................................................................. 59 
6.1 Cross-country Evidence on Resources........................................................................................ 60 
6.2 Within-country Evidence – Developed Countries ...................................................................... 63 
6.3 Within-country Evidence – Developing Countries ..................................................................... 66 
6.4 Is There a Minimum Resource Requirement? ............................................................................ 67 
7. Schooling Institutions and Educational Quality............................................................................ 68 
7.1 Choice and Competition in Developing Countries ..................................................................... 68 
7.2 Evidence on Autonomy of Schools............................................................................................. 70 
7.3 School Accountability................................................................................................................. 71 
7.4 Summary of How to Improve the Quality of Education ............................................................. 74 
8. Conclusion......................................................................................................................................... 76 
References.............................................................................................................................................. 80
1 
1. Introduction 
It takes little analysis to see that education levels differ dramatically between developing and 
developed countries. Building upon several decades of thought about human capital – and centuries of 
general attention to education in the more advanced countries – it is natural to believe that a productive 
development strategy would be to raise the schooling levels of the population. And, indeed, this is 
exactly the approach of the Education for All initiative and a central element of the Millennium 
Development Goals. 
But there are also some nagging uncertainties that exist with this strategy. First, developed and 
developing countries differ in a myriad of ways other than schooling levels. Second, a number of 
countries – both on their own and with the assistance of others – have expanded schooling 
opportunities without seeing any dramatic catch-up with developed countries in terms of economic 
well-being. Third, countries that do not function well in general might not be more able to mount 
effective education programs than they are to pursue other societal goals. Fourth, even when schooling 
policy is made a focal point, many of the approaches undertaken do not seem very effective and do not 
lead to the anticipated student outcomes. In sum, is it obvious that education is the driving force, or 
merely one of several factors that are correlated with more fundamental development forces? 
The objective of this study is to review what is known about the role of education in promoting 
economic well-being. We are interested in assessing what research says about these issues. More than 
that, we pay particular attention to the credibility of this research in establishing a causal relationship 
between education and economic outcomes and between policy initiatives and educational outcomes. 
The discussion also has one distinctive element. We have come to conclude that educational 
quality – particularly in assessing policies related to developing countries – is THE key issue. It is both 
conventional and convenient in policy discussions to concentrate on such things as years of school 
attainment or enrollment rates in schools. These things are readily observed and measured. They appear 
in administrative data, and they are published on a consistent basis in virtually all countries of the 
world. And, they are very misleading in the policy debates. 
We will show in graphic terms the differences in educational quality that exist. Most people would, 
in casual conversation, acknowledge that a year of schooling in a school in a Brazilian Amazon village 
was not the same as a year of schooling in a school in Belgium. They would also agree that families, 
peers, and others contribute to education. Yet, research on the economic impact of schools – largely 
due to expedience – almost uniformly ignores these. The data suggest that the casual conversation may 
actually tend to understate the magnitude of differences.
We will also provide strong evidence that ignoring quality differences significantly distorts the 
picture about the relationship between education and economic outcomes. This distortion occurs at 
three levels. It misses important differences between education and skills on the one hand and 
individual earnings on the other. It misses an important underlying factor determining the interpersonal 
distribution of incomes across societies. And, it very significantly misses the important element of 
education in economic growth. 
The plan of this study is straightforward. We begin by documenting the importance of cognitive 
skills – the measure of educational quality we use – in determining individual earnings, and by 
implication important aspects of the income distribution. We then turn to the relationship of education 
and economic growth. Research into the economics of growth has itself been a growth area, but much 
of the research focuses just on school attainment with no consideration of quality differences or of 
other sources of learning. We show, in part with new evidence, that the evidence is highly biased by its 
concentration on just quantity of schooling. 
In both of these areas, attention has been given to causality; i.e., is it reasonable to believe that 
changing education would directly lead to a change in economic outcomes? Again, the concentration 
on quantity of schooling has distorted these discussions of causality, and consideration of quality 
considerably alters the issues and implications. 
The simple answers in the discussion of economic implications of education are that educational 
quality, measured by cognitive skills, has a strong impact on individual earnings. More than that, 
however, educational quality has a strong and robust influence on economic growth. In both areas, 
there is credible evidence that these are truly causal relationships. 
To be sure, none of this says that schools per se are the answer. Even though it is common to treat 
education and schooling synonymously, it is important to distinguish between knowledge and skills on 
the one hand (educational quality in our terminology) and schooling. This semantic distinction has 
important substantive underpinnings. Cognitive skills may be developed in formal schooling, but they 
may also come from the family, the peers, the culture, and so forth. Moreover, other factors obviously 
have an important impact on earnings and growth. For example, overall economic institutions – a well-defined 
system of property rights, the openness of the economy, the security of the nation – can be 
viewed almost as preconditions to economic development. And, without them, education and skills 
may not have the desired impact on economic outcomes. 
Yet, while recognizing the impact of these overall institutions, we find that schools can play an 
important role. Quality schools can lead to improved educational outcomes. Moreover, from a public 
2
policy perspective, interventions in the schools are generally viewed as both more acceptable and more 
likely to succeed than, say, direct interventions in the family. 
Given the evidence on the importance of educational quality for economic outcomes, the study 
turns to important policy issues. To begin with, what can be said about the educational quality and 
cognitive skills in developing countries? Although information on enrollment and attainment has been 
fairly widely available, quality information has not. We use newly developed data on international 
comparisons of cognitive skills (also employed in the analysis of growth) to show that the education 
deficits in developing countries are larger than previously appreciated. 
Discussions of quality inevitably lead to questions about whether it can be affected by policy. An 
extensive literature, albeit one biased toward developed countries, now exists on a number of policy 
issues. Perhaps most well known is that simply putting more resources into schools – pure spending, 
reduced class sizes, increased teacher training, and the like – will not reliably lead to improvements in 
student outcomes. 
These findings are, however, often misinterpreted. First, they do not imply that schools have no 
effect. They say simply that common measures of school quality are in reality not closely related to 
student outcomes, but this is not the same as finding that school quality differences do not exist. 
Second, the findings do not say that spending and resources never matter. Indeed, there is some 
indication, particularly in developing countries, that a range of resources are important – textbooks, 
rudimentary facilities, and the like. The potential impacts of these are nonetheless too small to be 
instruments for radical changes in outcomes, something that the prior evidence indicates is needed in 
many developing countries. Third, the findings do not say that resources cannot matter. They indicate 
that resources may not have any consistent effects within the current structure and institutions of 
schools, but the findings do not put resource discussions into the context of alternative structures. 
One consistent finding that is emerging from research, albeit largely from developed country 
experiences, is that teacher quality has powerful impacts on student outcomes. The problem from a 
policy aspect is, however, that quality differences are not closely related to the common measures of 
quality and to the common policy instruments that are employed. Within countries where the data exist, 
there is little indication that quality is closely related to teacher education and training, teacher 
experience, teacher certification, or teacher salaries. These facts disrupt the policy discussions. They 
also make it clear that different sets of policies must be contemplated if schools are to improve. 
A different view of schools, however, concentrates on larger institutional issues. There is growing 
evidence that a number of devices – things that effectively change the existing incentives in schools – 
have an impact. Accountability systems based upon tests of student cognitive achievement can change 
3
the incentives for both school personnel and for students. By focusing attention on the true policy goal 
– instead of imperfect proxies based on inputs to schools – performance can be improved. These 
systems align rewards with outcomes. Moreover, increased local decision making or local autonomy, 
coupled with accountability, can facilitate these improvements. 
The evidence on a set of larger, and potentially more powerful, policy changes is relatively limited 
at the current time. There is suggestive evidence that greater school choice promotes better 
performance. Further, direct incentives to teachers and school personnel in the form of performance 
pay have promise. Unfortunately, however, these policies can lead to substantial changes in the 
incentives within schools, and such substantial changes are frequently resisted by current school 
personnel. Current employees, often through their unions, generally tend to resist and to stop even 
experimentation with such changes. Thus, direct evidence on them is more limited, and may require 
more inferences. Nonetheless, there remains reason to believe that pursuing these larger changes could 
lead to the substantial improvements in outcomes that are desired or hoped for in the policy process. 
4
2. Individual Returns to Education and Economic Inequality 
2.1 Impacts of School Attainment on Individual Incomes 
Most attention to the value of schooling focuses on the economic returns to differing levels of 
school attainment for individuals. This work, following the innovative analyses of human capital by 
Jacob Mincer (1970, 1974), considers how investing in differing amounts of schooling affects 
individual earnings. Over the past thirty years, literally hundreds of such studies have been conducted 
around the world.1 
These studies have uniformly shown that more schooling is associated with higher individual 
earnings. The rate of return to schooling across countries is centered at about 10 percent with variations 
in expected ways based largely on scarcity: returns appear higher for low income countries, for lower 
levels of schooling, and, frequently, for women (Psacharopoulos and Patrinos (2004)). 
Much of the academic debate has focused on whether these simple estimates provide credible 
measures of the causal effect of schooling. In particular, if more able people tend also to obtain 
additional schooling, the estimated schooling effect could include both the impacts of schooling and the 
fact that those continuing in school could earn more in the absence of schooling.2 For the most part, 
employing alternative estimation approaches dealing with the problems of endogeneity of schooling do 
not lead to large changes in the estimates, and many times they suggest that the returns are actually 
larger with the alternative estimation schemes than with the simpler modeling strategies. 
The basic estimates of Mincer earnings models are typically interpreted as the private returns to 
schooling. As is well known, the social returns could differ from the private returns – and could be 
either above or below the private returns. The most common argument is that the social returns will 
exceed the private returns because of the positive effects of education on crime, health, fertility, 
1 A variety of studies review and interpret the basic estimation of rates of return. See Psacharopoulos (1994), Card 
(1999), Harmon, Oosterbeek, and Walker (2003), Psacharopoulos and Patrinos (2004), and Heckman, Lochner, and Todd 
(2006). 
2 Harmon, Oosterbeek, and Walker (2003) systematically review the various issues and analytical approaches dealing 
with them along with providing a set of consistent estimates of returns (largely for OECD countries). They conclude that, 
while the estimation approaches can have an impact on the precise value of the rate of return, it is clear that there is a strong 
causal impact of school attainment on earnings. 
5
improved citizen participation,3 and (as we discuss below) on growth and productivity of the economy 
as a whole.4 If on the other hand schooling was more of a selection device than of a means of boosting 
knowledge and skills of individuals, the social return could be below the private return.5 Although there 
are many uncertainties about precisely how social returns might differ from private returns, there is 
overall little reason to believe that the social returns are less than the private returns, and there are a 
variety of reasons to believe that they could be noticeably higher. 
2.2 Impacts of Educational Quality on Individual Incomes—Developed Countries 
The concentration on school attainment in the academic literature, however, contrasts with much 
of the policy discussion that, even in the poorest areas, involves elements of “quality” of schooling. 
Most countries are involved in policy debates about the improvement of their schools. These debates, 
often phrased in terms of such things as teacher salaries or class sizes, rest on a presumption that there 
is a high rate of return to schools in general and to quality in particular. 
But it is not appropriate simply to presume that any spending on schools is a productive investment 
that will see the returns estimated for attainment. It is instead necessary to ascertain two things: how 
various investments translate into quality and how that quality relates to economic returns. This section 
provides a summary of what is known about the individual returns to educational quality in both 
developed and developing countries. 
One of the challenges to understanding the impact of quality differences in human capital has been 
simply knowing how to measure quality. Much of the discussion of quality—in part related to new 
efforts to provide better accountability—has identified cognitive skills as the important dimension. 
3 Recent studies indeed find evidence of externalities of education in such areas as reduced crime (Lochner and Moretti 
(2004)), improved health of children (Currie and Moretti (2003)), and improved civic participation (Dee (2004); Milligan, 
Moretti, and Oreopoulos (2004)). The evidence on direct production spillovers of education among workers is more mixed, 
with Moretti (2004) and the studies cited therein finding favorable evidence and Acemoglu and Angrist (2000) and Ciccone 
and Peri (2006) finding no evidence for this kind of spillovers. 
4 In the Mincer earnings work, social rates of return are frequently calculated. These calculations are not based on the 
positive externalities cited but instead on the fact that the social cost of subsidized education exceeds the private costs – thus 
lowering the social rate of return relative to the private rate of return (see Psacharopoulos and Patrinos (2004)). 
5 The empirical analysis of these issues has been very difficult because the labor market outcomes of the 
screening/selection model and the productivity/human capital model are very similar if not identical. Lange and Topel 
(2006) review the theory and empirical work and conclude that there is little evidence that the social rate of return to 
schooling is below the private rate of return. 
6
And, while there is ongoing debate about the testing and measurement of these skills, most parents and 
policy makers alike accept the notion that cognitive skills are a key dimension of schooling outcomes. 
The question is whether this proxy for school quality—students’ performance on standardized tests—is 
correlated with individuals’ performance in the labor market and the economy’s ability to grow. 
Until fairly recently, little comprehensive data have been available to show any relationship 
between differences in cognitive skills and any related economic outcomes. The many analyses of 
school attainment and Mincer earnings functions rely upon readily available data from censuses and 
other surveys, which find it easy to collect information on earnings, school attainment, age, and other 
demographic information. On the other hand, it is difficult to obtain data on cognitive skills along with 
earnings and the other determinants of wages. Although cognitive test and school resource data are 
increasingly available at the time of schooling, these are seldom linked to subsequent labor market 
information. Such analyses generally require tracking individuals over time, a much more difficult data 
collection scheme. Such data are, however, now becoming available. 
A variety of researchers are now able to document that the earnings advantages to higher 
achievement on standardized tests are quite substantial.6 While these analyses emphasize different 
aspects of individual earnings, they typically find that measured achievement has a clear impact on 
earnings after allowing for differences in the quantity of schooling, the experiences of workers, and 
other factors that might also influence earnings. In other words, higher quality as measured by tests 
similar to those currently being used in accountability systems around the world is closely related to 
individual productivity and earnings. 
Three recent U.S. studies provide direct and quite consistent estimates of the impact of test 
performance on earnings (Mulligan (1999); Murnane, Willett, Duhaldeborde, and Tyler (2000); Lazear 
(2003)). These studies employ different nationally representative data sets that follow students after 
they leave school and enter the labor force. When scores are standardized, they suggest that one 
6 These results are derived from different specific approaches, but the basic underlying analysis involves estimating a 
standard “Mincer” earnings function and adding a measure of individual cognitive skills. This approach relates the 
logarithm of earnings to years of schooling, experience, and other factors that might yield individual earnings differences. 
The clearest analyses are found in the following references for the U.S. (which are analyzed in Hanushek (2002b)). See 
Bishop (1989, 1991); O'Neill (1990); Grogger and Eide (1993); Blackburn and Neumark (1993, 1995); Murnane, Willett, 
and Levy (1995); Neal and Johnson (1996); Mulligan (1999); Murnane, Willett, Duhaldeborde, and Tyler (2000); Altonji 
and Pierret (2001); Murnane, Willett, Braatz, and Duhaldeborde (2001); and Lazear (2003). 
7
standard deviation increase in mathematics performance at the end of high schools translates into 12 
percent higher annual earnings.7 
Murnane, Willett, Duhaldeborde, and Tyler (2000) provide evidence from the High School and 
Beyond and the National Longitudinal Survey of the High School Class of 1972. Their estimates 
suggest some variation with males obtaining a 15 percent increase and females a 10 percent increase 
per standard deviation of test performance. Lazear (2003), relying on a somewhat younger sample from 
NELS88, provides a single estimate of 12 percent. These estimates are also very close to those in 
Mulligan (1999), who finds 11 percent for the normalized AFQT score in the NLSY data.8 Note that 
these returns can be thought of as how much earnings would increase with higher quality each and 
every year throughout the persons’ working career. Thus, the present value of the returns to higher 
quality is large. 
These estimates are obtained fairly early in the work career (mid-20s to early 30s), and analyses of 
the impact of cognitive skills across the entire work life are more limited. Altonji and Pierret (2001) 
find that the impact of achievement on earnings grows with experience, because the employer has a 
chance to observe the performance of workers. The pattern of how returns change with age from their 
analysis is shown in Figure 2.1, where the power of school attainment differences to predict differences 
in earnings is replaced by cognitive skills as workers are in the labor force longer. The evidence is 
consistent with employers relying on readily available information on school attainment when they do 
not have other information and switching to observations of skills and performance as that information 
becomes available through job performance.9 On the other hand, Hanushek and Zhang (2006) do not 
find that this pattern holds for a wider set of countries (although it continues to hold for the United 
7 Because the units of measurement differ across tests, it is convenient to convert test scores into measures of the 
distribution of achievement across the population. A one-half standard deviation change would move somebody from the 
middle of the distribution (the 50th percentile) to the 69th percentile; a one standard deviation change would move this 
person to the 84th percentile. Because tests tend to follow a bell-shaped distribution, the percentile movements are largest at 
the center of the distribution. 
8 By way of comparison, we noted that estimates of the value of an additional year of school attainment are typically 
about 10 percent. Of course, any investment decisions must recognize that quality and quantity are generally produced 
together and that costs of changing each must be taken into account. 
9 Note that Altonji and Pierret (2001) observe a limited age range, so that these changing returns may well be thought 
of as leveling off after some amount of labor market experience. 
8
States in their data). Thus, there is some uncertainty currently about whether cognitive skills have 
differential effects on economic outcomes over the work-experience profile.10 
Figure 2.1: Returns to Observed Educational Quantity and Unobserved Educational Quality 
1 year of education 1 SD of academic achievement (AFQT) 
9 
over the Work Life 
14% 
12% 
10% 
8% 
6% 
4% 
2% 
0% 
0 1 2 3 4 5 6 7 8 9 10 11 12 13 
Work experience (years) 
Increase in earning 
Notes: Based on data from National Longitudinal Survey of Youth (NLSY) and Armed Forces Qualification Test (AFQT). 
SD = standard deviation. 
Source: Based on Altonji and Pierret (2001). 
There are other reasons to believe that these estimates provide a lower bound on the impact of 
higher achievement. First, the labor market experiences that are observed begin in the mid-1980s and 
extend into the mid-1990s, but other evidence suggests that the value of skills and of schooling has 
grown throughout and past that period. Second, extrapolating from recent patterns, future general 
improvements in productivity are likely to lead to larger returns to skill.11 Finally, cognitive skills 
10Hanushek and Zhang (2006), discussed below, do find that the importance of cognitive skills is not restricted just to 
younger workers (represented in most prior research) but holds across the experience spectrum. 
11 The considered analyses typically compare workers of different ages at one point in time to obtain an estimate of 
how earnings will change for any individual. If, however, productivity improvements occur in the economy, these will tend 
to raise the earnings of individuals over time. If recent patterns of skill bias in productivity improvement continue, the
measured by test scores are prone to considerable measurement error. Even if the tests were measuring 
exactly the relevant skill concept, we know that there are substantial errors in each test.12 These errors 
will in general lead to downward biases in the estimated coefficients. 
A limited number of additional studies are available for developed countries outside of the United 
States. McIntosh and Vignoles (2001) study wages in the United Kingdom and find strong returns to 
both numeracy and literacy.13 Finnie and Meng (2002) and Green and Riddell (2003) investigate returns 
to cognitive skills in Canada. Both suggest that literacy has a significant return, but Finnie and Meng 
(2002) find an insignificant return to numeracy. This latter finding stands at odds with most other 
analyses that have emphasized numeracy or math skills. 
Another part of the return to school quality comes through continuation in school.14 There is 
substantial U.S. evidence that students who do better in school, either through grades or scores on 
standardized achievement tests, tend to go farther in school.15 Murnane, Willett, Duhaldeborde, and 
impact of improvements in student skills are likely to rise over the work life instead of being constant as portrayed here (cf. 
Katz and Murphy (1992)). On the other hand, such skill-biased change has not always been the case, and technology could 
push returns in the opposite direction. 
12 In most testing situations, both the reliability of the specific test and the validity of the test are considered. 
Reliability relates to how well the test measures the specific material – and would include elements of specific question 
development and choice along with individual variations that would occur if an individual took the same test at different 
points in time. Validity refers to the correspondence between the desired concept (skills related to productivity or earnings 
differences) and the specific choice of test domains (such as mathematical concepts at some specific level). 
13 Because they look at discrete levels of skills, it is difficult to compare the quantitative magnitudes directly to the 
10 
U.S. work. 
14 As noted above, much of the work by economists on differences in worker skills has actually been directed at the 
issue of determining the average labor market returns to additional schooling. The argument has been that higher-ability 
students are more likely to continue in schooling. Therefore, part of the higher earnings observed for those with additional 
schooling really reflects pay for added ability and not for the additional schooling. Economists have pursued a variety of 
analytical approaches for dealing with this, including adjusting for measured cognitive test scores, but this work generally 
ignores issues of variation in school quality. The various adjustments for ability differences typically make small differences 
on the estimates of the value of schooling, and Heckman and Vytlacil (2001) argue that it is not possible to separate the 
effects of ability and schooling. The only explicit consideration of school quality typically investigates expenditure and 
resource differences across schools, but these are known to be poor measures of school quality differences (Hanushek 
(2002b)). 
15 See, for example, Dugan (1976); Manski and Wise (1983). Rivkin (1995) finds that variations in test scores capture 
a considerable proportion of the systematic variation in high school completion and in college continuation, so that test 
score differences can fully explain black-white differences in schooling. Bishop (1991) and Hanushek, Rivkin, and Taylor
Tyler (2000) separate the direct returns to measured skill from the indirect returns of more schooling 
and suggest that perhaps one-third to one-half of the full return to higher achievement comes from 
further schooling. Note also that the effect of quality improvements on school attainment incorporates 
concerns about drop out rates. Specifically, higher student achievement keeps students in school longer, 
which will lead among other things to higher graduation rates at all levels of schooling.16 
Knighton and Bussière (2006) find that higher scores at age 15 lead to significantly higher rates of 
post-secondary schooling of Canadian 19-year-olds. This finding is particularly interesting for the 
international comparisons that we consider below, because the analysis follows up on precisely the 
international testing that is used in our analysis of economic growth.17 
2.3 Impacts of Educational Quality on Individual Incomes—Developing Countries 
Questions remain about whether the clear impacts of quality in the U.S. generalize to other 
countries, particularly developing countries. The literature on returns to cognitive skills in developing 
countries is restricted to a relatively limited number of countries: Ghana, Kenya, Morocco, Pakistan, 
South Africa, and Tanzania. Moreover, a number of studies actually employ the same basic data, albeit 
with different analytical approaches, but come up with somewhat different results. Table 2.1 provides a 
simple summary of the quantitative estimates available for developing countries. 
(1996), in considering the factors that influence school attainment, find that individual achievement scores are highly 
correlated with continued school attendance. Neal and Johnson (1996) in part use the impact of achievement differences of 
blacks and whites on school attainment to explain racial differences in incomes. Their point estimates of the impact of 
cognitive skills (AFQT) on earnings and school attendance appear to be roughly comparable to that found in Murnane, 
Willett, Duhaldeborde, and Tyler (2000). Behrman, Kletzer, McPherson, and Schapiro (1998) find strong achievement 
effects on both continuation into college and quality of college; moreover, the effects are larger when proper account is 
taken of the various determinants of achievement. Hanushek and Pace (1995) find that college completion is significantly 
related to higher test scores at the end of high school. 
16 This work has not, however, investigated how achievement affects the ultimate outcomes of additional 
schooling. For example, if over time lower-achieving students tend increasingly to attend further schooling, these schools 
may be forced to offer more remedial courses, and the variation of what students know and can do at the end of school may 
expand commensurately. 
17 The OECD tested random samples of 15-year-old students across participating countries under the PISA program in 
2000. Students taking these tests in Canada were then followed and surveyed in 2002 and 2004. See Section 4, below. 
11
Table 2.1: Summary of Estimated Returns to a Standard Deviation Increase in Cognitive Skills 
Country Study Estimated effecta Notes 
Ghana Glewwe (1996) 0.21**-0.3** (government) 
12 
0.14-0.17 (private) 
Alternative estimation approaches yield some differences; math effects shown generally 
more important than reading effects, and all hold even with Raven’s test for ability. 
Ghana Jolliffe (1998) 0.05-0.07* Household income related to average math score with relatively small variation by 
estimation approach; effect is only observed with off-farm income, and on-farm income 
is not significantly related to cognitive skills. 
Ghana Vijverberg (1999) ? Income estimates for math and reading with nonfarm self-employment; highly variable 
estimates (including both positive and negative effects) but effects not generally 
statistically significant. 
Kenya Boissiere, Knight, 
and Sabot (1985); 
Knight and Sabot 
(1990) 
0.19**-0.22** Total sample estimates: small variation by primary and secondary school leavers. 
Morocco Angrist and Lavy 
(1997) 
? Cannot convert to standardized scores because use indexes of performance; French 
writing skills appear most important for earnings, but results depend on estimation 
approach. 
Pakistan Alderman, 
Behrman, Ross, 
and Sabot (1996) 
0.12-0.28* Variation by alternative approaches and by controls for ability and health; larger and 
more significant without ability and health controls. 
Pakistan Behrman, Ross, 
and Sabot 
(forthcoming) 
0.25 Estimates of structural model with combined scores for cognitive skill; significant 
effects of combined math and reading scores which are instrumented by school inputs 
South Africa Moll (1998) 0.34**-0.48** Depending on estimation method, varying impact of computation; comprehension (not 
shown) generally insignificant. 
Tanzania Boissiere, Knight, 
and Sabot (1985); 
Knight and Sabot 
(1990) 
0.07-0.13* Total sample estimates: smaller for primary than secondary school leavers. 
*significant at 0.05 level; **significant at 0.01 level. 
a. Estimates indicate proportional increase in wages from a one standard deviation increase in measured test scores.
The summary of the evidence in Table 2.1 permits a tentative conclusion that the returns to quality 
may be even larger in developing countries than in developed countries. This of course would be 
consistent with the range of estimates for returns to quantity of schooling (e.g,., Psacharopoulos (1994) 
and Psacharopoulos and Patrinos (2004)), which are frequently interpreted as indicating diminishing 
marginal returns to schooling. 
There are some reasons for caution in interpreting the precise magnitude of estimates. First, the 
estimates appear to be quite sensitive to the estimation methodology itself. Both within individual 
studies and across studies using the same basic data, the results are quite sensitive to the techniques 
employed in uncovering the fundamental parameter for cognitive skills.18 Second, the evidence on 
variations within developing countries is not entirely clear. For example, Jolliffe (1998) finds little 
impact of skills on farm income, while Behrman, Ross, and Sabot (forthcoming) suggest an 
equivalence across sectors at least on theoretical grounds. 
Nonetheless, the overall summary is that the available estimates of the impact of cognitive skills on 
outcomes suggest strong economic returns within developing countries. The substantial magnitude of 
the typical estimates indicates that educational quality concerns are very real for developing countries 
and that this aspect of schools simply cannot be ignored – a topic that comes up below. 
Evidence also suggests that educational quality is directly related to school attainment. In Brazil, a 
country plagued by high rates of grade repetition and ultimate school dropouts, Harbison and Hanushek 
(1992) show that higher cognitive skills in primary school lead to lower repetition rates. Further, 
Hanushek, Lavy, and Hitomi (2006) find that lower quality schools, measured by lower value-added to 
cognitive achievement, lead to higher dropout rates in Egyptian primary schools. Thus, as found for 
developed countries, the full economic impact of higher educational quality comes in part through 
greater school attainment. 
This complementarity of school quality and attainment also means that actions that actually 
improve quality of schools will yield a bonus in terms of meeting goals for attainment. Conversely, 
simply attempting to expand access and attainment, say through starting a large number of low quality 
schools, will be self-defeating to the extent that there is a direct reaction to the low quality that affects 
the actual attainment results. 
18 The sensitivity to estimation approach is not always the case; see, for example, Jolliffe (1998). A critique and 
interpretation of the alternative approaches within a number of these studies can be found in Glewwe (2002). 
13
2.4 Evidence from the International Adult Literacy Survey 
The preceding analyses for both developed and developing countries rely largely on panel data that 
follow individuals from school into the labor market. The alternative approach as found in the 
International Adult Literacy Survey (IALS) is to test a sample of adults and then to relate these 
measures to labor market experiences.19 An advantage of this data collection approach is that it 
provides information about the labor market experiences across a broader range of age and labor 
market experience.20 
Consistent data on basic skills of literacy and numeracy for a representative sample of the 
population aged 15-65 were collected for a sample of countries between 1994 and 1998.21 These data 
permit direct comparisons of the relative importance of quantity and quality of schooling across 
countries, although the bias toward developed economies remains. Hanushek and Zhang (2006) 
estimate returns to school attainment and to literacy scores for the 13 countries where continuous 
measures of individual earnings are available.22 
Figures 2.2 and 2.3 provide the relevant summary information on the returns to skills, estimated in 
a model that jointly includes school attainment and literacy scores. As in the prior analyses, both school 
attainment and cognitive skills enter into the determination of individual incomes. With the exception 
of Poland, literacy scores have a consistent positive impact on earnings (Figure 2.2). The (unweighted) 
average of the impact of literacy scores is 0.093, only slightly less than found previously for the U.S. 
19 This design was subsequently repeated in 2003 with the Adult Literacy and Lifeskills Survey (ALL), but only six 
countries participated, and the data were unavailable for this study. 
20 This approach does also present some complications, because the individuals of different ages have both different 
adult learning experiences and different times of attending school of possibly different quality. Hanushek and Zhang (2006) 
consider these alternatives, but they do not change the qualitative results about the impact of cognitive skills that are 
presented here. 
21 Twenty-three countries and regions participated in one of three different waves of surveys conducted in 1994, 1996 
and 1998. Country participation included some sub-country divisions (e.g., Flemish speaking Belgium and Italian speaking 
Switzerland). Not all countries provided background information and wage information. IALS provides information on the 
skills and attitudes of adults aged 16-65 in a number of different areas, and the analysis here combines the scores in a single 
measure of literacy. 
22 Samples include full-time workers between 26 and 65 years of age. In all the models, the dependent variable is the 
logarithm of annual earnings from employment; control variables are gender, potential experience and its square, and an 
indicator for living in rural area. 
14
studies.23 On the other hand, the estimated impact of school attainment across the 13 countries is just 
0.049 after adjusting the Mincer returns for the literacy scores. This low estimate partly reflects the 
joint consideration of literacy scores and school attainment. The estimated return to years of schooling 
without considering literacy scores is 0.06, which is still below the more common estimates of about 
0.1. As Figure 2.3 shows, the estimates that adjust for literacy scores are below the unadjusted returns 
in every country except Poland. 
Figure 2.2: Returns to Cognitive Skills, International Adult Literacy Survey 
Norway 
Hungary 
15 
0.3 
0.25 
0.2 
0.15 
0.1 
0.05 
0 
USA 
Switzerland 
Chile 
Netherlands 
Finland 
Germany 
Sweden 
Czech Rep 
Denmark 
Italy 
Poland 
Increase per stnd. dev. 
Source: Hanushek and Zhang (2006). 
23 The U.S. is noticeably higher than other countries and the previous U.S. studies, perhaps reflecting that these 
earnings are obtained across the entire work life. The average excluding the U.S. is still 0.08.
Figure 2.3: Returns to School Attainment, International Adult Literacy Survey 
16 
0.12 
0.1 
0.08 
0.06 
0.04 
0.02 
0 
USA 
Hungary 
Czech Rep 
Chile 
Poland 
Italy 
Denmark 
Finland 
Germany 
Netherlands 
Norway 
Switzerland 
Sweden 
Mincer returns Adjusted Mincer returns 
Source: Hanushek and Zhang (2006). 
The literacy tests in IALS are designed to measure quite basic skills only, and yet the differences 
are strongly associated with higher earnings. These results, from a broad age spectrum across a number 
of countries, reinforce the importance of quality. 
The sample of countries for the IALS unfortunately contains just one developing country – Chile. 
Nonetheless, it is suggestive that the returns both to quantity of schooling and quality exceed those 
found across the countries with the exception of the United States. In the three transition economies 
(Czech Republic, Hungary, and Poland), the returns to school attainment are also near the top of the 
sample, but the returns to educational quality are noticeably lower – perhaps reflecting institutional 
aspects of their labor markets. 
2.5 Causality 
The focus on causality of estimated returns to school attainment has not been duplicated for the 
estimated impacts of cognitive skills. The potential problems are, however, considerably different. The 
tests, with the exception of the IALS sampling, are uniformly given at a date before the labor market
experiences – eliminating the possibility that higher income leads individuals to do things that raise 
their test scores.24 Nevertheless, this fact alone does not solve all of the interpretative issues. 
For our analysis, the most important issue is the source of any test score differences. It is natural to 
believe that schools have an influence on tests, but clearly other factors also enter. The extensive 
investigations of the determinants of achievement differences indicate that parents, peers, 
neighborhoods, and other factors enter along with school factors in determining achievement (see 
Hanushek (2002b)). Thus, most importantly, it is inappropriate to interpret test scores as simply 
reflecting school quality or school policy. 
We return to a discussion of possible school policies below, but at this point it is sufficient to note 
that skills – however formed – have a systematic impact on earnings. Thus, if we can find approaches 
that increase skills reliably, the available evidence strongly indicates that individual earnings and 
productivity will also increase.25 
The other side of this issue is also important, however. Using just quantity of schooling in the 
earnings analyses assumes that formal schooling is the only source of skill development. But, if a 
variety of other inputs such as families or peers is also important in the formation of human capital, 
simple years of schooling is subject to this additional source of systematic measurement error. 
17 
2.6 Income Distribution 
One implication of the impact of cognitive skills on individual earnings is that the distribution of 
those skills in the economy will have a direct effect on the distribution of income. Cognitive skills by 
themselves do not of course determine the full distribution, because other factors such as labor market 
institutions, taxes, and the like enter. But the importance of skills is becoming increasingly evident. 
Very suggestive evidence on the impact of skills on the income distribution comes from Nickell 
(2004). Nickell, using the IALS data, considers how differences in the distribution of incomes across 
countries are affected by the distribution of skills and by institutional factors including unionization and 
24 The IALS sampling raises the concern that tests change with age, because of continual learning or simple age 
depreciation of skills and knowledge. An investigation of this by Hanushek and Zhang (2006) suggests that these are not 
large concerns in the estimation of the earnings functions. 
25 There could be other things that simultaneously affect both scores and earnings, such that scores are simply a 
proxy for some other important factor. Available evidence gives no reason to suspect that such factors are important.
minimum wages. While union coverage is statistically significant, he concludes that “the bulk of the 
variation in earnings dispersion is generated by skill dispersion” (page C11).26 
The impact of the skill distribution across countries is shown dramatically in Figure 2.4, which is 
derived from a comparison of the dispersion of wages and the dispersion of prose literacy scores (each 
measured as the ratio of the 90th to the 10th percentile). The tight pattern around the regression line 
reflects a simple correlation of 0.85 (which is not affected by including the other institutional factors). 
Figure 2.4: Inequality of Educational Quality and Earnings 
IRE 
18 
Earnings 4.5 
inequality 
4.0 
3.5 
3.0 
2.5 
2.0 
1.5 
FIN 
GER 
NET 
1.3 1.5 1.7 1.9 
Test score inequality 
DEN 
USA 
CAN 
UK 
SWI 
AUS 
BEL 
SWE 
NOR 
Note: Measure of inequality is the ratio of ninth decile to first decile in both cases; test performance refers to prose literacy 
in the International Adult Literacy Survey. 
Source: Nickell (2004). 
26 De Gregorio and Lee (2002) find a (somewhat weaker) positive association between inequality in years of schooling 
and income inequality.
Other studies have also concluded that skills have an increasing impact on the distribution of 
income (e.g., Juhn, Murphy, and Pierce (1993)). In the U.S., the distribution of incomes within 
schooling groups has been rising (Levy and Murnane (1992)), i.e., holding constant schooling 
attainment, the income distribution has become more dispersed in reflection of growing rewards to 
individual skills. 
Again, these studies do not attempt to describe the causal structure, and it would be inappropriate 
to attribute the variance in earnings simply to differences in the quantity or quality of schooling. 
Nonetheless, to the extent that these contribute to variations in cognitive skills, it is fair to conclude that 
policies aimed at improving school quality (and educational outcomes) will have direct impacts on the 
income distribution. 
19
3. Quantity of Schooling and Economic Growth 
Given the microeconomic evidence of the productivity-enhancing effects of education, it seems 
natural to extend the view to the macroeconomic perspective of long-run economic growth of 
countries. From a theoretical viewpoint, there are at least three mechanisms through which education 
may affect economic growth. First, just as in the micro perspective, education increases the human 
capital inherent in the labor force, which increases labor productivity and thus transitional growth 
towards a higher equilibrium level of output (as in augmented neoclassical growth theories, cf. 
Mankiw, Romer, and Weil (1992)). Second, education may increase the innovative capacity of the 
economy, and the new knowledge on new technologies, products and processes promotes growth (as in 
theories of endogenous growth, cf., e.g., Lucas (1988); Romer (1990a); Aghion and Howitt (1998)). 
Third, education may facilitate the diffusion and transmission of knowledge needed to understand and 
process new information and to successfully implement new technologies devised by others, which 
again promotes economic growth (cf., e.g., Nelson and Phelps (1966); Benhabib and Spiegel (2005)). 
3.1 Results of Initial Cross-country Growth Regressions 
Just as in the literature on microeconomic returns to education, the majority of the macroeconomic 
literature on economic growth that tries to test these predictions employs the quantitative measure of 
years of schooling, now averaged across the labor force.27 Early studies used adult literacy rates (e.g., 
Azariadis and Drazen (1990); Romer (1990b)) or school enrollment ratios (e.g., Barro (1991); Mankiw, 
Romer, and Weil (1992); Levine and Renelt (1992)) as proxies for the human capital of an economy. 
These were followed by attempts to measure average years of schooling based on perpetual inventory 
methods (cf. Lau, Jamison, and Louat (1991); Nehru, Swanson, and Dubey (1995)).28 Then, it was 
particularly the work by Barro and Lee (1993, 2001) which provided internationally comparable data 
on average years of schooling for a large sample of countries and years, based on a combination of 
census or survey data on educational attainment wherever possible, using literacy and enrollment data 
to fill gaps in the census data. 
27 More precisely, the most commonly used measure is average years of schooling in the working-age population, 
usually defined as the population aged 15 years and over, instead of the actual labor force. 
28 For a survey of measurement and specification issues from early growth accounting to current cross-country growth 
20 
regressions, see Wößmann (2003b).
Using average years of schooling as the education measure implicitly assumes that a year of 
schooling delivers the same increase in knowledge and skills regardless of the education system. For 
example, a year of schooling in Papua New Guinea is assumed to create the same increase in 
productive human capital as a year of schooling in Japan. Additionally, this measure assumes that 
formal schooling is the primary (sole) source of education and, again, that variations in the quality of 
nonschool factors have a negligible effect on education outcomes. This neglect of cross-country 
differences in the quality of education is probably the major drawback of such a quantitative measure 
of schooling, and we will come back to this issue in great detail below. 
The standard method to estimate the effect of education on economic growth is to estimate cross-country 
growth regressions where countries’ average annual growth in gross domestic product (GDP) 
per capita over several decades is expressed as a function of measures of schooling and a set of other 
variables deemed to be important for economic growth. Following the classical contributions by Barro 
(1991, 1997) and Mankiw, Romer, and Weil (1992),29 a vast early literature of cross-country growth 
regressions has tended to find a significant positive association between quantitative measures of 
schooling and economic growth (for extensive reviews of the literature, see, e.g., Topel (1999); Temple 
(2001); Krueger and Lindahl (2001); Sianesi and Van Reenen (2003)).30 To give an idea of the 
robustness of this association, in the recent extensive robustness analysis by Sala-i-Martin, 
Doppelhofer, and Miller (2004) of 67 explanatory variables in growth regressions on a sample of 88 
countries, primary schooling turns out to be the most robust influence factor (after an East Asian 
dummy) on growth in GDP per capita in 1960-1996. 
Because this literature has been extensively reviewed elsewhere (see references above), rather than 
going into the details of the numerous important contributions, we will focus on a few important issues 
that emerge in the literature. 
29 Temple and Wößmann (2006) show that the significantly positive effect of education that Mankiw, Romer, and Weil 
(1992) find does not depend on their often criticized use of an education flow measure based on enrollment rates, but can be 
replicated when using years of schooling as a measure of the level of human capital in their model. 
30 A closely related literature weights years of schooling by parameters from microeconomic Mincer earnings 
equations (see Section 2.1 above) to construct a measure of the stock of human capital, which is then used in growth 
accounting and development accounting exercises. These use a given macroeconomic production function together with 
parameter estimates from other research to calculate the share of cross-country differences in growth or levels of income 
which can be accounted for by cross-country differences in education (see Klenow and Rodriquez-Clare (1997) and Hall 
and Jones (1999) for examples). 
21
3.2 More Recent Evidence on the Effects of Levels of and Growth in Years of Schooling 
To provide a basic representation of the association between years of schooling and economic 
growth on the most recent version of available data, we use a slightly extended version31 of the 
education data by Cohen and Soto (2001), representing the average years of schooling of the population 
aged 15 to 64, together with data on real GDP per capita in 1960-2000 from the latest update (version 
6.1) of the Penn World Tables by Heston, Summers, and Aten (2002).32 Figure 3.1 plots the average 
annual rate of growth in GDP per capita over the 40-year period against years of schooling at the 
beginning of the period for a sample of 92 countries. Both growth and education are expressed 
conditional on the initial level of output, to account for the significant conditional convergence effect.33 
The regression results depicted by Figure 3.1 imply that each year of schooling is statistically 
significantly associated with a long-run growth rate that is 0.58 percentage points higher.34 The positive 
association is substantially larger in the sample of non-OECD countries (at 0.56) than in the sample of 
OECD countries (at 0.26), which is in line with the pattern of larger returns to education in developing 
countries discussed above.35 However, after controlling for the influence of openness and the security 
of property rights, the association becomes substantially smaller and turns insignificant, and it is close 
to zero when the total fertility rate is controlled for. Thus, while there is a clear positive association 
between years of schooling and growth in the latest available data, it is also somewhat sensitive to 
model specifications. 
31 See Jamison, Jamison, and Hanushek (forthcoming) for details of the extension. 
32 As discussed below, one line of investigation has been the impact of mismeasurement of the quantity of education 
on growth. The Cohen and Soto (2001) data improve upon the original quantity data by Barro and Lee. 
33 Added-variable plots show the association between two variables after the influences of other control variables are 
taken out. Thus, both of the two variables are first regressed on the other controls (in this case, initial GDP). Only the 
residual of these regressions, which is the part of the variation in the two variables which cannot be accounted for by the 
controls, is used in the graph. In so doing, the graph makes sure that the depicted association between the two variables is 
not driven by the control variables. The procedure is numerically equivalent to including the other controls in a multivariate 
regression of the dependent variable (growth) on the independent variable under consideration in the graph. 
34 The association is somewhat lower (at 0.32), but still significant when regional dummies are added to the regression. 
35 Similarly, the association is larger in the sample of countries below the median of initial output than above the 
22 
median.
Figure 3.1: Added-variable Plot of Growth and Years of Schooling without Test-score Controls 
Notes: Added-variable plot of a regression of the average annual rate of growth (in percent) of real GDP per capita in 1960- 
2000 on average years of schooling in 1960 and the initial level of real GDP per capita in 1960. Own calculations. 
A considerable controversy has emerged in the literature about whether it is the level of years of 
schooling (as would be predicted by several models of endogenous growth) or the change in years of 
schooling (as would be predicted in basic neoclassical frameworks) which is the more important driver 
of economic growth. The early evidence, such as in Benhabib and Spiegel (1994) and discussed in 
Barro and Sala-i-Martin (2004), found a positive effect of educational levels, but not of changes in 
education. However, Temple (1999) shows that in the latter case, an existing positive association was 
hidden by a few unrepresentative outlying observations. Considerable evidence has also emerged that 
there was substantial measurement error in the education data (cf. Krueger and Lindahl (2001)), and it 
is well known that measurement error affects results based on changes in variables even more than 
results based on their levels. Subsequent evidence suggests that both levels of and changes in years of 
schooling may show a positive association with growth (cf. Gemmell (1996); Topel (1999); Krueger 
and Lindahl (2001)). 
More recently, two studies have tried to overcome some problems of mismeasurement in the early 
Barro-Lee data on years of schooling: de la Fuente and Doménech (2001, 2006) for the sample of 
OECD countries and Cohen and Soto (2001) for a broader sample of countries (and the data that we use 
23
here). Both studies find robust evidence of a positive association between changes in education and 
economic growth. Even more recently, Ciccone and Papaioannou (2005) find strong support for both 
the human capital level and the human capital accumulation effects using cross-country industry-level 
data that allow them to control for country-specific and industry-specific effects. 
When we add the change in years of schooling over 1960-2000 to the specification depicted in 
Figure 3.1 and similar specifications, it never turns significant with the sole exception of the sample of 
23 OECD countries.36 (Because of the possibly substantial amount of mismeasurement in the education 
data, though, the results on the first-differenced data on changes in education may well suffer). 
Thus, while recent research tends to find a positive effect of schooling quantity on economic 
growth, it seems beyond the scope of current data to draw strong conclusions about the relative 
importance of different mechanisms by which schooling quantity may affect economic growth. 
However, several recent studies suggest that education is important both as an investment in human 
capital and in facilitating research and development and the diffusion of technologies. With respect to 
the relative importance of the latter two mechanisms, Vandenbussche, Aghion, and Meghir (2006) 
suggest that innovation is more important relative to imitation for countries close to the technological 
frontier. As a consequence, the composition of human capital between basic and higher education may 
be important, with initial phases of education being more important for imitation and higher education 
being more important for innovation. Vandenbussche, Aghion, and Meghir (2006) provide evidence 
from a panel of OECD countries in line with this argument, which – when applied to developing 
countries – might suggest that a focus on basic skills seems warranted for developing countries. We 
will come back to the issue of the relative importance of basic versus advanced skills in more detail in 
Section 4.4 below. 
Two more skeptical studies raise noteworthy caveats, and we will return to each of them below. 
First, Bils and Klenow (2000) raise the issue of causality, suggesting that reverse causation running 
from higher economic growth to additional education may be at least as important as the causal effect 
of education on growth in the cross-country association. We will address the issue of causality in cross-country 
regressions in Section 4.2 below. Second, one of the conclusions that Pritchett (2001, 2006) 
draws from the fragility of the evidence linking changes in education to economic growth is that it is 
important for economic growth to get other things right as well, in particular the institutional 
framework of the economy. We will address this issue in Section 4.4 below. 
36 The positive association between growth in education and economic growth in the OECD sample is sensitive to the 
24 
inclusion of Korea, though.
4. Quality of Education and Economic Growth 
4.1 A Review of the Basic Results 
The most important caveat with the literature on education and growth reviewed in the preceding 
section, though, is that it sticks to years of schooling as its measure of education at the neglect of 
qualitative differences in ensuing knowledge. As discussed in the section on individual returns to 
education, this neglect probably misses the core of what education is all about. And this neglect seems 
even more severe in cross-country comparisons than in analyses within countries: Who would sensibly 
assume that the average student in a school in Ghana or Peru would gain the same amount of 
knowledge in any year of schooling as the average student in a school in Finland or Korea? Still, using 
the quantitative measure of years of schooling does exactly that. It seems beyond doubt that one year of 
schooling does not create the same amount of acquired knowledge regardless of the quality of the 
education system in which it takes place, but delivers different increases in skills depending on the 
efficiency of the education system, the quality of teaching, the educational infrastructure, or the 
curriculum. Thus, rather than counting how long students have sat in school, it seems crucial to focus 
on how much students have learned while in school when estimating the effect of education on 
economic growth. 
Years of schooling has a second major shortcoming. Its use implicitly assumes that all skills and 
human capital formation come from formal schooling. Yet extensive evidence on knowledge 
development and cognitive skills indicates that a variety of factors outside of school – family, peers, 
and others – have a direct and powerful influence. Ignoring these nonschool factors introduces another 
element of measurement error into the growth analyses in the same way as it did in the analysis of 
individual earnings. 
From the mid-1960s to today, international agencies have conducted many international tests of 
students’ performance in cognitive skills such as mathematics and science (see the appendix to this 
section for details). Employing a re-scaling method that makes performance at different international 
tests comparable (again, see appendix), we can use performance on these standardized tests as a proxy 
for the quality of education. Figure 4.1 presents average student performance on twelve testing 
occasions37 on the transformed scale which maps performance on each test to the scale of the recent 
37 Note that each testing occasion may combine results from several tests at different age levels and in different 
subjects, so that there are 36 separate test observations altogether; see appendix for details. 
25
PISA international test. This scale has a mean of 500 and a standard deviation of 100 among the OECD 
countries in PISA.38 As is obvious from the figure, the developing countries that ever participated in 
one of the tests perform dramatically lower than any country in the group of OECD countries. The 
variation in the quality of education that exists among OECD countries is already substantial, but the 
magnitude of the difference to developing countries in the average amount of learning that has taken 
place after a given number of years of schooling dwarfs any within-OECD difference.39 
Over the past ten years, empirical growth research demonstrates that consideration of the quality of 
education, measured by the cognitive skills learned, alters the assessment of the role of education in the 
process of economic development dramatically. When using the data from the international student 
achievement tests through 1991 to build a measure of educational quality, Hanushek and Kimko (2000) 
– first released as Hanushek and Kim (1995) – find a statistically and economically significant positive 
effect of the quality of education on economic growth in 1960-1990 that dwarfs the association 
between quantity of education and growth. Thus, even more than in the case of education and 
individual earnings, ignoring quality differences very significantly misses the true importance of 
education for economic growth. Their estimates suggest that one country-level standard deviation 
(equivalent to 47 test-score points in PISA 2000 mathematics, on whose scale Figure 4.1 is based) 
higher test performance would yield around one percentage point higher annual growth rates. 
38 To facilitate comparisons, the within-country standard deviation of PISA test scores ranges between 80 and 108 in 
26 
mathematics in the OECD countries; the U.S. value is 98. 
39 The precise scaling on the transformed metric is of course subject to considerable noise, in particular for the early 
tests and for countries performing far below the international mean. The tests are usually not developed to provide reliable 
estimates of performance in the tails of the achievement distribution, which would be relevant for very poorly performing 
countries. However, the rough pattern of overall performance should not be severely affected by the re-scaling. For 
example, the average performance level of Peruvian students on PISA 2002 where no re-scaling is involved is 292 in math, 
333 in science and 327 in reading.
Figure 4.1: Adjusted Performance on International Student Achievement Tests 
Source: Hanushek and Wößmann (in process), based on the different tests; see appendix to this section for details. 
27
This estimate stems from a statistical model that relates annual growth rates of real GDP per capita 
to the measure of educational quality, years of schooling, the initial level of income, and several other 
control variables (including in different specifications the population growth rates, political measures, 
openness of the economies, and the like). Hanushek and Kimko (2000) find that adding educational 
quality to a base specification including only initial income and educational quantity boosts the 
variance in GDP per capita among the 31 countries in their sample that can be explained by the model 
from 33 to 73 percent. The effect of years of schooling is greatly reduced by including quality, leaving 
it mostly insignificant. At the same time, adding the other factors leaves the effects of quality basically 
unchanged. 
Several studies have since found very similar results. Another early contribution, by Lee and Lee 
(1995), found an effect size similar to Hanushek and Kimko (2000) using data from the 1970-71 First 
International Science Study on the participating 17 countries, also leaving quantitative measures of 
education with no significant effect on growth. Using a more encompassing set of international tests, 
Barro (2001) also finds that, while both the quantity and the quality of education matter for economic 
growth, quality is much more important. Employing the quality measure developed by Hanushek and 
Kimko (2000) in a development accounting framework, Wößmann (2002, 2003b) finds that the share 
of cross-country variation in levels of economic development attributable to international differences in 
human capital rises dramatically when quality of education is taken into account.40 
Extensions of the measure of Hanushek and Kimko (2000) and its imputation in Wößmann 
(2003b) are also used in the cross-country growth regressions by Bosworth and Collins (2003) and in 
the cross-country industry-level analysis by Ciccone and Papaioannou (2005). Both also find that 
educational quality strongly dominates any effect of educational quantity on growth.41 Coulombe, 
Tremblay, and Marchand (2004) and Coulombe and Tremblay (2006) use test-score data from the 
International Adult Literacy Survey (see Section 2.4 above) in a panel of 14 OECD countries, 
confirming the result that the quality measure outperforms quantitative measures of education. Finally, 
Jamison, Jamison, and Hanushek (forthcoming) extend the Hanushek and Kimko (2000) analysis by 
40 This work builds on Gundlach, Rudman, and Wößmann (2002) and analyzes output per worker in 132 countries in 
1990. The variation that can be attributed to international differences in human capital rises from 21 percent to 45 percent 
once the quality of education is taken into account, and to over 60 percent in samples with reasonable data quality. 
41 Bosworth and Collins (2003) cannot distinguish the effect of quality of education from the effect of quality of 
government institutions. The analysis in Section 4.5 below shows, however, that they can be separated when we use our 
new quality measure that also extends the country sample by several additional data points on international tests scores. 
28
using the mathematics component of the transformed and extended tests shown in Figure 4.1, 
replicating and strengthening the previous results by using test data from a larger number of countries, 
controlling for a larger number of potentially confounding variables and extending the time period of 
the analysis. Using the panel structure of their growth data, they suggest that education seems to 
improve income levels mainly though speeding up technological progress, rather than shifting the level 
of the production function or increasing the impact of an additional year of schooling. 
In sum, the existing evidence suggests that the quality of education, measured by the knowledge 
that students gain as depicted in tests of cognitive skills, is substantially more important for economic 
growth than the mere quantity of education. 
29 
4.2 Issues of Endogeneity 
As noted, growth modeling is naturally subject to a common concern: Do the identified factors 
represent truly causal influences or mere associations that will not affect growth if altered by policy? 
The concerns about causality in the relationship of cognitive skills and growth have been addressed 
in detail by Hanushek and Kimko (2000). They conclude that causation concerns are very different in 
the case of quality than quantity, being much less of an issue in interpreting the results. Because 
causality issues are important for assessing our results below, we describe the Hanushek and Kimko 
direct investigations. 
One common concern in analyses such as this is that schooling might not be the actual cause of 
growth but, in fact, may just reflect other attributes of the economy that are beneficial to growth. For 
example, the East Asian countries consistently score very highly on the international tests (see Figure 
4.1), and they also had extraordinarily high growth over the 1960–1990 period. It may be that other 
aspects of these East Asian economies have driven their growth and that the statistical analysis of labor 
force quality simply is picking out these countries. But in fact, even if the East Asian countries are 
excluded from the analysis, a strong—albeit slightly smaller—relationship is still observed with test 
performance. This test of sensitivity of the results seems to reflect a basic importance of school quality, 
a factor that contributes also to the observed growth of East Asian countries. 
Another concern is that other factors that affect growth, such as efficient market organizations, are 
also associated with efficient and productive schools—so that, again, the test measures are really a 
proxy for other attributes of the country. To investigate this, Hanushek and Kimko concentrate on 
immigrants to the United States who received their education in their home countries. They find that 
immigrants who were schooled in countries that have higher scores on the international math and 
science examinations earn more in the United States. On the other hand immigrants receiving part or all
of their schooling in the United States do not see any earnings advantage linked to the cognitive skills 
of their home country. This analysis makes allowance for any differences in school attainment, labor 
market experience, or being native English-language speakers. In other words, skill differences as 
measured by the international tests are clearly rewarded in the United States labor market, reinforcing 
the validity of the tests as a measure of individual skills and productivity. 
Finally, the observed relationships could simply reflect reverse causality, that is, that countries that 
are growing rapidly have the added resources necessary to improve their schools and that better student 
performance is the result of growth, not the cause of growth. This issue is potentially important when 
policy alternatives are considered below, but, as a simple test of this, Hanushek and Kimko investigated 
whether the international math and science test scores were systematically related to the resources 
devoted to the schools in the years prior to the tests. They were not. If anything, their results suggested 
relatively better performance in those countries spending less on their schools. 
One final issue warrants consideration: The United States has never done well on these 
international assessments, yet its growth rate has been very high for a long period of time. The 
reconciliation is that quality of the labor force is just one aspect of the economy that enters into the 
determination of growth. A variety of factors clearly contribute, and these factors work to overcome 
any deficits in quality. These other factors may also be necessary for growth. In other words, simply 
providing more or higher-quality schooling may yield little in the way of economic growth in the 
absence of other elements, such as the appropriate market, legal, and governmental institutions to 
support a functioning modern economy. Past experiences investing in less developed countries that lack 
these institutional features suggest that schooling is not necessarily itself a sufficient engine of growth 
(e.g., Easterly (2002); Pritchett (2001)). 
We take up these issues about quality of societal institutions in detail below, because the evidence 
suggests that they are very important and could potentially distort the analysis of the impacts of human 
capital. Here, however, we briefly consider the U.S. situation, both because it sets the stage for more 
recent analyses and because it helps to provide some balance to the overall picture of growth. 
Three other factors immediately come to mind as being important in U.S. growth and as potentially 
masking to detrimental effects of low school quality. First, almost certainly the most important factor 
sustaining the growth of the U.S. economy is the openness and fluidity of its markets. The United 
States maintains generally freer labor and product markets than most countries in the world. The 
government generally has less regulation on firms, and trade unions are less extensive than those in 
many other countries. Even broader, the United States has less intrusion of government in the operation 
of the economy, including lower tax rates and minimal government production through nationalized 
30
industries. These factors encourage investment, permit the rapid development of new products and 
activities by firms, and allow U.S. workers to adjust to new opportunities. While identifying the precise 
importance of these factors is difficult, a variety of analyses suggest that such market differences could 
be very important explanations for differences in growth rates.42 
Second, over the twentieth century, the expansion of the education system in the United States 
outpaced that around the world. The United States pushed to open secondary schools to all citizens. 
With this came also a move to expand higher education with the development of land grant 
universities, the G.I. bill, and direct grants and loans to students. More schooling with less learning 
each year still yielded more human capital than found in other nations that have less schooling but 
more learning in each of those years.43 
Third, the analysis of growth rates across countries emphasizes quality of the elementary and 
secondary schools of the United States. It does not include any measures of the quality of U.S. colleges. 
By most evaluations, U.S. colleges and universities rank at the very top in the world. A number of 
models of economic growth in fact emphasize the importance of scientists and engineers as a key 
ingredient to growth. By these views, the technically trained college students who contribute to 
invention and to development of new products provide a special element to the growth equation. Here, 
again, the United States appears to have the best programs. 
Finally, in terms of endogeneity, it is important to note that our current work (reported below) 
replicates two of the tests in Hanushek and Kimko (2000). Specifically, in the context of extended 
growth analyses, we consider potential biases from including the East Asian countries, and we consider 
the resources-skills relationship. 
31 
4.3 Some New Evidence 
To provide the most up-to-date evidence, we extend the existing evidence in several ways. The 
new evidence adds additional international student achievement tests not previously available and uses 
the most recent data on economic growth which allow an analysis for an even longer time period 
(1960-2000). Furthermore, the new data extend the sample of countries with available test-score and 
growth information from 31 countries in Hanushek and Kimko (2000) to 50 countries (see the appendix 
of this section for details on the data). In the subsequent sections, we will also use these data to analyze 
42 See, for example, Krueger (1974); World Bank (1993); Parente and Prescott (1994, 1999). 
43 This advantage has clearly ended as many OECD countries have expanded schools to exceed the quantity of 
schooling found in the United States (see Organisation for Economic Co-operation and Development (2003)).
effects of the distribution of educational quality at the bottom and at the top on economic growth, as 
well as interactions between educational quality and the institutional infrastructure of an economy. 
Our measure of the quality of education is a simple average of the mathematics and science scores 
over all the international tests depicted in Figure 4.1. We interpret this as a proxy for the average 
educational performance of the whole labor force. This measure encompasses overall cognitive skills, 
not just those developed in schools. Thus, whether skills are developed at home, in schools, or 
elsewhere, they are included in the growth analyses. As in the analyses underlying Figure 3.1, the 
source of the income data is version 6.1 of the Penn World Tables (cf. Heston, Summers, and Aten 
(2002)), and the data on years of schooling is an extended version of the Cohen and Soto (2001) data. 
The basic result is reported in column (2) of Table 4.1 and depicted graphically in Figure 4.2.44 
After controlling for the initial level of GDP per capita and for years of schooling, the test-score 
measure features a statistically significant effect on the growth in real GDP per capita in 1960-2000. 
According to this specification, test scores that are larger by one standard deviation (measured at the 
student level across all OECD countries in PISA) are associated with an average annual growth rate in 
GDP per capita that is two percentage points higher over the whole 40-year period. Below we relate 
these numbers to outcomes of school reform policies. 
When educational quality is added to a model that just includes initial income and years of 
schooling (column (1) of Table 4.1), the share of variation in economic growth explained by the model 
(the adjusted R2) jumps from 0.25 to 0.73. As in Figure 3.1, quantity of education is statistically 
significantly related to economic growth in a specification that neglects educational quality, but the 
association between years of schooling and growth turns insignificant and is reduced to close to zero 
once the quality of education is included in the model (see the bottom of Figure 4.2).45 In either 
specification, there is evidence for conditional convergence in the sense that countries with higher 
initial income tend to grow more slowly over the subsequent period. 
44 For a brief technical description of added-variable plots see Section 3.2 above. 
45 The result remains the same when the measure of years of schooling refers to the average between 1960 and 2000, 
rather than the initial 1960 value. The coefficient estimate on years of schooling in the 50-country sample of column (1) of 
Table 4.1 is somewhat smaller than the one reported for the 92-country sample reported in Figure 3.1, corresponding to the 
fact discussed above that the estimate tends to be smaller in high-income countries. 
32
Table 4.1: Education as Determinant of Growth of Income per Capita, 1960-2000 
(1) (2) (3)a (4) 
GDP per capita 1960 -0.379 -0.302 -0.277 -0.351 
(4.24) (5.54) (4.43) (6.01) 
Years of schooling 1960 0.369 0.026 0.052 0.004 
(3.23) (0.34) (0.64) (0.05) 
Test score (mean) 1.980 1.548 1.265 
33 
(9.12) (4.96) (4.06) 
Openness 0.508 
(1.39) 
Protection against expropriation 0.388 
(2.29) 
Constant 2.785 -4.737 -3.701 -4.695 
(7.41) (5.54) (3.32) (5.09) 
N 50 50 50 47 
R2 (adj.) 0.252 0.728 0.741 0.784 
Dependent variable: average annual growth rate in GDP per capita, 1960-2000. t-statistics in parentheses. a Regression 
includes five regional dummies.
Figure 4.2: Added-variable Plots of Growth and Education 
Notes: Added-variable plots of a regression of the average annual rate of growth (in percent) of real GDP per capita in 
1960-2000 on the initial level of real GDP per capita in 1960, average test scores on international student achievement tests, 
and average years of schooling in 1960. Author calculations; see Table 4.1, column (2). 
34
The same pattern of results is preserved when we ignore any variation between world regions by 
including five regional dummies (column (3) of Table 4.1).46 That is, even when considering just the 
variation that exists within each region, educational quality is significantly related to economic growth, 
with a coefficient estimate reduced from 1.98 to 1.55. 
One of the most important fundamental determinants of economic growth discussed in the recent 
literature is the institutional framework of the economy (see Section 4.5 below for details). The most 
common and powerful measures of the institutional framework used in empirical work are the openness 
of the economy to international trade and the security of property rights.47 When we add these two 
institutional variables to our model, they are jointly highly significant (column (4) of Table 4.1). But 
the positive effect of educational quality on economic growth is very robust to the inclusion of these 
controls, albeit slightly reduced in magnitude to 1.26. 
Other potential determinants of economic growth often discussed in the literature are fertility and 
geography. However, when we add the total fertility rate and common geographical proxies, such as 
latitude or the fraction of the land area of a country that is located within the geographic tropics, to the 
specification reported in column (4) of Table 4.1, neither of these additional variables is statistically 
significantly associated with economic growth. Furthermore, none of the other results, in particular for 
educational quality, are qualitatively affected. 
An important issue is whether the role of educational quality in the process of economic 
development differs between developing and developed countries. In Table 4.2, we divide the sample 
of countries into two groups in two different ways. First, in columns (5) and (6), we subdivide the 
sample into OECD countries and non-OECD countries. Results are remarkably similar, with the point 
estimate of the effect of educational quality slightly larger in non-OECD countries. However, the effect 
of educational quality on economic growth does not differ significantly between the two groups of 
46 The regions are East Asia, South Asia, Latin America, Middle East and North Africa, Sub-Saharan Africa, and the 
35 
industrial countries. 
47 The proxy for openness used here is the fraction of years between 1960 and 1998 that a country was classified as 
having an economy open to international trade, based on five factors including tariffs, quotas, exchange rate controls, export 
controls, and whether or not a socialist economy (cf. Sachs and Warner (1995)). The proxy for security of property rights is 
an index of the protection against expropriation risk, averaged over 1985-1995, from Political Risk Services (a private 
company which assesses the risk that investments will be expropriated in different countries), ranging from 0 to 10 (high 
figures corresponding to low risk), as used by Acemoglu, Johnson, and Robinson (2001) and provided in McArthur and 
Sachs (2001). This measure of the risk of confiscation and forced nationalization of property is often used as a summary 
variable for institutional quality, and similar data were first used in this framework by Knack and Keefer (1995).
countries. The results remain qualitatively the same when openness and quality of institutions are again 
added as control variables. 
Table 4.2: Education as Determinant of Growth of Income per Capita, 1960-2000: Sub-samples 
(5) (6) (7) (8) 
Developing 
countriesa OECD sample Low-income 
36 
countriesb 
High-income 
countriesc 
GDP per capita 1960 -0.262 -0.301 -0.063 -0.294 
(1.77) (5.81) (0.28) (6.38) 
Years of schooling 1960 0.025 0.025 0.006 0.152 
(0.20) (0.26) (0.05) (1.70) 
Test score (mean) 2.056 1.736 2.286 1.287 
(6.10) (4.17) (6.98) (5.37) 
Constant -5.139 -3.539 -6.412 -2.489 
(3.63) (1.96) (4.52) (2.86) 
N 27 23 25 25 
R2 (adj.) 0.676 0.830 0.707 0.783 
Dependent variable: average annual growth rate in GDP per capita, 1960-2000. a Non-OECD countries. b Countries below 
sample median of GDP per capital 1960. c Countries above sample median of GDP per capital 1960. 
Second, in columns (7) and (8), we subdivide the sample into countries above and below the 
sample median of initial GDP per capita. Again, the significant effect of educational quality remains 
robust in both sub-samples.48 Here, the effect of quality is considerably larger in the low-income 
countries, and the difference in the coefficients on test scores is statistically significant at the five 
percent level. Thus, if anything, the effect of educational quality is larger in developing countries than 
in developed countries. Furthermore, the robustness of the effect in the sub-samples is remarkable, in 
particular considering the small sample sizes of the specifications reported in Table 4.2. 
When adding an interaction term between years of schooling and test scores to the specification, 
the interaction term is insignificant in the full sample of countries. But in the sub-sample of low-income 
countries (with a GDP per capita below the sample median in 1960), the interaction term is 
significantly positive. At least in this sample, the returns to increased years of schooling increase with 
the quality of the education. Once there is a high-quality school system, it pays to keep children longer 
in school – but it does not if the school system does not produce skills. 
48 Similarly, the effect of educational quality remains robust in the two sub-samples of countries above and below the 
median of economic growth over the considered period, with the point estimate larger in the high-growth sample.
Importantly, the results do not appear to be an artifact of the specific time period, set of countries, 
or achievement measurement decisions. Extensive robustness tests confirm the strong and significant 
relationship between educational quality and economic growth. 
The results reported in Tables 4.1 and 4.2 are robust to several alternative approaches to measuring 
the quality of education. The results remain qualitatively the same when using only the tests performed 
at the level of lower secondary education, excluding any test in primary schooling or in the final year of 
secondary education. Arguably, test scores at the end of the secondary level, which combine the 
knowledge accumulated over primary and secondary schooling, may be more relevant for the human 
capital of the labor force than test scores that capture only the knowledge at the end of either primary or 
lower secondary school. At the same time, the duration of secondary education differs across countries, 
so that tests performed in the final year of secondary schooling in each country may not be as readily 
comparable across countries as the grade-based target populations. Further, given differing school 
completion rates, the test for the final year of secondary schooling may imply cross-country samples 
with differential selectivity of test takers. Neither the primary-school tests nor the tests in the final 
secondary year are crucial for the results. 
Furthermore, results are qualitatively the same when using only scores on tests performed since 
1995. These recent tests have not been used in the previous analyses and are generally viewed as 
having the highest standard of sampling and quality control. Likewise, results are robust to using tests 
scores since 1995 for just lower secondary grades. 
A drawback of using only the more recent tests is that such an approach requires a strong version 
of the assumption that test performance is reasonably constant over time, because it relates test 
performance measured since 1995 to the economic data for 1960-2000. To make sure that higher 
previous economic growth is not driving the measured test performance, we also used a test score 
measure that disregards all tests since the late 1990s. Our results turn out to be robust, with a point 
estimate on the test score variable that is significantly higher, when we restrict the tests to only those 
conducted until 1995 (sample reduced to 34 countries) and until 1984 (22 countries).49 In sum, the 
results are not driven by either early or late test scores alone. 
The results are also robust to performing the analyses in two sub-periods, 1960-1980 and 1980- 
2000. The most recent period includes the Asian currency crisis and other major economic disruptions 
49 We can also use the average early test scores (either until 1984 or until 1995) as an instrument for the average of all 
test scores in a two-stage least-squares regression, in order to utilize only that part of the total test-score measure that can be 
traced back to the early test scores. Again, our results are robust to such an instrumental-variable approach. 
37
Role of quality education to economic growth- quality education and its impact to the countrys development my internet income role of quality education to economic growth

Weitere ähnliche Inhalte

Was ist angesagt?

Impact of Education on Socio-Economic Development of Rural People of Bangladesh
Impact of Education on Socio-Economic Development of Rural People of BangladeshImpact of Education on Socio-Economic Development of Rural People of Bangladesh
Impact of Education on Socio-Economic Development of Rural People of BangladeshDr. Mokter Hossain
 
Economics of education 04.11.11(3)
Economics of education 04.11.11(3)Economics of education 04.11.11(3)
Economics of education 04.11.11(3)Dan Curtis
 
Economics of Education
Economics of EducationEconomics of Education
Economics of EducationSener Salci
 
Economics of education 14.11.11(1)
Economics of education 14.11.11(1)Economics of education 14.11.11(1)
Economics of education 14.11.11(1)Dan Curtis
 
Education & economic dev't.
Education & economic dev't.Education & economic dev't.
Education & economic dev't.Johanna Manzo
 
Education reform working paper
Education reform working paperEducation reform working paper
Education reform working paperRodje Malcolm
 
Education as An Investment: Economic Perspective
Education as An Investment: Economic Perspective Education as An Investment: Economic Perspective
Education as An Investment: Economic Perspective Mad Jutt
 
Lecture 1 investment in education
Lecture 1   investment in educationLecture 1   investment in education
Lecture 1 investment in educationSaviour Adzovor
 
Education: Investments on who and why?
Education: Investments on who and why?Education: Investments on who and why?
Education: Investments on who and why?TITA research
 
Comparative Development Indicators
Comparative Development IndicatorsComparative Development Indicators
Comparative Development IndicatorsIbrashPasha
 
Principles of economics of education
Principles of economics of educationPrinciples of economics of education
Principles of economics of educationRavi Mishra
 
Education as an investment
Education as an investmentEducation as an investment
Education as an investmentathulyavijayan
 
Restructuring Educational Goals for National and Economic Development in Nigeria
Restructuring Educational Goals for National and Economic Development in NigeriaRestructuring Educational Goals for National and Economic Development in Nigeria
Restructuring Educational Goals for National and Economic Development in Nigeriaiosrjce
 
Educ. 307 (Demands and Supply of Education-Phil.)
Educ. 307 (Demands and Supply of Education-Phil.)Educ. 307 (Demands and Supply of Education-Phil.)
Educ. 307 (Demands and Supply of Education-Phil.)Divine Dizon
 
Presentation education as investment (2)
Presentation education as investment (2)Presentation education as investment (2)
Presentation education as investment (2)FATHIMASHAJAHAN4
 
The Economic Value of Liberal Education
The Economic Value of Liberal EducationThe Economic Value of Liberal Education
The Economic Value of Liberal EducationRobert Kelly
 

Was ist angesagt? (20)

Impact of Education on Socio-Economic Development of Rural People of Bangladesh
Impact of Education on Socio-Economic Development of Rural People of BangladeshImpact of Education on Socio-Economic Development of Rural People of Bangladesh
Impact of Education on Socio-Economic Development of Rural People of Bangladesh
 
Economics of education 04.11.11(3)
Economics of education 04.11.11(3)Economics of education 04.11.11(3)
Economics of education 04.11.11(3)
 
Economics of Education
Economics of EducationEconomics of Education
Economics of Education
 
Economics of Education
Economics of EducationEconomics of Education
Economics of Education
 
Economics of education 14.11.11(1)
Economics of education 14.11.11(1)Economics of education 14.11.11(1)
Economics of education 14.11.11(1)
 
Education & economic dev't.
Education & economic dev't.Education & economic dev't.
Education & economic dev't.
 
Higher Education And Economic Development
Higher Education And Economic DevelopmentHigher Education And Economic Development
Higher Education And Economic Development
 
Education reform working paper
Education reform working paperEducation reform working paper
Education reform working paper
 
Education as An Investment: Economic Perspective
Education as An Investment: Economic Perspective Education as An Investment: Economic Perspective
Education as An Investment: Economic Perspective
 
Lecture 1 investment in education
Lecture 1   investment in educationLecture 1   investment in education
Lecture 1 investment in education
 
Educational investment
Educational investmentEducational investment
Educational investment
 
Investment in Education
Investment in EducationInvestment in Education
Investment in Education
 
Education: Investments on who and why?
Education: Investments on who and why?Education: Investments on who and why?
Education: Investments on who and why?
 
Comparative Development Indicators
Comparative Development IndicatorsComparative Development Indicators
Comparative Development Indicators
 
Principles of economics of education
Principles of economics of educationPrinciples of economics of education
Principles of economics of education
 
Education as an investment
Education as an investmentEducation as an investment
Education as an investment
 
Restructuring Educational Goals for National and Economic Development in Nigeria
Restructuring Educational Goals for National and Economic Development in NigeriaRestructuring Educational Goals for National and Economic Development in Nigeria
Restructuring Educational Goals for National and Economic Development in Nigeria
 
Educ. 307 (Demands and Supply of Education-Phil.)
Educ. 307 (Demands and Supply of Education-Phil.)Educ. 307 (Demands and Supply of Education-Phil.)
Educ. 307 (Demands and Supply of Education-Phil.)
 
Presentation education as investment (2)
Presentation education as investment (2)Presentation education as investment (2)
Presentation education as investment (2)
 
The Economic Value of Liberal Education
The Economic Value of Liberal EducationThe Economic Value of Liberal Education
The Economic Value of Liberal Education
 

Ähnlich wie Role of quality education to economic growth- quality education and its impact to the countrys development my internet income role of quality education to economic growth

Economy at work
Economy at workEconomy at work
Economy at worktbmathis
 
Top of the Class Science
Top of the Class ScienceTop of the Class Science
Top of the Class ScienceMasTalentum
 
CommonCoreWebinar
CommonCoreWebinarCommonCoreWebinar
CommonCoreWebinarppageegd
 
Exploring scholarship and scholarly activity in college-based Higher Education
Exploring scholarship and scholarly activity in college-based Higher EducationExploring scholarship and scholarly activity in college-based Higher Education
Exploring scholarship and scholarly activity in college-based Higher EducationThe Education and Training Foundation
 
Prosperity Through Education Plan
Prosperity Through Education Plan Prosperity Through Education Plan
Prosperity Through Education Plan Salt Lake Chamber
 
The Financial Empowerment of Urban Youth
The Financial Empowerment of Urban YouthThe Financial Empowerment of Urban Youth
The Financial Empowerment of Urban YouthAngel Rich
 
Creating a baseline for Corporate CSR Spend on Global Education Initiatives
Creating a baseline for Corporate CSR Spend on Global Education InitiativesCreating a baseline for Corporate CSR Spend on Global Education Initiatives
Creating a baseline for Corporate CSR Spend on Global Education InitiativesSustainable Brands
 
Wealth Taking or Wealth Making?: What Does The Evidence Tell Us About Effecti...
Wealth Taking or Wealth Making?:What Does The Evidence Tell Us About Effecti...Wealth Taking or Wealth Making?:What Does The Evidence Tell Us About Effecti...
Wealth Taking or Wealth Making?: What Does The Evidence Tell Us About Effecti...Mike Blamires
 
roadmap for ensuring americas future HSI higher ed
roadmap for ensuring americas future HSI higher edroadmap for ensuring americas future HSI higher ed
roadmap for ensuring americas future HSI higher edFr. Brendan Curran, O.P.
 
What Schools Should Know About Online Learning -- Oct 2010
What Schools Should Know About Online Learning -- Oct 2010What Schools Should Know About Online Learning -- Oct 2010
What Schools Should Know About Online Learning -- Oct 2010Jeffrey Hunt
 
Family Business succession in Poland. Study on career paths of next generatio...
Family Business succession in Poland. Study on career paths of next generatio...Family Business succession in Poland. Study on career paths of next generatio...
Family Business succession in Poland. Study on career paths of next generatio...Łukasz Tylczyński
 
Vibhuti patel economics of eduation
Vibhuti patel economics of eduationVibhuti patel economics of eduation
Vibhuti patel economics of eduationVIBHUTI PATEL
 
Sheeo strategic priorities_for_hbc_us_teacher_prep
Sheeo strategic priorities_for_hbc_us_teacher_prepSheeo strategic priorities_for_hbc_us_teacher_prep
Sheeo strategic priorities_for_hbc_us_teacher_prepEducationNC
 
Global Obsession With Rankings Hazelkorn
Global Obsession With Rankings HazelkornGlobal Obsession With Rankings Hazelkorn
Global Obsession With Rankings HazelkornKolds
 
BGP_Entrepreneurship-in-Education.pdf
BGP_Entrepreneurship-in-Education.pdfBGP_Entrepreneurship-in-Education.pdf
BGP_Entrepreneurship-in-Education.pdfReshmiMaulik1
 
Building a Culture of Innovation in Higher Education
Building a Culture of Innovation in Higher EducationBuilding a Culture of Innovation in Higher Education
Building a Culture of Innovation in Higher EducationLuciano Sathler
 
O futuro da profissão docente
O futuro da profissão docenteO futuro da profissão docente
O futuro da profissão docentePedro Barreiros
 
Report Trends in shaping education 2022.pptx
Report Trends in shaping education 2022.pptxReport Trends in shaping education 2022.pptx
Report Trends in shaping education 2022.pptxSherieAnnCaasalanBen
 
Aligning-Health-Education
Aligning-Health-EducationAligning-Health-Education
Aligning-Health-EducationSean Slade
 

Ähnlich wie Role of quality education to economic growth- quality education and its impact to the countrys development my internet income role of quality education to economic growth (20)

Economy at work
Economy at workEconomy at work
Economy at work
 
Top of the Class Science
Top of the Class ScienceTop of the Class Science
Top of the Class Science
 
CommonCoreWebinar
CommonCoreWebinarCommonCoreWebinar
CommonCoreWebinar
 
Exploring scholarship and scholarly activity in college-based Higher Education
Exploring scholarship and scholarly activity in college-based Higher EducationExploring scholarship and scholarly activity in college-based Higher Education
Exploring scholarship and scholarly activity in college-based Higher Education
 
Prosperity Through Education Plan
Prosperity Through Education Plan Prosperity Through Education Plan
Prosperity Through Education Plan
 
The Financial Empowerment of Urban Youth
The Financial Empowerment of Urban YouthThe Financial Empowerment of Urban Youth
The Financial Empowerment of Urban Youth
 
Creating a baseline for Corporate CSR Spend on Global Education Initiatives
Creating a baseline for Corporate CSR Spend on Global Education InitiativesCreating a baseline for Corporate CSR Spend on Global Education Initiatives
Creating a baseline for Corporate CSR Spend on Global Education Initiatives
 
Wealth Taking or Wealth Making?: What Does The Evidence Tell Us About Effecti...
Wealth Taking or Wealth Making?:What Does The Evidence Tell Us About Effecti...Wealth Taking or Wealth Making?:What Does The Evidence Tell Us About Effecti...
Wealth Taking or Wealth Making?: What Does The Evidence Tell Us About Effecti...
 
roadmap for ensuring americas future HSI higher ed
roadmap for ensuring americas future HSI higher edroadmap for ensuring americas future HSI higher ed
roadmap for ensuring americas future HSI higher ed
 
What Schools Should Know About Online Learning -- Oct 2010
What Schools Should Know About Online Learning -- Oct 2010What Schools Should Know About Online Learning -- Oct 2010
What Schools Should Know About Online Learning -- Oct 2010
 
Family Business succession in Poland. Study on career paths of next generatio...
Family Business succession in Poland. Study on career paths of next generatio...Family Business succession in Poland. Study on career paths of next generatio...
Family Business succession in Poland. Study on career paths of next generatio...
 
CHANGE Program Outline
CHANGE Program Outline CHANGE Program Outline
CHANGE Program Outline
 
Vibhuti patel economics of eduation
Vibhuti patel economics of eduationVibhuti patel economics of eduation
Vibhuti patel economics of eduation
 
Sheeo strategic priorities_for_hbc_us_teacher_prep
Sheeo strategic priorities_for_hbc_us_teacher_prepSheeo strategic priorities_for_hbc_us_teacher_prep
Sheeo strategic priorities_for_hbc_us_teacher_prep
 
Global Obsession With Rankings Hazelkorn
Global Obsession With Rankings HazelkornGlobal Obsession With Rankings Hazelkorn
Global Obsession With Rankings Hazelkorn
 
BGP_Entrepreneurship-in-Education.pdf
BGP_Entrepreneurship-in-Education.pdfBGP_Entrepreneurship-in-Education.pdf
BGP_Entrepreneurship-in-Education.pdf
 
Building a Culture of Innovation in Higher Education
Building a Culture of Innovation in Higher EducationBuilding a Culture of Innovation in Higher Education
Building a Culture of Innovation in Higher Education
 
O futuro da profissão docente
O futuro da profissão docenteO futuro da profissão docente
O futuro da profissão docente
 
Report Trends in shaping education 2022.pptx
Report Trends in shaping education 2022.pptxReport Trends in shaping education 2022.pptx
Report Trends in shaping education 2022.pptx
 
Aligning-Health-Education
Aligning-Health-EducationAligning-Health-Education
Aligning-Health-Education
 

Kürzlich hochgeladen

ACC 2024 Chronicles. Cardiology. Exam.pdf
ACC 2024 Chronicles. Cardiology. Exam.pdfACC 2024 Chronicles. Cardiology. Exam.pdf
ACC 2024 Chronicles. Cardiology. Exam.pdfSpandanaRallapalli
 
HỌC TỐT TIẾNG ANH 11 THEO CHƯƠNG TRÌNH GLOBAL SUCCESS ĐÁP ÁN CHI TIẾT - CẢ NĂ...
HỌC TỐT TIẾNG ANH 11 THEO CHƯƠNG TRÌNH GLOBAL SUCCESS ĐÁP ÁN CHI TIẾT - CẢ NĂ...HỌC TỐT TIẾNG ANH 11 THEO CHƯƠNG TRÌNH GLOBAL SUCCESS ĐÁP ÁN CHI TIẾT - CẢ NĂ...
HỌC TỐT TIẾNG ANH 11 THEO CHƯƠNG TRÌNH GLOBAL SUCCESS ĐÁP ÁN CHI TIẾT - CẢ NĂ...Nguyen Thanh Tu Collection
 
DATA STRUCTURE AND ALGORITHM for beginners
DATA STRUCTURE AND ALGORITHM for beginnersDATA STRUCTURE AND ALGORITHM for beginners
DATA STRUCTURE AND ALGORITHM for beginnersSabitha Banu
 
Field Attribute Index Feature in Odoo 17
Field Attribute Index Feature in Odoo 17Field Attribute Index Feature in Odoo 17
Field Attribute Index Feature in Odoo 17Celine George
 
Judging the Relevance and worth of ideas part 2.pptx
Judging the Relevance  and worth of ideas part 2.pptxJudging the Relevance  and worth of ideas part 2.pptx
Judging the Relevance and worth of ideas part 2.pptxSherlyMaeNeri
 
Choosing the Right CBSE School A Comprehensive Guide for Parents
Choosing the Right CBSE School A Comprehensive Guide for ParentsChoosing the Right CBSE School A Comprehensive Guide for Parents
Choosing the Right CBSE School A Comprehensive Guide for Parentsnavabharathschool99
 
Like-prefer-love -hate+verb+ing & silent letters & citizenship text.pdf
Like-prefer-love -hate+verb+ing & silent letters & citizenship text.pdfLike-prefer-love -hate+verb+ing & silent letters & citizenship text.pdf
Like-prefer-love -hate+verb+ing & silent letters & citizenship text.pdfMr Bounab Samir
 
Barangay Council for the Protection of Children (BCPC) Orientation.pptx
Barangay Council for the Protection of Children (BCPC) Orientation.pptxBarangay Council for the Protection of Children (BCPC) Orientation.pptx
Barangay Council for the Protection of Children (BCPC) Orientation.pptxCarlos105
 
ENGLISH6-Q4-W3.pptxqurter our high choom
ENGLISH6-Q4-W3.pptxqurter our high choomENGLISH6-Q4-W3.pptxqurter our high choom
ENGLISH6-Q4-W3.pptxqurter our high choomnelietumpap1
 
Keynote by Prof. Wurzer at Nordex about IP-design
Keynote by Prof. Wurzer at Nordex about IP-designKeynote by Prof. Wurzer at Nordex about IP-design
Keynote by Prof. Wurzer at Nordex about IP-designMIPLM
 
Grade 9 Q4-MELC1-Active and Passive Voice.pptx
Grade 9 Q4-MELC1-Active and Passive Voice.pptxGrade 9 Q4-MELC1-Active and Passive Voice.pptx
Grade 9 Q4-MELC1-Active and Passive Voice.pptxChelloAnnAsuncion2
 
INTRODUCTION TO CATHOLIC CHRISTOLOGY.pptx
INTRODUCTION TO CATHOLIC CHRISTOLOGY.pptxINTRODUCTION TO CATHOLIC CHRISTOLOGY.pptx
INTRODUCTION TO CATHOLIC CHRISTOLOGY.pptxHumphrey A Beña
 
Full Stack Web Development Course for Beginners
Full Stack Web Development Course  for BeginnersFull Stack Web Development Course  for Beginners
Full Stack Web Development Course for BeginnersSabitha Banu
 
ECONOMIC CONTEXT - PAPER 1 Q3: NEWSPAPERS.pptx
ECONOMIC CONTEXT - PAPER 1 Q3: NEWSPAPERS.pptxECONOMIC CONTEXT - PAPER 1 Q3: NEWSPAPERS.pptx
ECONOMIC CONTEXT - PAPER 1 Q3: NEWSPAPERS.pptxiammrhaywood
 
How to Add Barcode on PDF Report in Odoo 17
How to Add Barcode on PDF Report in Odoo 17How to Add Barcode on PDF Report in Odoo 17
How to Add Barcode on PDF Report in Odoo 17Celine George
 
Gas measurement O2,Co2,& ph) 04/2024.pptx
Gas measurement O2,Co2,& ph) 04/2024.pptxGas measurement O2,Co2,& ph) 04/2024.pptx
Gas measurement O2,Co2,& ph) 04/2024.pptxDr.Ibrahim Hassaan
 
Influencing policy (training slides from Fast Track Impact)
Influencing policy (training slides from Fast Track Impact)Influencing policy (training slides from Fast Track Impact)
Influencing policy (training slides from Fast Track Impact)Mark Reed
 
AMERICAN LANGUAGE HUB_Level2_Student'sBook_Answerkey.pdf
AMERICAN LANGUAGE HUB_Level2_Student'sBook_Answerkey.pdfAMERICAN LANGUAGE HUB_Level2_Student'sBook_Answerkey.pdf
AMERICAN LANGUAGE HUB_Level2_Student'sBook_Answerkey.pdfphamnguyenenglishnb
 

Kürzlich hochgeladen (20)

ACC 2024 Chronicles. Cardiology. Exam.pdf
ACC 2024 Chronicles. Cardiology. Exam.pdfACC 2024 Chronicles. Cardiology. Exam.pdf
ACC 2024 Chronicles. Cardiology. Exam.pdf
 
HỌC TỐT TIẾNG ANH 11 THEO CHƯƠNG TRÌNH GLOBAL SUCCESS ĐÁP ÁN CHI TIẾT - CẢ NĂ...
HỌC TỐT TIẾNG ANH 11 THEO CHƯƠNG TRÌNH GLOBAL SUCCESS ĐÁP ÁN CHI TIẾT - CẢ NĂ...HỌC TỐT TIẾNG ANH 11 THEO CHƯƠNG TRÌNH GLOBAL SUCCESS ĐÁP ÁN CHI TIẾT - CẢ NĂ...
HỌC TỐT TIẾNG ANH 11 THEO CHƯƠNG TRÌNH GLOBAL SUCCESS ĐÁP ÁN CHI TIẾT - CẢ NĂ...
 
DATA STRUCTURE AND ALGORITHM for beginners
DATA STRUCTURE AND ALGORITHM for beginnersDATA STRUCTURE AND ALGORITHM for beginners
DATA STRUCTURE AND ALGORITHM for beginners
 
Field Attribute Index Feature in Odoo 17
Field Attribute Index Feature in Odoo 17Field Attribute Index Feature in Odoo 17
Field Attribute Index Feature in Odoo 17
 
Judging the Relevance and worth of ideas part 2.pptx
Judging the Relevance  and worth of ideas part 2.pptxJudging the Relevance  and worth of ideas part 2.pptx
Judging the Relevance and worth of ideas part 2.pptx
 
Choosing the Right CBSE School A Comprehensive Guide for Parents
Choosing the Right CBSE School A Comprehensive Guide for ParentsChoosing the Right CBSE School A Comprehensive Guide for Parents
Choosing the Right CBSE School A Comprehensive Guide for Parents
 
Like-prefer-love -hate+verb+ing & silent letters & citizenship text.pdf
Like-prefer-love -hate+verb+ing & silent letters & citizenship text.pdfLike-prefer-love -hate+verb+ing & silent letters & citizenship text.pdf
Like-prefer-love -hate+verb+ing & silent letters & citizenship text.pdf
 
Barangay Council for the Protection of Children (BCPC) Orientation.pptx
Barangay Council for the Protection of Children (BCPC) Orientation.pptxBarangay Council for the Protection of Children (BCPC) Orientation.pptx
Barangay Council for the Protection of Children (BCPC) Orientation.pptx
 
ENGLISH6-Q4-W3.pptxqurter our high choom
ENGLISH6-Q4-W3.pptxqurter our high choomENGLISH6-Q4-W3.pptxqurter our high choom
ENGLISH6-Q4-W3.pptxqurter our high choom
 
Keynote by Prof. Wurzer at Nordex about IP-design
Keynote by Prof. Wurzer at Nordex about IP-designKeynote by Prof. Wurzer at Nordex about IP-design
Keynote by Prof. Wurzer at Nordex about IP-design
 
Grade 9 Q4-MELC1-Active and Passive Voice.pptx
Grade 9 Q4-MELC1-Active and Passive Voice.pptxGrade 9 Q4-MELC1-Active and Passive Voice.pptx
Grade 9 Q4-MELC1-Active and Passive Voice.pptx
 
INTRODUCTION TO CATHOLIC CHRISTOLOGY.pptx
INTRODUCTION TO CATHOLIC CHRISTOLOGY.pptxINTRODUCTION TO CATHOLIC CHRISTOLOGY.pptx
INTRODUCTION TO CATHOLIC CHRISTOLOGY.pptx
 
Full Stack Web Development Course for Beginners
Full Stack Web Development Course  for BeginnersFull Stack Web Development Course  for Beginners
Full Stack Web Development Course for Beginners
 
ECONOMIC CONTEXT - PAPER 1 Q3: NEWSPAPERS.pptx
ECONOMIC CONTEXT - PAPER 1 Q3: NEWSPAPERS.pptxECONOMIC CONTEXT - PAPER 1 Q3: NEWSPAPERS.pptx
ECONOMIC CONTEXT - PAPER 1 Q3: NEWSPAPERS.pptx
 
LEFT_ON_C'N_ PRELIMS_EL_DORADO_2024.pptx
LEFT_ON_C'N_ PRELIMS_EL_DORADO_2024.pptxLEFT_ON_C'N_ PRELIMS_EL_DORADO_2024.pptx
LEFT_ON_C'N_ PRELIMS_EL_DORADO_2024.pptx
 
How to Add Barcode on PDF Report in Odoo 17
How to Add Barcode on PDF Report in Odoo 17How to Add Barcode on PDF Report in Odoo 17
How to Add Barcode on PDF Report in Odoo 17
 
YOUVE GOT EMAIL_FINALS_EL_DORADO_2024.pptx
YOUVE GOT EMAIL_FINALS_EL_DORADO_2024.pptxYOUVE GOT EMAIL_FINALS_EL_DORADO_2024.pptx
YOUVE GOT EMAIL_FINALS_EL_DORADO_2024.pptx
 
Gas measurement O2,Co2,& ph) 04/2024.pptx
Gas measurement O2,Co2,& ph) 04/2024.pptxGas measurement O2,Co2,& ph) 04/2024.pptx
Gas measurement O2,Co2,& ph) 04/2024.pptx
 
Influencing policy (training slides from Fast Track Impact)
Influencing policy (training slides from Fast Track Impact)Influencing policy (training slides from Fast Track Impact)
Influencing policy (training slides from Fast Track Impact)
 
AMERICAN LANGUAGE HUB_Level2_Student'sBook_Answerkey.pdf
AMERICAN LANGUAGE HUB_Level2_Student'sBook_Answerkey.pdfAMERICAN LANGUAGE HUB_Level2_Student'sBook_Answerkey.pdf
AMERICAN LANGUAGE HUB_Level2_Student'sBook_Answerkey.pdf
 

Role of quality education to economic growth- quality education and its impact to the countrys development my internet income role of quality education to economic growth

  • 1. WPS4122 The Role of Education Quality in Economic Growth* Eric A. Hanushek Ludger Wößmann Hoover Institution University of Munich, Stanford University Ifo Institute for Economic Research and CESifo CESifo and NBER Poschingerstr. 5 Stanford, CA 94305-6010, United States 81679 Munich, Germany Phone: (+1) 650 / 736-0942 Phone: (+49) 89 / 9224-1699 E-mail: hanushek@stanford.edu E-mail: woessmann@ifo.de Internet: www.hanushek.net Internet: www.cesifo.de/woessmann Abstract The role of improved schooling, a central part of most development strategies, has become controversial because expansion of school attainment has not guaranteed improved economic conditions. This paper reviews the role of education in promoting economic well-being, with a particular focus on the role of educational quality. It concludes that there is strong evidence that the cognitive skills of the population – rather than mere school attainment – are powerfully related to individual earnings, to the distribution of income, and to economic growth. New empirical results show the importance of both minimal and high level skills, the complementarity of skills and the quality of economic institutions, and the robustness of the relationship between skills and growth. International comparisons incorporating expanded data on cognitive skills reveal much larger skill deficits in developing countries than generally derived from just school enrollment and attainment. The magnitude of change needed makes clear that closing the economic gap with developed countries will require major structural changes in schooling institutions. World Bank Policy Research Working Paper 4122, February 2007 The Policy Research Working Paper Series disseminates the findings of work in progress to encourage the exchange of ideas about development issues. An objective of the series is to get the findings out quickly, even if the presentations are less than fully polished. The papers carry the names of the authors and should be cited accordingly. The findings, interpretations, and conclusions expressed in this paper are entirely those of the authors. They do not necessarily represent the view of the World Bank, its Executive Directors, or the countries they represent. Policy Research Working Papers are available online at http://econ.worldbank.org. * This project developed through conversations with Harry Patrinos, who provided useful comments and suggestions along the way. We have also benefited from comments by Martha Ainsworth, Luis Benveniste, François Bourguignon, Deon Filmer, Paul Gertler, Manny Jimenez, Ruth Kagia, Beth King, Lant Pritchett, and Emiliana Vegas. Support has come from the World Bank, CESifo, the Program on Education Policy and Governance of Harvard University, and the Packard Humanities Institute. Public Disclosure Authorized Public Disclosure Authorized Public Disclosure Authorized Public Disclosure Authorized
  • 2. The Role of School Improvement in Economic Development By Eric A. Hanushek and Ludger Wößmann 1. Introduction ........................................................................................................................................ 1 2. Individual Returns to Education and Economic Inequality........................................................... 5 2.1 Impacts of School Attainment on Individual Incomes.................................................................. 5 2.2 Impacts of Educational Quality on Individual Incomes—Developed Countries.......................... 6 2.3 Impacts of Educational Quality on Individual Incomes—Developing Countries....................... 11 2.4 Evidence from the International Adult Literacy Survey ............................................................. 14 2.5 Causality...................................................................................................................................... 16 2.6 Income Distribution .................................................................................................................... 17 3. Quantity of Schooling and Economic Growth............................................................................... 20 3.1 Results of Initial Cross-country Growth Regressions................................................................. 20 3.2 More Recent Evidence on the Effects of Levels of and Growth in Years of Schooling............. 22 4. Quality of Education and Economic Growth ................................................................................ 25 4.1 A Review of the Basic Results.................................................................................................... 25 4.2 Issues of Endogeneity ................................................................................................................. 29 4.3 Some New Evidence ................................................................................................................... 31 4.4 Distribution of Educational Quality and Economic Growth....................................................... 38 4.5 Institutions, Education and Growth............................................................................................. 40 4.6 The Implications of Improved Quality........................................................................................ 43 Appendix: Data on Quality of Education........................................................................................... 47 5. Where Does the Developing World Stand?.................................................................................... 51 5.1 Lack of Quantity of Schooling.................................................................................................... 51 5.2 Lack of Quality of Education...................................................................................................... 52 5.3 The Size of the Task at Hand: Schooling Quantity and Educational Quality Combined ........... 55 6. Educational Spending and Student Outcomes .............................................................................. 59 6.1 Cross-country Evidence on Resources........................................................................................ 60 6.2 Within-country Evidence – Developed Countries ...................................................................... 63 6.3 Within-country Evidence – Developing Countries ..................................................................... 66 6.4 Is There a Minimum Resource Requirement? ............................................................................ 67 7. Schooling Institutions and Educational Quality............................................................................ 68 7.1 Choice and Competition in Developing Countries ..................................................................... 68 7.2 Evidence on Autonomy of Schools............................................................................................. 70 7.3 School Accountability................................................................................................................. 71 7.4 Summary of How to Improve the Quality of Education ............................................................. 74 8. Conclusion......................................................................................................................................... 76 References.............................................................................................................................................. 80
  • 3. 1 1. Introduction It takes little analysis to see that education levels differ dramatically between developing and developed countries. Building upon several decades of thought about human capital – and centuries of general attention to education in the more advanced countries – it is natural to believe that a productive development strategy would be to raise the schooling levels of the population. And, indeed, this is exactly the approach of the Education for All initiative and a central element of the Millennium Development Goals. But there are also some nagging uncertainties that exist with this strategy. First, developed and developing countries differ in a myriad of ways other than schooling levels. Second, a number of countries – both on their own and with the assistance of others – have expanded schooling opportunities without seeing any dramatic catch-up with developed countries in terms of economic well-being. Third, countries that do not function well in general might not be more able to mount effective education programs than they are to pursue other societal goals. Fourth, even when schooling policy is made a focal point, many of the approaches undertaken do not seem very effective and do not lead to the anticipated student outcomes. In sum, is it obvious that education is the driving force, or merely one of several factors that are correlated with more fundamental development forces? The objective of this study is to review what is known about the role of education in promoting economic well-being. We are interested in assessing what research says about these issues. More than that, we pay particular attention to the credibility of this research in establishing a causal relationship between education and economic outcomes and between policy initiatives and educational outcomes. The discussion also has one distinctive element. We have come to conclude that educational quality – particularly in assessing policies related to developing countries – is THE key issue. It is both conventional and convenient in policy discussions to concentrate on such things as years of school attainment or enrollment rates in schools. These things are readily observed and measured. They appear in administrative data, and they are published on a consistent basis in virtually all countries of the world. And, they are very misleading in the policy debates. We will show in graphic terms the differences in educational quality that exist. Most people would, in casual conversation, acknowledge that a year of schooling in a school in a Brazilian Amazon village was not the same as a year of schooling in a school in Belgium. They would also agree that families, peers, and others contribute to education. Yet, research on the economic impact of schools – largely due to expedience – almost uniformly ignores these. The data suggest that the casual conversation may actually tend to understate the magnitude of differences.
  • 4. We will also provide strong evidence that ignoring quality differences significantly distorts the picture about the relationship between education and economic outcomes. This distortion occurs at three levels. It misses important differences between education and skills on the one hand and individual earnings on the other. It misses an important underlying factor determining the interpersonal distribution of incomes across societies. And, it very significantly misses the important element of education in economic growth. The plan of this study is straightforward. We begin by documenting the importance of cognitive skills – the measure of educational quality we use – in determining individual earnings, and by implication important aspects of the income distribution. We then turn to the relationship of education and economic growth. Research into the economics of growth has itself been a growth area, but much of the research focuses just on school attainment with no consideration of quality differences or of other sources of learning. We show, in part with new evidence, that the evidence is highly biased by its concentration on just quantity of schooling. In both of these areas, attention has been given to causality; i.e., is it reasonable to believe that changing education would directly lead to a change in economic outcomes? Again, the concentration on quantity of schooling has distorted these discussions of causality, and consideration of quality considerably alters the issues and implications. The simple answers in the discussion of economic implications of education are that educational quality, measured by cognitive skills, has a strong impact on individual earnings. More than that, however, educational quality has a strong and robust influence on economic growth. In both areas, there is credible evidence that these are truly causal relationships. To be sure, none of this says that schools per se are the answer. Even though it is common to treat education and schooling synonymously, it is important to distinguish between knowledge and skills on the one hand (educational quality in our terminology) and schooling. This semantic distinction has important substantive underpinnings. Cognitive skills may be developed in formal schooling, but they may also come from the family, the peers, the culture, and so forth. Moreover, other factors obviously have an important impact on earnings and growth. For example, overall economic institutions – a well-defined system of property rights, the openness of the economy, the security of the nation – can be viewed almost as preconditions to economic development. And, without them, education and skills may not have the desired impact on economic outcomes. Yet, while recognizing the impact of these overall institutions, we find that schools can play an important role. Quality schools can lead to improved educational outcomes. Moreover, from a public 2
  • 5. policy perspective, interventions in the schools are generally viewed as both more acceptable and more likely to succeed than, say, direct interventions in the family. Given the evidence on the importance of educational quality for economic outcomes, the study turns to important policy issues. To begin with, what can be said about the educational quality and cognitive skills in developing countries? Although information on enrollment and attainment has been fairly widely available, quality information has not. We use newly developed data on international comparisons of cognitive skills (also employed in the analysis of growth) to show that the education deficits in developing countries are larger than previously appreciated. Discussions of quality inevitably lead to questions about whether it can be affected by policy. An extensive literature, albeit one biased toward developed countries, now exists on a number of policy issues. Perhaps most well known is that simply putting more resources into schools – pure spending, reduced class sizes, increased teacher training, and the like – will not reliably lead to improvements in student outcomes. These findings are, however, often misinterpreted. First, they do not imply that schools have no effect. They say simply that common measures of school quality are in reality not closely related to student outcomes, but this is not the same as finding that school quality differences do not exist. Second, the findings do not say that spending and resources never matter. Indeed, there is some indication, particularly in developing countries, that a range of resources are important – textbooks, rudimentary facilities, and the like. The potential impacts of these are nonetheless too small to be instruments for radical changes in outcomes, something that the prior evidence indicates is needed in many developing countries. Third, the findings do not say that resources cannot matter. They indicate that resources may not have any consistent effects within the current structure and institutions of schools, but the findings do not put resource discussions into the context of alternative structures. One consistent finding that is emerging from research, albeit largely from developed country experiences, is that teacher quality has powerful impacts on student outcomes. The problem from a policy aspect is, however, that quality differences are not closely related to the common measures of quality and to the common policy instruments that are employed. Within countries where the data exist, there is little indication that quality is closely related to teacher education and training, teacher experience, teacher certification, or teacher salaries. These facts disrupt the policy discussions. They also make it clear that different sets of policies must be contemplated if schools are to improve. A different view of schools, however, concentrates on larger institutional issues. There is growing evidence that a number of devices – things that effectively change the existing incentives in schools – have an impact. Accountability systems based upon tests of student cognitive achievement can change 3
  • 6. the incentives for both school personnel and for students. By focusing attention on the true policy goal – instead of imperfect proxies based on inputs to schools – performance can be improved. These systems align rewards with outcomes. Moreover, increased local decision making or local autonomy, coupled with accountability, can facilitate these improvements. The evidence on a set of larger, and potentially more powerful, policy changes is relatively limited at the current time. There is suggestive evidence that greater school choice promotes better performance. Further, direct incentives to teachers and school personnel in the form of performance pay have promise. Unfortunately, however, these policies can lead to substantial changes in the incentives within schools, and such substantial changes are frequently resisted by current school personnel. Current employees, often through their unions, generally tend to resist and to stop even experimentation with such changes. Thus, direct evidence on them is more limited, and may require more inferences. Nonetheless, there remains reason to believe that pursuing these larger changes could lead to the substantial improvements in outcomes that are desired or hoped for in the policy process. 4
  • 7. 2. Individual Returns to Education and Economic Inequality 2.1 Impacts of School Attainment on Individual Incomes Most attention to the value of schooling focuses on the economic returns to differing levels of school attainment for individuals. This work, following the innovative analyses of human capital by Jacob Mincer (1970, 1974), considers how investing in differing amounts of schooling affects individual earnings. Over the past thirty years, literally hundreds of such studies have been conducted around the world.1 These studies have uniformly shown that more schooling is associated with higher individual earnings. The rate of return to schooling across countries is centered at about 10 percent with variations in expected ways based largely on scarcity: returns appear higher for low income countries, for lower levels of schooling, and, frequently, for women (Psacharopoulos and Patrinos (2004)). Much of the academic debate has focused on whether these simple estimates provide credible measures of the causal effect of schooling. In particular, if more able people tend also to obtain additional schooling, the estimated schooling effect could include both the impacts of schooling and the fact that those continuing in school could earn more in the absence of schooling.2 For the most part, employing alternative estimation approaches dealing with the problems of endogeneity of schooling do not lead to large changes in the estimates, and many times they suggest that the returns are actually larger with the alternative estimation schemes than with the simpler modeling strategies. The basic estimates of Mincer earnings models are typically interpreted as the private returns to schooling. As is well known, the social returns could differ from the private returns – and could be either above or below the private returns. The most common argument is that the social returns will exceed the private returns because of the positive effects of education on crime, health, fertility, 1 A variety of studies review and interpret the basic estimation of rates of return. See Psacharopoulos (1994), Card (1999), Harmon, Oosterbeek, and Walker (2003), Psacharopoulos and Patrinos (2004), and Heckman, Lochner, and Todd (2006). 2 Harmon, Oosterbeek, and Walker (2003) systematically review the various issues and analytical approaches dealing with them along with providing a set of consistent estimates of returns (largely for OECD countries). They conclude that, while the estimation approaches can have an impact on the precise value of the rate of return, it is clear that there is a strong causal impact of school attainment on earnings. 5
  • 8. improved citizen participation,3 and (as we discuss below) on growth and productivity of the economy as a whole.4 If on the other hand schooling was more of a selection device than of a means of boosting knowledge and skills of individuals, the social return could be below the private return.5 Although there are many uncertainties about precisely how social returns might differ from private returns, there is overall little reason to believe that the social returns are less than the private returns, and there are a variety of reasons to believe that they could be noticeably higher. 2.2 Impacts of Educational Quality on Individual Incomes—Developed Countries The concentration on school attainment in the academic literature, however, contrasts with much of the policy discussion that, even in the poorest areas, involves elements of “quality” of schooling. Most countries are involved in policy debates about the improvement of their schools. These debates, often phrased in terms of such things as teacher salaries or class sizes, rest on a presumption that there is a high rate of return to schools in general and to quality in particular. But it is not appropriate simply to presume that any spending on schools is a productive investment that will see the returns estimated for attainment. It is instead necessary to ascertain two things: how various investments translate into quality and how that quality relates to economic returns. This section provides a summary of what is known about the individual returns to educational quality in both developed and developing countries. One of the challenges to understanding the impact of quality differences in human capital has been simply knowing how to measure quality. Much of the discussion of quality—in part related to new efforts to provide better accountability—has identified cognitive skills as the important dimension. 3 Recent studies indeed find evidence of externalities of education in such areas as reduced crime (Lochner and Moretti (2004)), improved health of children (Currie and Moretti (2003)), and improved civic participation (Dee (2004); Milligan, Moretti, and Oreopoulos (2004)). The evidence on direct production spillovers of education among workers is more mixed, with Moretti (2004) and the studies cited therein finding favorable evidence and Acemoglu and Angrist (2000) and Ciccone and Peri (2006) finding no evidence for this kind of spillovers. 4 In the Mincer earnings work, social rates of return are frequently calculated. These calculations are not based on the positive externalities cited but instead on the fact that the social cost of subsidized education exceeds the private costs – thus lowering the social rate of return relative to the private rate of return (see Psacharopoulos and Patrinos (2004)). 5 The empirical analysis of these issues has been very difficult because the labor market outcomes of the screening/selection model and the productivity/human capital model are very similar if not identical. Lange and Topel (2006) review the theory and empirical work and conclude that there is little evidence that the social rate of return to schooling is below the private rate of return. 6
  • 9. And, while there is ongoing debate about the testing and measurement of these skills, most parents and policy makers alike accept the notion that cognitive skills are a key dimension of schooling outcomes. The question is whether this proxy for school quality—students’ performance on standardized tests—is correlated with individuals’ performance in the labor market and the economy’s ability to grow. Until fairly recently, little comprehensive data have been available to show any relationship between differences in cognitive skills and any related economic outcomes. The many analyses of school attainment and Mincer earnings functions rely upon readily available data from censuses and other surveys, which find it easy to collect information on earnings, school attainment, age, and other demographic information. On the other hand, it is difficult to obtain data on cognitive skills along with earnings and the other determinants of wages. Although cognitive test and school resource data are increasingly available at the time of schooling, these are seldom linked to subsequent labor market information. Such analyses generally require tracking individuals over time, a much more difficult data collection scheme. Such data are, however, now becoming available. A variety of researchers are now able to document that the earnings advantages to higher achievement on standardized tests are quite substantial.6 While these analyses emphasize different aspects of individual earnings, they typically find that measured achievement has a clear impact on earnings after allowing for differences in the quantity of schooling, the experiences of workers, and other factors that might also influence earnings. In other words, higher quality as measured by tests similar to those currently being used in accountability systems around the world is closely related to individual productivity and earnings. Three recent U.S. studies provide direct and quite consistent estimates of the impact of test performance on earnings (Mulligan (1999); Murnane, Willett, Duhaldeborde, and Tyler (2000); Lazear (2003)). These studies employ different nationally representative data sets that follow students after they leave school and enter the labor force. When scores are standardized, they suggest that one 6 These results are derived from different specific approaches, but the basic underlying analysis involves estimating a standard “Mincer” earnings function and adding a measure of individual cognitive skills. This approach relates the logarithm of earnings to years of schooling, experience, and other factors that might yield individual earnings differences. The clearest analyses are found in the following references for the U.S. (which are analyzed in Hanushek (2002b)). See Bishop (1989, 1991); O'Neill (1990); Grogger and Eide (1993); Blackburn and Neumark (1993, 1995); Murnane, Willett, and Levy (1995); Neal and Johnson (1996); Mulligan (1999); Murnane, Willett, Duhaldeborde, and Tyler (2000); Altonji and Pierret (2001); Murnane, Willett, Braatz, and Duhaldeborde (2001); and Lazear (2003). 7
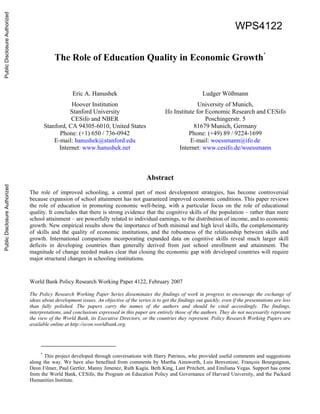
  • 10. standard deviation increase in mathematics performance at the end of high schools translates into 12 percent higher annual earnings.7 Murnane, Willett, Duhaldeborde, and Tyler (2000) provide evidence from the High School and Beyond and the National Longitudinal Survey of the High School Class of 1972. Their estimates suggest some variation with males obtaining a 15 percent increase and females a 10 percent increase per standard deviation of test performance. Lazear (2003), relying on a somewhat younger sample from NELS88, provides a single estimate of 12 percent. These estimates are also very close to those in Mulligan (1999), who finds 11 percent for the normalized AFQT score in the NLSY data.8 Note that these returns can be thought of as how much earnings would increase with higher quality each and every year throughout the persons’ working career. Thus, the present value of the returns to higher quality is large. These estimates are obtained fairly early in the work career (mid-20s to early 30s), and analyses of the impact of cognitive skills across the entire work life are more limited. Altonji and Pierret (2001) find that the impact of achievement on earnings grows with experience, because the employer has a chance to observe the performance of workers. The pattern of how returns change with age from their analysis is shown in Figure 2.1, where the power of school attainment differences to predict differences in earnings is replaced by cognitive skills as workers are in the labor force longer. The evidence is consistent with employers relying on readily available information on school attainment when they do not have other information and switching to observations of skills and performance as that information becomes available through job performance.9 On the other hand, Hanushek and Zhang (2006) do not find that this pattern holds for a wider set of countries (although it continues to hold for the United 7 Because the units of measurement differ across tests, it is convenient to convert test scores into measures of the distribution of achievement across the population. A one-half standard deviation change would move somebody from the middle of the distribution (the 50th percentile) to the 69th percentile; a one standard deviation change would move this person to the 84th percentile. Because tests tend to follow a bell-shaped distribution, the percentile movements are largest at the center of the distribution. 8 By way of comparison, we noted that estimates of the value of an additional year of school attainment are typically about 10 percent. Of course, any investment decisions must recognize that quality and quantity are generally produced together and that costs of changing each must be taken into account. 9 Note that Altonji and Pierret (2001) observe a limited age range, so that these changing returns may well be thought of as leveling off after some amount of labor market experience. 8
  • 11. States in their data). Thus, there is some uncertainty currently about whether cognitive skills have differential effects on economic outcomes over the work-experience profile.10 Figure 2.1: Returns to Observed Educational Quantity and Unobserved Educational Quality 1 year of education 1 SD of academic achievement (AFQT) 9 over the Work Life 14% 12% 10% 8% 6% 4% 2% 0% 0 1 2 3 4 5 6 7 8 9 10 11 12 13 Work experience (years) Increase in earning Notes: Based on data from National Longitudinal Survey of Youth (NLSY) and Armed Forces Qualification Test (AFQT). SD = standard deviation. Source: Based on Altonji and Pierret (2001). There are other reasons to believe that these estimates provide a lower bound on the impact of higher achievement. First, the labor market experiences that are observed begin in the mid-1980s and extend into the mid-1990s, but other evidence suggests that the value of skills and of schooling has grown throughout and past that period. Second, extrapolating from recent patterns, future general improvements in productivity are likely to lead to larger returns to skill.11 Finally, cognitive skills 10Hanushek and Zhang (2006), discussed below, do find that the importance of cognitive skills is not restricted just to younger workers (represented in most prior research) but holds across the experience spectrum. 11 The considered analyses typically compare workers of different ages at one point in time to obtain an estimate of how earnings will change for any individual. If, however, productivity improvements occur in the economy, these will tend to raise the earnings of individuals over time. If recent patterns of skill bias in productivity improvement continue, the
  • 12. measured by test scores are prone to considerable measurement error. Even if the tests were measuring exactly the relevant skill concept, we know that there are substantial errors in each test.12 These errors will in general lead to downward biases in the estimated coefficients. A limited number of additional studies are available for developed countries outside of the United States. McIntosh and Vignoles (2001) study wages in the United Kingdom and find strong returns to both numeracy and literacy.13 Finnie and Meng (2002) and Green and Riddell (2003) investigate returns to cognitive skills in Canada. Both suggest that literacy has a significant return, but Finnie and Meng (2002) find an insignificant return to numeracy. This latter finding stands at odds with most other analyses that have emphasized numeracy or math skills. Another part of the return to school quality comes through continuation in school.14 There is substantial U.S. evidence that students who do better in school, either through grades or scores on standardized achievement tests, tend to go farther in school.15 Murnane, Willett, Duhaldeborde, and impact of improvements in student skills are likely to rise over the work life instead of being constant as portrayed here (cf. Katz and Murphy (1992)). On the other hand, such skill-biased change has not always been the case, and technology could push returns in the opposite direction. 12 In most testing situations, both the reliability of the specific test and the validity of the test are considered. Reliability relates to how well the test measures the specific material – and would include elements of specific question development and choice along with individual variations that would occur if an individual took the same test at different points in time. Validity refers to the correspondence between the desired concept (skills related to productivity or earnings differences) and the specific choice of test domains (such as mathematical concepts at some specific level). 13 Because they look at discrete levels of skills, it is difficult to compare the quantitative magnitudes directly to the 10 U.S. work. 14 As noted above, much of the work by economists on differences in worker skills has actually been directed at the issue of determining the average labor market returns to additional schooling. The argument has been that higher-ability students are more likely to continue in schooling. Therefore, part of the higher earnings observed for those with additional schooling really reflects pay for added ability and not for the additional schooling. Economists have pursued a variety of analytical approaches for dealing with this, including adjusting for measured cognitive test scores, but this work generally ignores issues of variation in school quality. The various adjustments for ability differences typically make small differences on the estimates of the value of schooling, and Heckman and Vytlacil (2001) argue that it is not possible to separate the effects of ability and schooling. The only explicit consideration of school quality typically investigates expenditure and resource differences across schools, but these are known to be poor measures of school quality differences (Hanushek (2002b)). 15 See, for example, Dugan (1976); Manski and Wise (1983). Rivkin (1995) finds that variations in test scores capture a considerable proportion of the systematic variation in high school completion and in college continuation, so that test score differences can fully explain black-white differences in schooling. Bishop (1991) and Hanushek, Rivkin, and Taylor
  • 13. Tyler (2000) separate the direct returns to measured skill from the indirect returns of more schooling and suggest that perhaps one-third to one-half of the full return to higher achievement comes from further schooling. Note also that the effect of quality improvements on school attainment incorporates concerns about drop out rates. Specifically, higher student achievement keeps students in school longer, which will lead among other things to higher graduation rates at all levels of schooling.16 Knighton and Bussière (2006) find that higher scores at age 15 lead to significantly higher rates of post-secondary schooling of Canadian 19-year-olds. This finding is particularly interesting for the international comparisons that we consider below, because the analysis follows up on precisely the international testing that is used in our analysis of economic growth.17 2.3 Impacts of Educational Quality on Individual Incomes—Developing Countries Questions remain about whether the clear impacts of quality in the U.S. generalize to other countries, particularly developing countries. The literature on returns to cognitive skills in developing countries is restricted to a relatively limited number of countries: Ghana, Kenya, Morocco, Pakistan, South Africa, and Tanzania. Moreover, a number of studies actually employ the same basic data, albeit with different analytical approaches, but come up with somewhat different results. Table 2.1 provides a simple summary of the quantitative estimates available for developing countries. (1996), in considering the factors that influence school attainment, find that individual achievement scores are highly correlated with continued school attendance. Neal and Johnson (1996) in part use the impact of achievement differences of blacks and whites on school attainment to explain racial differences in incomes. Their point estimates of the impact of cognitive skills (AFQT) on earnings and school attendance appear to be roughly comparable to that found in Murnane, Willett, Duhaldeborde, and Tyler (2000). Behrman, Kletzer, McPherson, and Schapiro (1998) find strong achievement effects on both continuation into college and quality of college; moreover, the effects are larger when proper account is taken of the various determinants of achievement. Hanushek and Pace (1995) find that college completion is significantly related to higher test scores at the end of high school. 16 This work has not, however, investigated how achievement affects the ultimate outcomes of additional schooling. For example, if over time lower-achieving students tend increasingly to attend further schooling, these schools may be forced to offer more remedial courses, and the variation of what students know and can do at the end of school may expand commensurately. 17 The OECD tested random samples of 15-year-old students across participating countries under the PISA program in 2000. Students taking these tests in Canada were then followed and surveyed in 2002 and 2004. See Section 4, below. 11
  • 14. Table 2.1: Summary of Estimated Returns to a Standard Deviation Increase in Cognitive Skills Country Study Estimated effecta Notes Ghana Glewwe (1996) 0.21**-0.3** (government) 12 0.14-0.17 (private) Alternative estimation approaches yield some differences; math effects shown generally more important than reading effects, and all hold even with Raven’s test for ability. Ghana Jolliffe (1998) 0.05-0.07* Household income related to average math score with relatively small variation by estimation approach; effect is only observed with off-farm income, and on-farm income is not significantly related to cognitive skills. Ghana Vijverberg (1999) ? Income estimates for math and reading with nonfarm self-employment; highly variable estimates (including both positive and negative effects) but effects not generally statistically significant. Kenya Boissiere, Knight, and Sabot (1985); Knight and Sabot (1990) 0.19**-0.22** Total sample estimates: small variation by primary and secondary school leavers. Morocco Angrist and Lavy (1997) ? Cannot convert to standardized scores because use indexes of performance; French writing skills appear most important for earnings, but results depend on estimation approach. Pakistan Alderman, Behrman, Ross, and Sabot (1996) 0.12-0.28* Variation by alternative approaches and by controls for ability and health; larger and more significant without ability and health controls. Pakistan Behrman, Ross, and Sabot (forthcoming) 0.25 Estimates of structural model with combined scores for cognitive skill; significant effects of combined math and reading scores which are instrumented by school inputs South Africa Moll (1998) 0.34**-0.48** Depending on estimation method, varying impact of computation; comprehension (not shown) generally insignificant. Tanzania Boissiere, Knight, and Sabot (1985); Knight and Sabot (1990) 0.07-0.13* Total sample estimates: smaller for primary than secondary school leavers. *significant at 0.05 level; **significant at 0.01 level. a. Estimates indicate proportional increase in wages from a one standard deviation increase in measured test scores.
  • 15. The summary of the evidence in Table 2.1 permits a tentative conclusion that the returns to quality may be even larger in developing countries than in developed countries. This of course would be consistent with the range of estimates for returns to quantity of schooling (e.g,., Psacharopoulos (1994) and Psacharopoulos and Patrinos (2004)), which are frequently interpreted as indicating diminishing marginal returns to schooling. There are some reasons for caution in interpreting the precise magnitude of estimates. First, the estimates appear to be quite sensitive to the estimation methodology itself. Both within individual studies and across studies using the same basic data, the results are quite sensitive to the techniques employed in uncovering the fundamental parameter for cognitive skills.18 Second, the evidence on variations within developing countries is not entirely clear. For example, Jolliffe (1998) finds little impact of skills on farm income, while Behrman, Ross, and Sabot (forthcoming) suggest an equivalence across sectors at least on theoretical grounds. Nonetheless, the overall summary is that the available estimates of the impact of cognitive skills on outcomes suggest strong economic returns within developing countries. The substantial magnitude of the typical estimates indicates that educational quality concerns are very real for developing countries and that this aspect of schools simply cannot be ignored – a topic that comes up below. Evidence also suggests that educational quality is directly related to school attainment. In Brazil, a country plagued by high rates of grade repetition and ultimate school dropouts, Harbison and Hanushek (1992) show that higher cognitive skills in primary school lead to lower repetition rates. Further, Hanushek, Lavy, and Hitomi (2006) find that lower quality schools, measured by lower value-added to cognitive achievement, lead to higher dropout rates in Egyptian primary schools. Thus, as found for developed countries, the full economic impact of higher educational quality comes in part through greater school attainment. This complementarity of school quality and attainment also means that actions that actually improve quality of schools will yield a bonus in terms of meeting goals for attainment. Conversely, simply attempting to expand access and attainment, say through starting a large number of low quality schools, will be self-defeating to the extent that there is a direct reaction to the low quality that affects the actual attainment results. 18 The sensitivity to estimation approach is not always the case; see, for example, Jolliffe (1998). A critique and interpretation of the alternative approaches within a number of these studies can be found in Glewwe (2002). 13
  • 16. 2.4 Evidence from the International Adult Literacy Survey The preceding analyses for both developed and developing countries rely largely on panel data that follow individuals from school into the labor market. The alternative approach as found in the International Adult Literacy Survey (IALS) is to test a sample of adults and then to relate these measures to labor market experiences.19 An advantage of this data collection approach is that it provides information about the labor market experiences across a broader range of age and labor market experience.20 Consistent data on basic skills of literacy and numeracy for a representative sample of the population aged 15-65 were collected for a sample of countries between 1994 and 1998.21 These data permit direct comparisons of the relative importance of quantity and quality of schooling across countries, although the bias toward developed economies remains. Hanushek and Zhang (2006) estimate returns to school attainment and to literacy scores for the 13 countries where continuous measures of individual earnings are available.22 Figures 2.2 and 2.3 provide the relevant summary information on the returns to skills, estimated in a model that jointly includes school attainment and literacy scores. As in the prior analyses, both school attainment and cognitive skills enter into the determination of individual incomes. With the exception of Poland, literacy scores have a consistent positive impact on earnings (Figure 2.2). The (unweighted) average of the impact of literacy scores is 0.093, only slightly less than found previously for the U.S. 19 This design was subsequently repeated in 2003 with the Adult Literacy and Lifeskills Survey (ALL), but only six countries participated, and the data were unavailable for this study. 20 This approach does also present some complications, because the individuals of different ages have both different adult learning experiences and different times of attending school of possibly different quality. Hanushek and Zhang (2006) consider these alternatives, but they do not change the qualitative results about the impact of cognitive skills that are presented here. 21 Twenty-three countries and regions participated in one of three different waves of surveys conducted in 1994, 1996 and 1998. Country participation included some sub-country divisions (e.g., Flemish speaking Belgium and Italian speaking Switzerland). Not all countries provided background information and wage information. IALS provides information on the skills and attitudes of adults aged 16-65 in a number of different areas, and the analysis here combines the scores in a single measure of literacy. 22 Samples include full-time workers between 26 and 65 years of age. In all the models, the dependent variable is the logarithm of annual earnings from employment; control variables are gender, potential experience and its square, and an indicator for living in rural area. 14
  • 17. studies.23 On the other hand, the estimated impact of school attainment across the 13 countries is just 0.049 after adjusting the Mincer returns for the literacy scores. This low estimate partly reflects the joint consideration of literacy scores and school attainment. The estimated return to years of schooling without considering literacy scores is 0.06, which is still below the more common estimates of about 0.1. As Figure 2.3 shows, the estimates that adjust for literacy scores are below the unadjusted returns in every country except Poland. Figure 2.2: Returns to Cognitive Skills, International Adult Literacy Survey Norway Hungary 15 0.3 0.25 0.2 0.15 0.1 0.05 0 USA Switzerland Chile Netherlands Finland Germany Sweden Czech Rep Denmark Italy Poland Increase per stnd. dev. Source: Hanushek and Zhang (2006). 23 The U.S. is noticeably higher than other countries and the previous U.S. studies, perhaps reflecting that these earnings are obtained across the entire work life. The average excluding the U.S. is still 0.08.
  • 18. Figure 2.3: Returns to School Attainment, International Adult Literacy Survey 16 0.12 0.1 0.08 0.06 0.04 0.02 0 USA Hungary Czech Rep Chile Poland Italy Denmark Finland Germany Netherlands Norway Switzerland Sweden Mincer returns Adjusted Mincer returns Source: Hanushek and Zhang (2006). The literacy tests in IALS are designed to measure quite basic skills only, and yet the differences are strongly associated with higher earnings. These results, from a broad age spectrum across a number of countries, reinforce the importance of quality. The sample of countries for the IALS unfortunately contains just one developing country – Chile. Nonetheless, it is suggestive that the returns both to quantity of schooling and quality exceed those found across the countries with the exception of the United States. In the three transition economies (Czech Republic, Hungary, and Poland), the returns to school attainment are also near the top of the sample, but the returns to educational quality are noticeably lower – perhaps reflecting institutional aspects of their labor markets. 2.5 Causality The focus on causality of estimated returns to school attainment has not been duplicated for the estimated impacts of cognitive skills. The potential problems are, however, considerably different. The tests, with the exception of the IALS sampling, are uniformly given at a date before the labor market
  • 19. experiences – eliminating the possibility that higher income leads individuals to do things that raise their test scores.24 Nevertheless, this fact alone does not solve all of the interpretative issues. For our analysis, the most important issue is the source of any test score differences. It is natural to believe that schools have an influence on tests, but clearly other factors also enter. The extensive investigations of the determinants of achievement differences indicate that parents, peers, neighborhoods, and other factors enter along with school factors in determining achievement (see Hanushek (2002b)). Thus, most importantly, it is inappropriate to interpret test scores as simply reflecting school quality or school policy. We return to a discussion of possible school policies below, but at this point it is sufficient to note that skills – however formed – have a systematic impact on earnings. Thus, if we can find approaches that increase skills reliably, the available evidence strongly indicates that individual earnings and productivity will also increase.25 The other side of this issue is also important, however. Using just quantity of schooling in the earnings analyses assumes that formal schooling is the only source of skill development. But, if a variety of other inputs such as families or peers is also important in the formation of human capital, simple years of schooling is subject to this additional source of systematic measurement error. 17 2.6 Income Distribution One implication of the impact of cognitive skills on individual earnings is that the distribution of those skills in the economy will have a direct effect on the distribution of income. Cognitive skills by themselves do not of course determine the full distribution, because other factors such as labor market institutions, taxes, and the like enter. But the importance of skills is becoming increasingly evident. Very suggestive evidence on the impact of skills on the income distribution comes from Nickell (2004). Nickell, using the IALS data, considers how differences in the distribution of incomes across countries are affected by the distribution of skills and by institutional factors including unionization and 24 The IALS sampling raises the concern that tests change with age, because of continual learning or simple age depreciation of skills and knowledge. An investigation of this by Hanushek and Zhang (2006) suggests that these are not large concerns in the estimation of the earnings functions. 25 There could be other things that simultaneously affect both scores and earnings, such that scores are simply a proxy for some other important factor. Available evidence gives no reason to suspect that such factors are important.
  • 20. minimum wages. While union coverage is statistically significant, he concludes that “the bulk of the variation in earnings dispersion is generated by skill dispersion” (page C11).26 The impact of the skill distribution across countries is shown dramatically in Figure 2.4, which is derived from a comparison of the dispersion of wages and the dispersion of prose literacy scores (each measured as the ratio of the 90th to the 10th percentile). The tight pattern around the regression line reflects a simple correlation of 0.85 (which is not affected by including the other institutional factors). Figure 2.4: Inequality of Educational Quality and Earnings IRE 18 Earnings 4.5 inequality 4.0 3.5 3.0 2.5 2.0 1.5 FIN GER NET 1.3 1.5 1.7 1.9 Test score inequality DEN USA CAN UK SWI AUS BEL SWE NOR Note: Measure of inequality is the ratio of ninth decile to first decile in both cases; test performance refers to prose literacy in the International Adult Literacy Survey. Source: Nickell (2004). 26 De Gregorio and Lee (2002) find a (somewhat weaker) positive association between inequality in years of schooling and income inequality.
  • 21. Other studies have also concluded that skills have an increasing impact on the distribution of income (e.g., Juhn, Murphy, and Pierce (1993)). In the U.S., the distribution of incomes within schooling groups has been rising (Levy and Murnane (1992)), i.e., holding constant schooling attainment, the income distribution has become more dispersed in reflection of growing rewards to individual skills. Again, these studies do not attempt to describe the causal structure, and it would be inappropriate to attribute the variance in earnings simply to differences in the quantity or quality of schooling. Nonetheless, to the extent that these contribute to variations in cognitive skills, it is fair to conclude that policies aimed at improving school quality (and educational outcomes) will have direct impacts on the income distribution. 19
  • 22. 3. Quantity of Schooling and Economic Growth Given the microeconomic evidence of the productivity-enhancing effects of education, it seems natural to extend the view to the macroeconomic perspective of long-run economic growth of countries. From a theoretical viewpoint, there are at least three mechanisms through which education may affect economic growth. First, just as in the micro perspective, education increases the human capital inherent in the labor force, which increases labor productivity and thus transitional growth towards a higher equilibrium level of output (as in augmented neoclassical growth theories, cf. Mankiw, Romer, and Weil (1992)). Second, education may increase the innovative capacity of the economy, and the new knowledge on new technologies, products and processes promotes growth (as in theories of endogenous growth, cf., e.g., Lucas (1988); Romer (1990a); Aghion and Howitt (1998)). Third, education may facilitate the diffusion and transmission of knowledge needed to understand and process new information and to successfully implement new technologies devised by others, which again promotes economic growth (cf., e.g., Nelson and Phelps (1966); Benhabib and Spiegel (2005)). 3.1 Results of Initial Cross-country Growth Regressions Just as in the literature on microeconomic returns to education, the majority of the macroeconomic literature on economic growth that tries to test these predictions employs the quantitative measure of years of schooling, now averaged across the labor force.27 Early studies used adult literacy rates (e.g., Azariadis and Drazen (1990); Romer (1990b)) or school enrollment ratios (e.g., Barro (1991); Mankiw, Romer, and Weil (1992); Levine and Renelt (1992)) as proxies for the human capital of an economy. These were followed by attempts to measure average years of schooling based on perpetual inventory methods (cf. Lau, Jamison, and Louat (1991); Nehru, Swanson, and Dubey (1995)).28 Then, it was particularly the work by Barro and Lee (1993, 2001) which provided internationally comparable data on average years of schooling for a large sample of countries and years, based on a combination of census or survey data on educational attainment wherever possible, using literacy and enrollment data to fill gaps in the census data. 27 More precisely, the most commonly used measure is average years of schooling in the working-age population, usually defined as the population aged 15 years and over, instead of the actual labor force. 28 For a survey of measurement and specification issues from early growth accounting to current cross-country growth 20 regressions, see Wößmann (2003b).
  • 23. Using average years of schooling as the education measure implicitly assumes that a year of schooling delivers the same increase in knowledge and skills regardless of the education system. For example, a year of schooling in Papua New Guinea is assumed to create the same increase in productive human capital as a year of schooling in Japan. Additionally, this measure assumes that formal schooling is the primary (sole) source of education and, again, that variations in the quality of nonschool factors have a negligible effect on education outcomes. This neglect of cross-country differences in the quality of education is probably the major drawback of such a quantitative measure of schooling, and we will come back to this issue in great detail below. The standard method to estimate the effect of education on economic growth is to estimate cross-country growth regressions where countries’ average annual growth in gross domestic product (GDP) per capita over several decades is expressed as a function of measures of schooling and a set of other variables deemed to be important for economic growth. Following the classical contributions by Barro (1991, 1997) and Mankiw, Romer, and Weil (1992),29 a vast early literature of cross-country growth regressions has tended to find a significant positive association between quantitative measures of schooling and economic growth (for extensive reviews of the literature, see, e.g., Topel (1999); Temple (2001); Krueger and Lindahl (2001); Sianesi and Van Reenen (2003)).30 To give an idea of the robustness of this association, in the recent extensive robustness analysis by Sala-i-Martin, Doppelhofer, and Miller (2004) of 67 explanatory variables in growth regressions on a sample of 88 countries, primary schooling turns out to be the most robust influence factor (after an East Asian dummy) on growth in GDP per capita in 1960-1996. Because this literature has been extensively reviewed elsewhere (see references above), rather than going into the details of the numerous important contributions, we will focus on a few important issues that emerge in the literature. 29 Temple and Wößmann (2006) show that the significantly positive effect of education that Mankiw, Romer, and Weil (1992) find does not depend on their often criticized use of an education flow measure based on enrollment rates, but can be replicated when using years of schooling as a measure of the level of human capital in their model. 30 A closely related literature weights years of schooling by parameters from microeconomic Mincer earnings equations (see Section 2.1 above) to construct a measure of the stock of human capital, which is then used in growth accounting and development accounting exercises. These use a given macroeconomic production function together with parameter estimates from other research to calculate the share of cross-country differences in growth or levels of income which can be accounted for by cross-country differences in education (see Klenow and Rodriquez-Clare (1997) and Hall and Jones (1999) for examples). 21
  • 24. 3.2 More Recent Evidence on the Effects of Levels of and Growth in Years of Schooling To provide a basic representation of the association between years of schooling and economic growth on the most recent version of available data, we use a slightly extended version31 of the education data by Cohen and Soto (2001), representing the average years of schooling of the population aged 15 to 64, together with data on real GDP per capita in 1960-2000 from the latest update (version 6.1) of the Penn World Tables by Heston, Summers, and Aten (2002).32 Figure 3.1 plots the average annual rate of growth in GDP per capita over the 40-year period against years of schooling at the beginning of the period for a sample of 92 countries. Both growth and education are expressed conditional on the initial level of output, to account for the significant conditional convergence effect.33 The regression results depicted by Figure 3.1 imply that each year of schooling is statistically significantly associated with a long-run growth rate that is 0.58 percentage points higher.34 The positive association is substantially larger in the sample of non-OECD countries (at 0.56) than in the sample of OECD countries (at 0.26), which is in line with the pattern of larger returns to education in developing countries discussed above.35 However, after controlling for the influence of openness and the security of property rights, the association becomes substantially smaller and turns insignificant, and it is close to zero when the total fertility rate is controlled for. Thus, while there is a clear positive association between years of schooling and growth in the latest available data, it is also somewhat sensitive to model specifications. 31 See Jamison, Jamison, and Hanushek (forthcoming) for details of the extension. 32 As discussed below, one line of investigation has been the impact of mismeasurement of the quantity of education on growth. The Cohen and Soto (2001) data improve upon the original quantity data by Barro and Lee. 33 Added-variable plots show the association between two variables after the influences of other control variables are taken out. Thus, both of the two variables are first regressed on the other controls (in this case, initial GDP). Only the residual of these regressions, which is the part of the variation in the two variables which cannot be accounted for by the controls, is used in the graph. In so doing, the graph makes sure that the depicted association between the two variables is not driven by the control variables. The procedure is numerically equivalent to including the other controls in a multivariate regression of the dependent variable (growth) on the independent variable under consideration in the graph. 34 The association is somewhat lower (at 0.32), but still significant when regional dummies are added to the regression. 35 Similarly, the association is larger in the sample of countries below the median of initial output than above the 22 median.
  • 25. Figure 3.1: Added-variable Plot of Growth and Years of Schooling without Test-score Controls Notes: Added-variable plot of a regression of the average annual rate of growth (in percent) of real GDP per capita in 1960- 2000 on average years of schooling in 1960 and the initial level of real GDP per capita in 1960. Own calculations. A considerable controversy has emerged in the literature about whether it is the level of years of schooling (as would be predicted by several models of endogenous growth) or the change in years of schooling (as would be predicted in basic neoclassical frameworks) which is the more important driver of economic growth. The early evidence, such as in Benhabib and Spiegel (1994) and discussed in Barro and Sala-i-Martin (2004), found a positive effect of educational levels, but not of changes in education. However, Temple (1999) shows that in the latter case, an existing positive association was hidden by a few unrepresentative outlying observations. Considerable evidence has also emerged that there was substantial measurement error in the education data (cf. Krueger and Lindahl (2001)), and it is well known that measurement error affects results based on changes in variables even more than results based on their levels. Subsequent evidence suggests that both levels of and changes in years of schooling may show a positive association with growth (cf. Gemmell (1996); Topel (1999); Krueger and Lindahl (2001)). More recently, two studies have tried to overcome some problems of mismeasurement in the early Barro-Lee data on years of schooling: de la Fuente and Doménech (2001, 2006) for the sample of OECD countries and Cohen and Soto (2001) for a broader sample of countries (and the data that we use 23
  • 26. here). Both studies find robust evidence of a positive association between changes in education and economic growth. Even more recently, Ciccone and Papaioannou (2005) find strong support for both the human capital level and the human capital accumulation effects using cross-country industry-level data that allow them to control for country-specific and industry-specific effects. When we add the change in years of schooling over 1960-2000 to the specification depicted in Figure 3.1 and similar specifications, it never turns significant with the sole exception of the sample of 23 OECD countries.36 (Because of the possibly substantial amount of mismeasurement in the education data, though, the results on the first-differenced data on changes in education may well suffer). Thus, while recent research tends to find a positive effect of schooling quantity on economic growth, it seems beyond the scope of current data to draw strong conclusions about the relative importance of different mechanisms by which schooling quantity may affect economic growth. However, several recent studies suggest that education is important both as an investment in human capital and in facilitating research and development and the diffusion of technologies. With respect to the relative importance of the latter two mechanisms, Vandenbussche, Aghion, and Meghir (2006) suggest that innovation is more important relative to imitation for countries close to the technological frontier. As a consequence, the composition of human capital between basic and higher education may be important, with initial phases of education being more important for imitation and higher education being more important for innovation. Vandenbussche, Aghion, and Meghir (2006) provide evidence from a panel of OECD countries in line with this argument, which – when applied to developing countries – might suggest that a focus on basic skills seems warranted for developing countries. We will come back to the issue of the relative importance of basic versus advanced skills in more detail in Section 4.4 below. Two more skeptical studies raise noteworthy caveats, and we will return to each of them below. First, Bils and Klenow (2000) raise the issue of causality, suggesting that reverse causation running from higher economic growth to additional education may be at least as important as the causal effect of education on growth in the cross-country association. We will address the issue of causality in cross-country regressions in Section 4.2 below. Second, one of the conclusions that Pritchett (2001, 2006) draws from the fragility of the evidence linking changes in education to economic growth is that it is important for economic growth to get other things right as well, in particular the institutional framework of the economy. We will address this issue in Section 4.4 below. 36 The positive association between growth in education and economic growth in the OECD sample is sensitive to the 24 inclusion of Korea, though.
  • 27. 4. Quality of Education and Economic Growth 4.1 A Review of the Basic Results The most important caveat with the literature on education and growth reviewed in the preceding section, though, is that it sticks to years of schooling as its measure of education at the neglect of qualitative differences in ensuing knowledge. As discussed in the section on individual returns to education, this neglect probably misses the core of what education is all about. And this neglect seems even more severe in cross-country comparisons than in analyses within countries: Who would sensibly assume that the average student in a school in Ghana or Peru would gain the same amount of knowledge in any year of schooling as the average student in a school in Finland or Korea? Still, using the quantitative measure of years of schooling does exactly that. It seems beyond doubt that one year of schooling does not create the same amount of acquired knowledge regardless of the quality of the education system in which it takes place, but delivers different increases in skills depending on the efficiency of the education system, the quality of teaching, the educational infrastructure, or the curriculum. Thus, rather than counting how long students have sat in school, it seems crucial to focus on how much students have learned while in school when estimating the effect of education on economic growth. Years of schooling has a second major shortcoming. Its use implicitly assumes that all skills and human capital formation come from formal schooling. Yet extensive evidence on knowledge development and cognitive skills indicates that a variety of factors outside of school – family, peers, and others – have a direct and powerful influence. Ignoring these nonschool factors introduces another element of measurement error into the growth analyses in the same way as it did in the analysis of individual earnings. From the mid-1960s to today, international agencies have conducted many international tests of students’ performance in cognitive skills such as mathematics and science (see the appendix to this section for details). Employing a re-scaling method that makes performance at different international tests comparable (again, see appendix), we can use performance on these standardized tests as a proxy for the quality of education. Figure 4.1 presents average student performance on twelve testing occasions37 on the transformed scale which maps performance on each test to the scale of the recent 37 Note that each testing occasion may combine results from several tests at different age levels and in different subjects, so that there are 36 separate test observations altogether; see appendix for details. 25
  • 28. PISA international test. This scale has a mean of 500 and a standard deviation of 100 among the OECD countries in PISA.38 As is obvious from the figure, the developing countries that ever participated in one of the tests perform dramatically lower than any country in the group of OECD countries. The variation in the quality of education that exists among OECD countries is already substantial, but the magnitude of the difference to developing countries in the average amount of learning that has taken place after a given number of years of schooling dwarfs any within-OECD difference.39 Over the past ten years, empirical growth research demonstrates that consideration of the quality of education, measured by the cognitive skills learned, alters the assessment of the role of education in the process of economic development dramatically. When using the data from the international student achievement tests through 1991 to build a measure of educational quality, Hanushek and Kimko (2000) – first released as Hanushek and Kim (1995) – find a statistically and economically significant positive effect of the quality of education on economic growth in 1960-1990 that dwarfs the association between quantity of education and growth. Thus, even more than in the case of education and individual earnings, ignoring quality differences very significantly misses the true importance of education for economic growth. Their estimates suggest that one country-level standard deviation (equivalent to 47 test-score points in PISA 2000 mathematics, on whose scale Figure 4.1 is based) higher test performance would yield around one percentage point higher annual growth rates. 38 To facilitate comparisons, the within-country standard deviation of PISA test scores ranges between 80 and 108 in 26 mathematics in the OECD countries; the U.S. value is 98. 39 The precise scaling on the transformed metric is of course subject to considerable noise, in particular for the early tests and for countries performing far below the international mean. The tests are usually not developed to provide reliable estimates of performance in the tails of the achievement distribution, which would be relevant for very poorly performing countries. However, the rough pattern of overall performance should not be severely affected by the re-scaling. For example, the average performance level of Peruvian students on PISA 2002 where no re-scaling is involved is 292 in math, 333 in science and 327 in reading.
  • 29. Figure 4.1: Adjusted Performance on International Student Achievement Tests Source: Hanushek and Wößmann (in process), based on the different tests; see appendix to this section for details. 27
  • 30. This estimate stems from a statistical model that relates annual growth rates of real GDP per capita to the measure of educational quality, years of schooling, the initial level of income, and several other control variables (including in different specifications the population growth rates, political measures, openness of the economies, and the like). Hanushek and Kimko (2000) find that adding educational quality to a base specification including only initial income and educational quantity boosts the variance in GDP per capita among the 31 countries in their sample that can be explained by the model from 33 to 73 percent. The effect of years of schooling is greatly reduced by including quality, leaving it mostly insignificant. At the same time, adding the other factors leaves the effects of quality basically unchanged. Several studies have since found very similar results. Another early contribution, by Lee and Lee (1995), found an effect size similar to Hanushek and Kimko (2000) using data from the 1970-71 First International Science Study on the participating 17 countries, also leaving quantitative measures of education with no significant effect on growth. Using a more encompassing set of international tests, Barro (2001) also finds that, while both the quantity and the quality of education matter for economic growth, quality is much more important. Employing the quality measure developed by Hanushek and Kimko (2000) in a development accounting framework, Wößmann (2002, 2003b) finds that the share of cross-country variation in levels of economic development attributable to international differences in human capital rises dramatically when quality of education is taken into account.40 Extensions of the measure of Hanushek and Kimko (2000) and its imputation in Wößmann (2003b) are also used in the cross-country growth regressions by Bosworth and Collins (2003) and in the cross-country industry-level analysis by Ciccone and Papaioannou (2005). Both also find that educational quality strongly dominates any effect of educational quantity on growth.41 Coulombe, Tremblay, and Marchand (2004) and Coulombe and Tremblay (2006) use test-score data from the International Adult Literacy Survey (see Section 2.4 above) in a panel of 14 OECD countries, confirming the result that the quality measure outperforms quantitative measures of education. Finally, Jamison, Jamison, and Hanushek (forthcoming) extend the Hanushek and Kimko (2000) analysis by 40 This work builds on Gundlach, Rudman, and Wößmann (2002) and analyzes output per worker in 132 countries in 1990. The variation that can be attributed to international differences in human capital rises from 21 percent to 45 percent once the quality of education is taken into account, and to over 60 percent in samples with reasonable data quality. 41 Bosworth and Collins (2003) cannot distinguish the effect of quality of education from the effect of quality of government institutions. The analysis in Section 4.5 below shows, however, that they can be separated when we use our new quality measure that also extends the country sample by several additional data points on international tests scores. 28
  • 31. using the mathematics component of the transformed and extended tests shown in Figure 4.1, replicating and strengthening the previous results by using test data from a larger number of countries, controlling for a larger number of potentially confounding variables and extending the time period of the analysis. Using the panel structure of their growth data, they suggest that education seems to improve income levels mainly though speeding up technological progress, rather than shifting the level of the production function or increasing the impact of an additional year of schooling. In sum, the existing evidence suggests that the quality of education, measured by the knowledge that students gain as depicted in tests of cognitive skills, is substantially more important for economic growth than the mere quantity of education. 29 4.2 Issues of Endogeneity As noted, growth modeling is naturally subject to a common concern: Do the identified factors represent truly causal influences or mere associations that will not affect growth if altered by policy? The concerns about causality in the relationship of cognitive skills and growth have been addressed in detail by Hanushek and Kimko (2000). They conclude that causation concerns are very different in the case of quality than quantity, being much less of an issue in interpreting the results. Because causality issues are important for assessing our results below, we describe the Hanushek and Kimko direct investigations. One common concern in analyses such as this is that schooling might not be the actual cause of growth but, in fact, may just reflect other attributes of the economy that are beneficial to growth. For example, the East Asian countries consistently score very highly on the international tests (see Figure 4.1), and they also had extraordinarily high growth over the 1960–1990 period. It may be that other aspects of these East Asian economies have driven their growth and that the statistical analysis of labor force quality simply is picking out these countries. But in fact, even if the East Asian countries are excluded from the analysis, a strong—albeit slightly smaller—relationship is still observed with test performance. This test of sensitivity of the results seems to reflect a basic importance of school quality, a factor that contributes also to the observed growth of East Asian countries. Another concern is that other factors that affect growth, such as efficient market organizations, are also associated with efficient and productive schools—so that, again, the test measures are really a proxy for other attributes of the country. To investigate this, Hanushek and Kimko concentrate on immigrants to the United States who received their education in their home countries. They find that immigrants who were schooled in countries that have higher scores on the international math and science examinations earn more in the United States. On the other hand immigrants receiving part or all
  • 32. of their schooling in the United States do not see any earnings advantage linked to the cognitive skills of their home country. This analysis makes allowance for any differences in school attainment, labor market experience, or being native English-language speakers. In other words, skill differences as measured by the international tests are clearly rewarded in the United States labor market, reinforcing the validity of the tests as a measure of individual skills and productivity. Finally, the observed relationships could simply reflect reverse causality, that is, that countries that are growing rapidly have the added resources necessary to improve their schools and that better student performance is the result of growth, not the cause of growth. This issue is potentially important when policy alternatives are considered below, but, as a simple test of this, Hanushek and Kimko investigated whether the international math and science test scores were systematically related to the resources devoted to the schools in the years prior to the tests. They were not. If anything, their results suggested relatively better performance in those countries spending less on their schools. One final issue warrants consideration: The United States has never done well on these international assessments, yet its growth rate has been very high for a long period of time. The reconciliation is that quality of the labor force is just one aspect of the economy that enters into the determination of growth. A variety of factors clearly contribute, and these factors work to overcome any deficits in quality. These other factors may also be necessary for growth. In other words, simply providing more or higher-quality schooling may yield little in the way of economic growth in the absence of other elements, such as the appropriate market, legal, and governmental institutions to support a functioning modern economy. Past experiences investing in less developed countries that lack these institutional features suggest that schooling is not necessarily itself a sufficient engine of growth (e.g., Easterly (2002); Pritchett (2001)). We take up these issues about quality of societal institutions in detail below, because the evidence suggests that they are very important and could potentially distort the analysis of the impacts of human capital. Here, however, we briefly consider the U.S. situation, both because it sets the stage for more recent analyses and because it helps to provide some balance to the overall picture of growth. Three other factors immediately come to mind as being important in U.S. growth and as potentially masking to detrimental effects of low school quality. First, almost certainly the most important factor sustaining the growth of the U.S. economy is the openness and fluidity of its markets. The United States maintains generally freer labor and product markets than most countries in the world. The government generally has less regulation on firms, and trade unions are less extensive than those in many other countries. Even broader, the United States has less intrusion of government in the operation of the economy, including lower tax rates and minimal government production through nationalized 30
  • 33. industries. These factors encourage investment, permit the rapid development of new products and activities by firms, and allow U.S. workers to adjust to new opportunities. While identifying the precise importance of these factors is difficult, a variety of analyses suggest that such market differences could be very important explanations for differences in growth rates.42 Second, over the twentieth century, the expansion of the education system in the United States outpaced that around the world. The United States pushed to open secondary schools to all citizens. With this came also a move to expand higher education with the development of land grant universities, the G.I. bill, and direct grants and loans to students. More schooling with less learning each year still yielded more human capital than found in other nations that have less schooling but more learning in each of those years.43 Third, the analysis of growth rates across countries emphasizes quality of the elementary and secondary schools of the United States. It does not include any measures of the quality of U.S. colleges. By most evaluations, U.S. colleges and universities rank at the very top in the world. A number of models of economic growth in fact emphasize the importance of scientists and engineers as a key ingredient to growth. By these views, the technically trained college students who contribute to invention and to development of new products provide a special element to the growth equation. Here, again, the United States appears to have the best programs. Finally, in terms of endogeneity, it is important to note that our current work (reported below) replicates two of the tests in Hanushek and Kimko (2000). Specifically, in the context of extended growth analyses, we consider potential biases from including the East Asian countries, and we consider the resources-skills relationship. 31 4.3 Some New Evidence To provide the most up-to-date evidence, we extend the existing evidence in several ways. The new evidence adds additional international student achievement tests not previously available and uses the most recent data on economic growth which allow an analysis for an even longer time period (1960-2000). Furthermore, the new data extend the sample of countries with available test-score and growth information from 31 countries in Hanushek and Kimko (2000) to 50 countries (see the appendix of this section for details on the data). In the subsequent sections, we will also use these data to analyze 42 See, for example, Krueger (1974); World Bank (1993); Parente and Prescott (1994, 1999). 43 This advantage has clearly ended as many OECD countries have expanded schools to exceed the quantity of schooling found in the United States (see Organisation for Economic Co-operation and Development (2003)).
  • 34. effects of the distribution of educational quality at the bottom and at the top on economic growth, as well as interactions between educational quality and the institutional infrastructure of an economy. Our measure of the quality of education is a simple average of the mathematics and science scores over all the international tests depicted in Figure 4.1. We interpret this as a proxy for the average educational performance of the whole labor force. This measure encompasses overall cognitive skills, not just those developed in schools. Thus, whether skills are developed at home, in schools, or elsewhere, they are included in the growth analyses. As in the analyses underlying Figure 3.1, the source of the income data is version 6.1 of the Penn World Tables (cf. Heston, Summers, and Aten (2002)), and the data on years of schooling is an extended version of the Cohen and Soto (2001) data. The basic result is reported in column (2) of Table 4.1 and depicted graphically in Figure 4.2.44 After controlling for the initial level of GDP per capita and for years of schooling, the test-score measure features a statistically significant effect on the growth in real GDP per capita in 1960-2000. According to this specification, test scores that are larger by one standard deviation (measured at the student level across all OECD countries in PISA) are associated with an average annual growth rate in GDP per capita that is two percentage points higher over the whole 40-year period. Below we relate these numbers to outcomes of school reform policies. When educational quality is added to a model that just includes initial income and years of schooling (column (1) of Table 4.1), the share of variation in economic growth explained by the model (the adjusted R2) jumps from 0.25 to 0.73. As in Figure 3.1, quantity of education is statistically significantly related to economic growth in a specification that neglects educational quality, but the association between years of schooling and growth turns insignificant and is reduced to close to zero once the quality of education is included in the model (see the bottom of Figure 4.2).45 In either specification, there is evidence for conditional convergence in the sense that countries with higher initial income tend to grow more slowly over the subsequent period. 44 For a brief technical description of added-variable plots see Section 3.2 above. 45 The result remains the same when the measure of years of schooling refers to the average between 1960 and 2000, rather than the initial 1960 value. The coefficient estimate on years of schooling in the 50-country sample of column (1) of Table 4.1 is somewhat smaller than the one reported for the 92-country sample reported in Figure 3.1, corresponding to the fact discussed above that the estimate tends to be smaller in high-income countries. 32
  • 35. Table 4.1: Education as Determinant of Growth of Income per Capita, 1960-2000 (1) (2) (3)a (4) GDP per capita 1960 -0.379 -0.302 -0.277 -0.351 (4.24) (5.54) (4.43) (6.01) Years of schooling 1960 0.369 0.026 0.052 0.004 (3.23) (0.34) (0.64) (0.05) Test score (mean) 1.980 1.548 1.265 33 (9.12) (4.96) (4.06) Openness 0.508 (1.39) Protection against expropriation 0.388 (2.29) Constant 2.785 -4.737 -3.701 -4.695 (7.41) (5.54) (3.32) (5.09) N 50 50 50 47 R2 (adj.) 0.252 0.728 0.741 0.784 Dependent variable: average annual growth rate in GDP per capita, 1960-2000. t-statistics in parentheses. a Regression includes five regional dummies.
  • 36. Figure 4.2: Added-variable Plots of Growth and Education Notes: Added-variable plots of a regression of the average annual rate of growth (in percent) of real GDP per capita in 1960-2000 on the initial level of real GDP per capita in 1960, average test scores on international student achievement tests, and average years of schooling in 1960. Author calculations; see Table 4.1, column (2). 34
  • 37. The same pattern of results is preserved when we ignore any variation between world regions by including five regional dummies (column (3) of Table 4.1).46 That is, even when considering just the variation that exists within each region, educational quality is significantly related to economic growth, with a coefficient estimate reduced from 1.98 to 1.55. One of the most important fundamental determinants of economic growth discussed in the recent literature is the institutional framework of the economy (see Section 4.5 below for details). The most common and powerful measures of the institutional framework used in empirical work are the openness of the economy to international trade and the security of property rights.47 When we add these two institutional variables to our model, they are jointly highly significant (column (4) of Table 4.1). But the positive effect of educational quality on economic growth is very robust to the inclusion of these controls, albeit slightly reduced in magnitude to 1.26. Other potential determinants of economic growth often discussed in the literature are fertility and geography. However, when we add the total fertility rate and common geographical proxies, such as latitude or the fraction of the land area of a country that is located within the geographic tropics, to the specification reported in column (4) of Table 4.1, neither of these additional variables is statistically significantly associated with economic growth. Furthermore, none of the other results, in particular for educational quality, are qualitatively affected. An important issue is whether the role of educational quality in the process of economic development differs between developing and developed countries. In Table 4.2, we divide the sample of countries into two groups in two different ways. First, in columns (5) and (6), we subdivide the sample into OECD countries and non-OECD countries. Results are remarkably similar, with the point estimate of the effect of educational quality slightly larger in non-OECD countries. However, the effect of educational quality on economic growth does not differ significantly between the two groups of 46 The regions are East Asia, South Asia, Latin America, Middle East and North Africa, Sub-Saharan Africa, and the 35 industrial countries. 47 The proxy for openness used here is the fraction of years between 1960 and 1998 that a country was classified as having an economy open to international trade, based on five factors including tariffs, quotas, exchange rate controls, export controls, and whether or not a socialist economy (cf. Sachs and Warner (1995)). The proxy for security of property rights is an index of the protection against expropriation risk, averaged over 1985-1995, from Political Risk Services (a private company which assesses the risk that investments will be expropriated in different countries), ranging from 0 to 10 (high figures corresponding to low risk), as used by Acemoglu, Johnson, and Robinson (2001) and provided in McArthur and Sachs (2001). This measure of the risk of confiscation and forced nationalization of property is often used as a summary variable for institutional quality, and similar data were first used in this framework by Knack and Keefer (1995).
  • 38. countries. The results remain qualitatively the same when openness and quality of institutions are again added as control variables. Table 4.2: Education as Determinant of Growth of Income per Capita, 1960-2000: Sub-samples (5) (6) (7) (8) Developing countriesa OECD sample Low-income 36 countriesb High-income countriesc GDP per capita 1960 -0.262 -0.301 -0.063 -0.294 (1.77) (5.81) (0.28) (6.38) Years of schooling 1960 0.025 0.025 0.006 0.152 (0.20) (0.26) (0.05) (1.70) Test score (mean) 2.056 1.736 2.286 1.287 (6.10) (4.17) (6.98) (5.37) Constant -5.139 -3.539 -6.412 -2.489 (3.63) (1.96) (4.52) (2.86) N 27 23 25 25 R2 (adj.) 0.676 0.830 0.707 0.783 Dependent variable: average annual growth rate in GDP per capita, 1960-2000. a Non-OECD countries. b Countries below sample median of GDP per capital 1960. c Countries above sample median of GDP per capital 1960. Second, in columns (7) and (8), we subdivide the sample into countries above and below the sample median of initial GDP per capita. Again, the significant effect of educational quality remains robust in both sub-samples.48 Here, the effect of quality is considerably larger in the low-income countries, and the difference in the coefficients on test scores is statistically significant at the five percent level. Thus, if anything, the effect of educational quality is larger in developing countries than in developed countries. Furthermore, the robustness of the effect in the sub-samples is remarkable, in particular considering the small sample sizes of the specifications reported in Table 4.2. When adding an interaction term between years of schooling and test scores to the specification, the interaction term is insignificant in the full sample of countries. But in the sub-sample of low-income countries (with a GDP per capita below the sample median in 1960), the interaction term is significantly positive. At least in this sample, the returns to increased years of schooling increase with the quality of the education. Once there is a high-quality school system, it pays to keep children longer in school – but it does not if the school system does not produce skills. 48 Similarly, the effect of educational quality remains robust in the two sub-samples of countries above and below the median of economic growth over the considered period, with the point estimate larger in the high-growth sample.
  • 39. Importantly, the results do not appear to be an artifact of the specific time period, set of countries, or achievement measurement decisions. Extensive robustness tests confirm the strong and significant relationship between educational quality and economic growth. The results reported in Tables 4.1 and 4.2 are robust to several alternative approaches to measuring the quality of education. The results remain qualitatively the same when using only the tests performed at the level of lower secondary education, excluding any test in primary schooling or in the final year of secondary education. Arguably, test scores at the end of the secondary level, which combine the knowledge accumulated over primary and secondary schooling, may be more relevant for the human capital of the labor force than test scores that capture only the knowledge at the end of either primary or lower secondary school. At the same time, the duration of secondary education differs across countries, so that tests performed in the final year of secondary schooling in each country may not be as readily comparable across countries as the grade-based target populations. Further, given differing school completion rates, the test for the final year of secondary schooling may imply cross-country samples with differential selectivity of test takers. Neither the primary-school tests nor the tests in the final secondary year are crucial for the results. Furthermore, results are qualitatively the same when using only scores on tests performed since 1995. These recent tests have not been used in the previous analyses and are generally viewed as having the highest standard of sampling and quality control. Likewise, results are robust to using tests scores since 1995 for just lower secondary grades. A drawback of using only the more recent tests is that such an approach requires a strong version of the assumption that test performance is reasonably constant over time, because it relates test performance measured since 1995 to the economic data for 1960-2000. To make sure that higher previous economic growth is not driving the measured test performance, we also used a test score measure that disregards all tests since the late 1990s. Our results turn out to be robust, with a point estimate on the test score variable that is significantly higher, when we restrict the tests to only those conducted until 1995 (sample reduced to 34 countries) and until 1984 (22 countries).49 In sum, the results are not driven by either early or late test scores alone. The results are also robust to performing the analyses in two sub-periods, 1960-1980 and 1980- 2000. The most recent period includes the Asian currency crisis and other major economic disruptions 49 We can also use the average early test scores (either until 1984 or until 1995) as an instrument for the average of all test scores in a two-stage least-squares regression, in order to utilize only that part of the total test-score measure that can be traced back to the early test scores. Again, our results are robust to such an instrumental-variable approach. 37