This study examined recruitment synchrony of fish stocks in the Gulf of Alaska and Eastern Bering Sea to determine if it is due to shared responses to environmental variables. Bayesian hierarchical models grouped stocks and found some synchrony but less than expected. Positive sea surface height anomalies in the Gulf of Alaska were associated with higher recruitment for coastal stocks, likely due to enhanced onshore transport. Offshore conditions were linked to recruitment for offshore stocks. Future work could examine additional variables and nonlinear effects to better understand recruitment drivers.
Is recruitment synchrony due to shared susceptibility to environmental variables?
1. Is recruitment synchrony due to shared susceptibility to environmental variables?!
Megan Stachura 1*, Tim Essington 1, Nate Mantua1, Trevor Branch 1, Anne Hollowed2, Paul Spencer 2, and Melissa Haltuch 3!
1University of Washington, School of Aquatic and Fishery Sciences, 2NOAA Alaska Fisheries Science Center, 3NOAA Northwest Fisheries Science Center, *Email: mstachur@uw.edu!
Background! Results: Gulf of Alaska Results:
Eastern
Bering
Sea/Aleu3an
Islands
Question: Is recruitment synchrony for groups of marine fish Synchrony of extreme recruitment events! Synchrony of extreme recruitment events!
Highest 25% Lowest 25% Middle 50%
stocks due to shared susceptibility to environmental variables?! High 1998-2000! Highest 25% Lowest 25% Middle 50% Low 1982! Low 1994!
!
Arrowtooth flounder High 1977!
Alaska plaice
• Synchrony of extreme fish recruitment events has been observed Dover sole Arrowtooth flounder
Pacific halibut Greenland turbot
in Alaska's marine ecosystems! Rex sole Yellowfin sole
Sablefish
• We hypothesize that synchrony in recruitment is due to shared Flathead sole
Flathead sole
Northern rock sole
Pacific cod
life history traits that yield shared sensitivities to regional scale Walleye pollock
Pacific cod
Togiak Pacific herring
environmental events! Seymour Canal Pacific herring
Sitka Sound Pacific herring
AI walleye pollock
EBS walleye pollock
• Bayesian hierarchical models can estimate group level effects of Dusky rockfish Atka mackerel
Northern rockfish Northern rockfish
predictors, so this is a good method for estimating Pacific ocean perch Pacific ocean perch
Rougheye & blackspotted rockfish Rougheye & blackspotted rockfish
environmental effects for groups of fish stocks!
1950 1960 1970 1980 1990 2000 2010 1950 1960 1970 1980 1990 2000 2010
Year Year
Data!
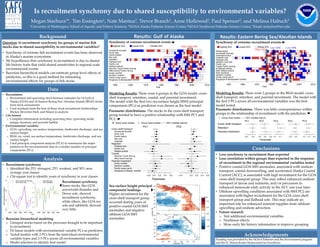
• Recruitment! Modeling Results: There were 4 groups in the GOA model: cross- Modeling Results: There were 3 groups in the BSAI model: cross-
o Recruitment and spawning stock biomass estimates for 14 Gulf of shelf transport, retention, coastal, and parental investment.! shelf transport, retention, and parental investment. The model with
Alaska (GOA) and 14 Eastern Bering Sea/Aleutian Islands (BSAI) stocks The model with the first two sea surface height (SSH) principal the first 5 PCs across all environmental variables was the best
from stock assessments! components (PCs) as predictors was chosen as the best model. ! model tested. !
o Used residuals from the best of three stock-recruitment relationships Parameter distributions. There was little correspondence within
(Ricker, Beverton-Holt, and Mean) in analysis! Parameter distributions. The stocks in the cross-shelf transport
group tended to have a positive relationship with SSH PC1 and groups in the relationship of recruitment with the predictors.!
• Life history!
! Group−level median 95% credible interval
o Compiled information including spawning time, spawning mode, PC2.!
PC1 PC2 PC3 PC4 PC5
pelagic duration, and juvenile habitat! ! Stock−level median ! Group−level median 95% credible interval
Cross−shelf transport ! ! ! ! !
• Environmental variables! PC1 PC2 Retention ! ! ! ! !
0
0
0
0
0
o GOA: upwelling, sea surface temperature, freshwater discharge, and sea Cross−shelf transport ! !
Arrowtooth flounder ! ! Parental investment ! ! ! ! !
surface height! Dover sole ! !
o BSAI: ice, wind, sea surface temperature, freshwater discharge, and sea Pacific halibut ! ! −0.6 0.0 −0.2 0.0 0.2 −0.1 0.1 −0.2 0.0 −0.1 0.1 0.3
Rex sole
surface height! Sablefish
!
!
!
!
Index Index Parameter
Index Index Index Index
o Used principal component analysis (PCA) to summarize the major Retention ! !
patterns in the environmental data in a smaller number of principal Flathead sole ! !
components (PCs)!
Pacific cod ! ! Conclusions!
0
0
Walleye pollock ! !
Coastal
Seymour Canal herring
!
!
!
!
• Less synchrony in recruitment than expected!
Analysis! Sitka Sound herring
Parental investment !
! !
!
• Less correlation within groups than expected in the response
Dusky rockfish of recruitment to the regional environmental variables tested!
• Recruitment synchrony! ! !
Northern rockfish ! !
• Positive coastal GOA SSH anomalies, associated with onshore
o Identified the 25% strongest, 25% weakest, and 50% near Pacific ocean perch ! !
average year classes!
Rougheye & blacksp. rockfish ! ! transport, coastal downwelling, and accelerated Alaska Coastal
o Chi-square test to identify years of synchrony in year classes! −0.2 0.0 0.2 0.4 0.6 −0.4 0.0 0.2 0.4 0.6 Current (ACC), is associated with high recruitment for the GOA
! Index Parameter
Index Index cross-shelf transport group. This may reflect enhanced onshore
1.0
GOA Arrowtooth flounder
GOA Dover sole
GOA Rex sole
GOA Sablefish Recruitment synchrony. transport of larvae and nutrients, and/or precursors to
2
PC1
Some stocks, like GOA Sea surface height principal 60
enhanced mesoscale eddy activity in the ACC one year later. !
Stock-recruitment residuals
1
arrowtooth flounder and component loadings. 55
0.5
! • Offshore upwelling conditions associated with SSH PC2 are
Dover sole, showed Higher recruitment for the
0
50
! associated with higher recruitment for the GOA cross-shelf
recruitment synchrony, cross-shelf transport group
45 Loadings
-1
! transport group and flathead sole. This may indicate an
0.0
40
while others, like GOA rex occurred during years of 0.04
-2
! sole and sablefish, showed
35 important role for enhanced nutrient supplies from offshore
positive coastal GOA SSH
! upwelling and onshore advection. !
-3
30 0.02
Latitude (°N)
very little.!
-0.5
anomalies and negative
! 1985 1990 1995 2000 2005 1985 1990 1995 2000 2005 • Future research!
! Year offshore GOA SSH PC2 0.00
60
o Test additional environmental variables!
• Bayesian hierarchical modeling ! anomalies. ! 55
−0.02
o Nonlinear effects!
o Grouped stocks based on the processes thought to be important 50
o More early life history information to improve grouping!
to recruitment! 45 −0.04
o Fit linear models with environmental variable PCs as predictors! 40
Acknowledgements!
35
o Tested models with 2 PCs from the individual environmental 30
variable types and 2-5 PCs across all environmental variables! Funding was provided by the NOAA Fisheries and the Environment program
o Model selection to identify best model! 170 160 150 140
Longitude (°W)
130 120
and the H. Mason Keeler Endowment for Excellence. !