SlideShare ist ein Scribd-Unternehmen logo
1 von 4
Basic Statistics 2011
Module 2

Summation Notation and Use of the Calculator
Objectives:

At the end of the module, the students should be able to:

     1. Determine the values of expressions using the summation notation
     2. Utilize the calculator in evaluating expressions involving the summation notation

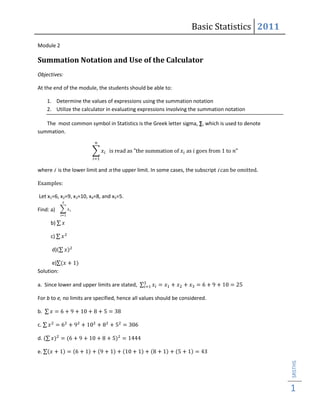
   The most common symbol in Statistics is the Greek letter sigma, ∑, which is used to denote
summation.


where i is the lower limit and n the upper limit. In some cases, the subscript i can be omitted.

Examples:

Let x1=6, x2=9, x3=10, x4=8, and x5=5.

Find: a)

      b)

      c)

       d)

      e)
Solution:

a. Since lower and upper limits are stated,

For b to e, no limits are specified, hence all values should be considered.

b.

c.

d.

e.
                                                                                                   SRSTHS


                                                                                                   1
Basic Statistics 2011
How to Use your Scientific Calculator*

*Caution: The procedure may not apply to all calculator models, thus, you may just consult your
calculator’s manual.

For data involving one variable, activate the STAT 0 or STAT 1 mode or its equivalent.

1. Set your calculator in SD mode. Press Mode and choose STAT then SD.

2. Clear the Stat memory by pressing 2nd F or Shift then CLR, or AC, or CA.

3. Start entering data. Using the data in the example above

                       X1         X2          X3          X4          X5
                       6           9          10          8             5
         Press          6       DATA
                        9       DATA
                        10      DATA
                        8       DATA
                        5       DATA
4. To get    , press RCL then the key where        is. It should display the same answer given above. The
same applies to getting     .

5. You can also get other measurements like the mean (        and standard deviation (sx) by pressing RCL
then the key where or sx is, respectively.

For data involving two variables, activate the STAT 1 or STAT LINE mode or its equivalent.

    1. Press MODE then STAT then LINE.
    2. Clear the Stat memory.
    3. Start entering data. Use the data below.
                     X         3        5        4              8        9
                     y        12       15       16             11       13
         Press         3         (x,y)  12
                       5         (x,y)  15
                       4         (x,y)  16
                       8         (x,y)  11
                       9         (x,y)  13

    4. Press RCL then the key where the data you intend to get is placed.

                 RCL                                      Did you get        29?

                 RCL                                                         67?

                 RCL                                      What did you get?
                                                                                                            SRSTHS


                                                                                                            2
Basic Statistics 2011
 How about…

1.

2.

3.

4.

5. sy

6. sx

Exercise:

     A.  The following are the number of minutes it took 10 students to answer a 10-item quiz in
        Algebra.
        Student Number               1     2      3     4     5       6     7      8     9    10
        Number of Minutes (m)       10     5     15    20     8      19    25     30    17    11
        Find:
        1.
        2.
        3.
        4.
        5.
     B. The following table shows the 2nd quarter grades of 10 students in English and Geometry.
        English (x)     91      88      78      85       83       90      89       86      89    88
        Geometry(y) 87          86      80      89       85       86      89       87      85    83
        Find:
        1.
        2.
        3.
        4.
        5.
        6.
        7.
        8.
        9.
        10.
        11.
        12.
        13.
                                                                                                      SRSTHS


        14.
        15.


                                                                                                      3
Basic Statistics 2011


                        SRSTHS


                        4

Weitere ähnliche Inhalte

Andere mochten auch (13)

What is a Kruskal Wallis-Test?
What is a Kruskal Wallis-Test?What is a Kruskal Wallis-Test?
What is a Kruskal Wallis-Test?
 
El ectiva 3 (programacion)
El ectiva 3 (programacion) El ectiva 3 (programacion)
El ectiva 3 (programacion)
 
Social Network as a Learning Companion
Social Network as a Learning CompanionSocial Network as a Learning Companion
Social Network as a Learning Companion
 
SPOTLIGHT ON THE PREMIUM CHANNEL - Abbott Medical Optics
SPOTLIGHT ON THE PREMIUM CHANNEL - Abbott Medical OpticsSPOTLIGHT ON THE PREMIUM CHANNEL - Abbott Medical Optics
SPOTLIGHT ON THE PREMIUM CHANNEL - Abbott Medical Optics
 
Goverment gazette 2555
Goverment gazette 2555Goverment gazette 2555
Goverment gazette 2555
 
Saginaw 2015 keynote
Saginaw 2015 keynoteSaginaw 2015 keynote
Saginaw 2015 keynote
 
Q1 2009 Earning Report of Vascular Solution
Q1 2009 Earning Report of Vascular SolutionQ1 2009 Earning Report of Vascular Solution
Q1 2009 Earning Report of Vascular Solution
 
Copyright 2007 2
Copyright 2007 2Copyright 2007 2
Copyright 2007 2
 
Selling Power Top 50 2014
Selling Power Top 50 2014Selling Power Top 50 2014
Selling Power Top 50 2014
 
นางรอง Kan
นางรอง Kanนางรอง Kan
นางรอง Kan
 
biomed.in.th
biomed.in.thbiomed.in.th
biomed.in.th
 
Life Sciences 2011
 Life Sciences 2011 Life Sciences 2011
Life Sciences 2011
 
Study for the creation of a local specialized
Study for the creation of a local specializedStudy for the creation of a local specialized
Study for the creation of a local specialized
 

Ähnlich wie Module 2

X Bar And S Charts Mini Tutorial
X Bar And S Charts Mini TutorialX Bar And S Charts Mini Tutorial
X Bar And S Charts Mini Tutorialahmad bassiouny
 
Econometric (Indonesia's Economy).pptx
Econometric (Indonesia's Economy).pptxEconometric (Indonesia's Economy).pptx
Econometric (Indonesia's Economy).pptxIndraYu2
 
Mm chap08 -_lossy_compression_algorithms
Mm chap08 -_lossy_compression_algorithmsMm chap08 -_lossy_compression_algorithms
Mm chap08 -_lossy_compression_algorithmsEellekwameowusu
 
Descriptive Statistics, Numerical Description
Descriptive Statistics, Numerical DescriptionDescriptive Statistics, Numerical Description
Descriptive Statistics, Numerical Descriptiongetyourcheaton
 
T11_effects_of_peripheral_stim
T11_effects_of_peripheral_stimT11_effects_of_peripheral_stim
T11_effects_of_peripheral_stimtutorialsruby
 
T11_effects_of_peripheral_stim
T11_effects_of_peripheral_stimT11_effects_of_peripheral_stim
T11_effects_of_peripheral_stimtutorialsruby
 
Advanced Econometrics L7-8.pptx
Advanced Econometrics L7-8.pptxAdvanced Econometrics L7-8.pptx
Advanced Econometrics L7-8.pptxakashayosha
 
Kaizen cso002 l1
Kaizen cso002 l1Kaizen cso002 l1
Kaizen cso002 l1asslang
 
How to create graphs for science
How to create graphs for scienceHow to create graphs for science
How to create graphs for scienceBrad Kremer
 
Stata time-series-fall-2011
Stata time-series-fall-2011Stata time-series-fall-2011
Stata time-series-fall-2011Feryanto W K
 
FPP 1. Getting started
FPP 1. Getting startedFPP 1. Getting started
FPP 1. Getting startedRob Hyndman
 
chapter10
chapter10chapter10
chapter10butest
 
Cooling Project for Students- Answer Key
Cooling Project for Students- Answer KeyCooling Project for Students- Answer Key
Cooling Project for Students- Answer KeyAlexis Ploss
 
Optimum Algorithm for Computing the Standardized Moments Using MATLAB 7.10(R2...
Optimum Algorithm for Computing the Standardized Moments Using MATLAB 7.10(R2...Optimum Algorithm for Computing the Standardized Moments Using MATLAB 7.10(R2...
Optimum Algorithm for Computing the Standardized Moments Using MATLAB 7.10(R2...Waqas Tariq
 
Spss in soil science
Spss in soil scienceSpss in soil science
Spss in soil scienceEmeni Joshua
 
1 CMIS 102 Hands-On Lab Week 8 Overview Th.docx
1  CMIS 102 Hands-On Lab  Week 8 Overview Th.docx1  CMIS 102 Hands-On Lab  Week 8 Overview Th.docx
1 CMIS 102 Hands-On Lab Week 8 Overview Th.docxhoney725342
 

Ähnlich wie Module 2 (20)

6 sigma
6 sigma 6 sigma
6 sigma
 
X Bar And S Charts Mini Tutorial
X Bar And S Charts Mini TutorialX Bar And S Charts Mini Tutorial
X Bar And S Charts Mini Tutorial
 
Econometric (Indonesia's Economy).pptx
Econometric (Indonesia's Economy).pptxEconometric (Indonesia's Economy).pptx
Econometric (Indonesia's Economy).pptx
 
X Bar R Charts
X Bar R ChartsX Bar R Charts
X Bar R Charts
 
X Bar R Charts
X Bar R ChartsX Bar R Charts
X Bar R Charts
 
X Bar R Charts
X Bar R ChartsX Bar R Charts
X Bar R Charts
 
Mm chap08 -_lossy_compression_algorithms
Mm chap08 -_lossy_compression_algorithmsMm chap08 -_lossy_compression_algorithms
Mm chap08 -_lossy_compression_algorithms
 
Descriptive Statistics, Numerical Description
Descriptive Statistics, Numerical DescriptionDescriptive Statistics, Numerical Description
Descriptive Statistics, Numerical Description
 
T11_effects_of_peripheral_stim
T11_effects_of_peripheral_stimT11_effects_of_peripheral_stim
T11_effects_of_peripheral_stim
 
T11_effects_of_peripheral_stim
T11_effects_of_peripheral_stimT11_effects_of_peripheral_stim
T11_effects_of_peripheral_stim
 
Advanced Econometrics L7-8.pptx
Advanced Econometrics L7-8.pptxAdvanced Econometrics L7-8.pptx
Advanced Econometrics L7-8.pptx
 
Kaizen cso002 l1
Kaizen cso002 l1Kaizen cso002 l1
Kaizen cso002 l1
 
How to create graphs for science
How to create graphs for scienceHow to create graphs for science
How to create graphs for science
 
Stata time-series-fall-2011
Stata time-series-fall-2011Stata time-series-fall-2011
Stata time-series-fall-2011
 
FPP 1. Getting started
FPP 1. Getting startedFPP 1. Getting started
FPP 1. Getting started
 
chapter10
chapter10chapter10
chapter10
 
Cooling Project for Students- Answer Key
Cooling Project for Students- Answer KeyCooling Project for Students- Answer Key
Cooling Project for Students- Answer Key
 
Optimum Algorithm for Computing the Standardized Moments Using MATLAB 7.10(R2...
Optimum Algorithm for Computing the Standardized Moments Using MATLAB 7.10(R2...Optimum Algorithm for Computing the Standardized Moments Using MATLAB 7.10(R2...
Optimum Algorithm for Computing the Standardized Moments Using MATLAB 7.10(R2...
 
Spss in soil science
Spss in soil scienceSpss in soil science
Spss in soil science
 
1 CMIS 102 Hands-On Lab Week 8 Overview Th.docx
1  CMIS 102 Hands-On Lab  Week 8 Overview Th.docx1  CMIS 102 Hands-On Lab  Week 8 Overview Th.docx
1 CMIS 102 Hands-On Lab Week 8 Overview Th.docx
 

Mehr von Chie Pegollo

Counting Technique, Permutation, Combination
Counting Technique, Permutation, CombinationCounting Technique, Permutation, Combination
Counting Technique, Permutation, CombinationChie Pegollo
 
Sampling techniquesmod5
Sampling techniquesmod5Sampling techniquesmod5
Sampling techniquesmod5Chie Pegollo
 
Counting techniques
Counting techniquesCounting techniques
Counting techniquesChie Pegollo
 
Measures of central tendency
Measures of central tendencyMeasures of central tendency
Measures of central tendencyChie Pegollo
 
Measuresofcentraltendencygrpdata
MeasuresofcentraltendencygrpdataMeasuresofcentraltendencygrpdata
MeasuresofcentraltendencygrpdataChie Pegollo
 
Presentationofdatamod6b
Presentationofdatamod6bPresentationofdatamod6b
Presentationofdatamod6bChie Pegollo
 
Presentationofdatamod6b
Presentationofdatamod6bPresentationofdatamod6b
Presentationofdatamod6bChie Pegollo
 
presentation of data
presentation of datapresentation of data
presentation of dataChie Pegollo
 
Abuses of statistics
Abuses of statisticsAbuses of statistics
Abuses of statisticsChie Pegollo
 
Abuses Of Statistics
Abuses Of StatisticsAbuses Of Statistics
Abuses Of StatisticsChie Pegollo
 

Mehr von Chie Pegollo (13)

Counting Technique, Permutation, Combination
Counting Technique, Permutation, CombinationCounting Technique, Permutation, Combination
Counting Technique, Permutation, Combination
 
Sampling techniquesmod5
Sampling techniquesmod5Sampling techniquesmod5
Sampling techniquesmod5
 
Counting techniques
Counting techniquesCounting techniques
Counting techniques
 
Measures of central tendency
Measures of central tendencyMeasures of central tendency
Measures of central tendency
 
Measuresofcentraltendencygrpdata
MeasuresofcentraltendencygrpdataMeasuresofcentraltendencygrpdata
Measuresofcentraltendencygrpdata
 
Presentationofdatamod6b
Presentationofdatamod6bPresentationofdatamod6b
Presentationofdatamod6b
 
Presentationofdatamod6b
Presentationofdatamod6bPresentationofdatamod6b
Presentationofdatamod6b
 
presentation of data
presentation of datapresentation of data
presentation of data
 
Data gathering
Data gatheringData gathering
Data gathering
 
Abuses of statistics
Abuses of statisticsAbuses of statistics
Abuses of statistics
 
Module 3
Module 3Module 3
Module 3
 
Abuses Of Statistics
Abuses Of StatisticsAbuses Of Statistics
Abuses Of Statistics
 
Basic Statistics
Basic  StatisticsBasic  Statistics
Basic Statistics
 

Kürzlich hochgeladen

Key note speaker Neum_Admir Softic_ENG.pdf
Key note speaker Neum_Admir Softic_ENG.pdfKey note speaker Neum_Admir Softic_ENG.pdf
Key note speaker Neum_Admir Softic_ENG.pdfAdmir Softic
 
Call Girls in Dwarka Mor Delhi Contact Us 9654467111
Call Girls in Dwarka Mor Delhi Contact Us 9654467111Call Girls in Dwarka Mor Delhi Contact Us 9654467111
Call Girls in Dwarka Mor Delhi Contact Us 9654467111Sapana Sha
 
microwave assisted reaction. General introduction
microwave assisted reaction. General introductionmicrowave assisted reaction. General introduction
microwave assisted reaction. General introductionMaksud Ahmed
 
Presentation by Andreas Schleicher Tackling the School Absenteeism Crisis 30 ...
Presentation by Andreas Schleicher Tackling the School Absenteeism Crisis 30 ...Presentation by Andreas Schleicher Tackling the School Absenteeism Crisis 30 ...
Presentation by Andreas Schleicher Tackling the School Absenteeism Crisis 30 ...EduSkills OECD
 
BASLIQ CURRENT LOOKBOOK LOOKBOOK(1) (1).pdf
BASLIQ CURRENT LOOKBOOK  LOOKBOOK(1) (1).pdfBASLIQ CURRENT LOOKBOOK  LOOKBOOK(1) (1).pdf
BASLIQ CURRENT LOOKBOOK LOOKBOOK(1) (1).pdfSoniaTolstoy
 
social pharmacy d-pharm 1st year by Pragati K. Mahajan
social pharmacy d-pharm 1st year by Pragati K. Mahajansocial pharmacy d-pharm 1st year by Pragati K. Mahajan
social pharmacy d-pharm 1st year by Pragati K. Mahajanpragatimahajan3
 
Interactive Powerpoint_How to Master effective communication
Interactive Powerpoint_How to Master effective communicationInteractive Powerpoint_How to Master effective communication
Interactive Powerpoint_How to Master effective communicationnomboosow
 
Web & Social Media Analytics Previous Year Question Paper.pdf
Web & Social Media Analytics Previous Year Question Paper.pdfWeb & Social Media Analytics Previous Year Question Paper.pdf
Web & Social Media Analytics Previous Year Question Paper.pdfJayanti Pande
 
Grant Readiness 101 TechSoup and Remy Consulting
Grant Readiness 101 TechSoup and Remy ConsultingGrant Readiness 101 TechSoup and Remy Consulting
Grant Readiness 101 TechSoup and Remy ConsultingTechSoup
 
Class 11th Physics NEET formula sheet pdf
Class 11th Physics NEET formula sheet pdfClass 11th Physics NEET formula sheet pdf
Class 11th Physics NEET formula sheet pdfAyushMahapatra5
 
Ecosystem Interactions Class Discussion Presentation in Blue Green Lined Styl...
Ecosystem Interactions Class Discussion Presentation in Blue Green Lined Styl...Ecosystem Interactions Class Discussion Presentation in Blue Green Lined Styl...
Ecosystem Interactions Class Discussion Presentation in Blue Green Lined Styl...fonyou31
 
Sports & Fitness Value Added Course FY..
Sports & Fitness Value Added Course FY..Sports & Fitness Value Added Course FY..
Sports & Fitness Value Added Course FY..Disha Kariya
 
Holdier Curriculum Vitae (April 2024).pdf
Holdier Curriculum Vitae (April 2024).pdfHoldier Curriculum Vitae (April 2024).pdf
Holdier Curriculum Vitae (April 2024).pdfagholdier
 
fourth grading exam for kindergarten in writing
fourth grading exam for kindergarten in writingfourth grading exam for kindergarten in writing
fourth grading exam for kindergarten in writingTeacherCyreneCayanan
 
Paris 2024 Olympic Geographies - an activity
Paris 2024 Olympic Geographies - an activityParis 2024 Olympic Geographies - an activity
Paris 2024 Olympic Geographies - an activityGeoBlogs
 
Beyond the EU: DORA and NIS 2 Directive's Global Impact
Beyond the EU: DORA and NIS 2 Directive's Global ImpactBeyond the EU: DORA and NIS 2 Directive's Global Impact
Beyond the EU: DORA and NIS 2 Directive's Global ImpactPECB
 
Introduction to Nonprofit Accounting: The Basics
Introduction to Nonprofit Accounting: The BasicsIntroduction to Nonprofit Accounting: The Basics
Introduction to Nonprofit Accounting: The BasicsTechSoup
 
Disha NEET Physics Guide for classes 11 and 12.pdf
Disha NEET Physics Guide for classes 11 and 12.pdfDisha NEET Physics Guide for classes 11 and 12.pdf
Disha NEET Physics Guide for classes 11 and 12.pdfchloefrazer622
 

Kürzlich hochgeladen (20)

Mattingly "AI & Prompt Design: Structured Data, Assistants, & RAG"
Mattingly "AI & Prompt Design: Structured Data, Assistants, & RAG"Mattingly "AI & Prompt Design: Structured Data, Assistants, & RAG"
Mattingly "AI & Prompt Design: Structured Data, Assistants, & RAG"
 
Key note speaker Neum_Admir Softic_ENG.pdf
Key note speaker Neum_Admir Softic_ENG.pdfKey note speaker Neum_Admir Softic_ENG.pdf
Key note speaker Neum_Admir Softic_ENG.pdf
 
Call Girls in Dwarka Mor Delhi Contact Us 9654467111
Call Girls in Dwarka Mor Delhi Contact Us 9654467111Call Girls in Dwarka Mor Delhi Contact Us 9654467111
Call Girls in Dwarka Mor Delhi Contact Us 9654467111
 
microwave assisted reaction. General introduction
microwave assisted reaction. General introductionmicrowave assisted reaction. General introduction
microwave assisted reaction. General introduction
 
Presentation by Andreas Schleicher Tackling the School Absenteeism Crisis 30 ...
Presentation by Andreas Schleicher Tackling the School Absenteeism Crisis 30 ...Presentation by Andreas Schleicher Tackling the School Absenteeism Crisis 30 ...
Presentation by Andreas Schleicher Tackling the School Absenteeism Crisis 30 ...
 
BASLIQ CURRENT LOOKBOOK LOOKBOOK(1) (1).pdf
BASLIQ CURRENT LOOKBOOK  LOOKBOOK(1) (1).pdfBASLIQ CURRENT LOOKBOOK  LOOKBOOK(1) (1).pdf
BASLIQ CURRENT LOOKBOOK LOOKBOOK(1) (1).pdf
 
social pharmacy d-pharm 1st year by Pragati K. Mahajan
social pharmacy d-pharm 1st year by Pragati K. Mahajansocial pharmacy d-pharm 1st year by Pragati K. Mahajan
social pharmacy d-pharm 1st year by Pragati K. Mahajan
 
Interactive Powerpoint_How to Master effective communication
Interactive Powerpoint_How to Master effective communicationInteractive Powerpoint_How to Master effective communication
Interactive Powerpoint_How to Master effective communication
 
Web & Social Media Analytics Previous Year Question Paper.pdf
Web & Social Media Analytics Previous Year Question Paper.pdfWeb & Social Media Analytics Previous Year Question Paper.pdf
Web & Social Media Analytics Previous Year Question Paper.pdf
 
Grant Readiness 101 TechSoup and Remy Consulting
Grant Readiness 101 TechSoup and Remy ConsultingGrant Readiness 101 TechSoup and Remy Consulting
Grant Readiness 101 TechSoup and Remy Consulting
 
Class 11th Physics NEET formula sheet pdf
Class 11th Physics NEET formula sheet pdfClass 11th Physics NEET formula sheet pdf
Class 11th Physics NEET formula sheet pdf
 
Ecosystem Interactions Class Discussion Presentation in Blue Green Lined Styl...
Ecosystem Interactions Class Discussion Presentation in Blue Green Lined Styl...Ecosystem Interactions Class Discussion Presentation in Blue Green Lined Styl...
Ecosystem Interactions Class Discussion Presentation in Blue Green Lined Styl...
 
Sports & Fitness Value Added Course FY..
Sports & Fitness Value Added Course FY..Sports & Fitness Value Added Course FY..
Sports & Fitness Value Added Course FY..
 
Holdier Curriculum Vitae (April 2024).pdf
Holdier Curriculum Vitae (April 2024).pdfHoldier Curriculum Vitae (April 2024).pdf
Holdier Curriculum Vitae (April 2024).pdf
 
fourth grading exam for kindergarten in writing
fourth grading exam for kindergarten in writingfourth grading exam for kindergarten in writing
fourth grading exam for kindergarten in writing
 
Paris 2024 Olympic Geographies - an activity
Paris 2024 Olympic Geographies - an activityParis 2024 Olympic Geographies - an activity
Paris 2024 Olympic Geographies - an activity
 
Beyond the EU: DORA and NIS 2 Directive's Global Impact
Beyond the EU: DORA and NIS 2 Directive's Global ImpactBeyond the EU: DORA and NIS 2 Directive's Global Impact
Beyond the EU: DORA and NIS 2 Directive's Global Impact
 
Introduction to Nonprofit Accounting: The Basics
Introduction to Nonprofit Accounting: The BasicsIntroduction to Nonprofit Accounting: The Basics
Introduction to Nonprofit Accounting: The Basics
 
Disha NEET Physics Guide for classes 11 and 12.pdf
Disha NEET Physics Guide for classes 11 and 12.pdfDisha NEET Physics Guide for classes 11 and 12.pdf
Disha NEET Physics Guide for classes 11 and 12.pdf
 
Mattingly "AI & Prompt Design: The Basics of Prompt Design"
Mattingly "AI & Prompt Design: The Basics of Prompt Design"Mattingly "AI & Prompt Design: The Basics of Prompt Design"
Mattingly "AI & Prompt Design: The Basics of Prompt Design"
 

Module 2

  • 1. Basic Statistics 2011 Module 2 Summation Notation and Use of the Calculator Objectives: At the end of the module, the students should be able to: 1. Determine the values of expressions using the summation notation 2. Utilize the calculator in evaluating expressions involving the summation notation The most common symbol in Statistics is the Greek letter sigma, ∑, which is used to denote summation. where i is the lower limit and n the upper limit. In some cases, the subscript i can be omitted. Examples: Let x1=6, x2=9, x3=10, x4=8, and x5=5. Find: a) b) c) d) e) Solution: a. Since lower and upper limits are stated, For b to e, no limits are specified, hence all values should be considered. b. c. d. e. SRSTHS 1
  • 2. Basic Statistics 2011 How to Use your Scientific Calculator* *Caution: The procedure may not apply to all calculator models, thus, you may just consult your calculator’s manual. For data involving one variable, activate the STAT 0 or STAT 1 mode or its equivalent. 1. Set your calculator in SD mode. Press Mode and choose STAT then SD. 2. Clear the Stat memory by pressing 2nd F or Shift then CLR, or AC, or CA. 3. Start entering data. Using the data in the example above X1 X2 X3 X4 X5 6 9 10 8 5 Press 6 DATA 9 DATA 10 DATA 8 DATA 5 DATA 4. To get , press RCL then the key where is. It should display the same answer given above. The same applies to getting . 5. You can also get other measurements like the mean ( and standard deviation (sx) by pressing RCL then the key where or sx is, respectively. For data involving two variables, activate the STAT 1 or STAT LINE mode or its equivalent. 1. Press MODE then STAT then LINE. 2. Clear the Stat memory. 3. Start entering data. Use the data below. X 3 5 4 8 9 y 12 15 16 11 13 Press 3 (x,y) 12 5 (x,y) 15 4 (x,y) 16 8 (x,y) 11 9 (x,y) 13 4. Press RCL then the key where the data you intend to get is placed. RCL Did you get 29? RCL 67? RCL What did you get? SRSTHS 2
  • 3. Basic Statistics 2011 How about… 1. 2. 3. 4. 5. sy 6. sx Exercise: A. The following are the number of minutes it took 10 students to answer a 10-item quiz in Algebra. Student Number 1 2 3 4 5 6 7 8 9 10 Number of Minutes (m) 10 5 15 20 8 19 25 30 17 11 Find: 1. 2. 3. 4. 5. B. The following table shows the 2nd quarter grades of 10 students in English and Geometry. English (x) 91 88 78 85 83 90 89 86 89 88 Geometry(y) 87 86 80 89 85 86 89 87 85 83 Find: 1. 2. 3. 4. 5. 6. 7. 8. 9. 10. 11. 12. 13. SRSTHS 14. 15. 3