
Empfohlen
Weitere ähnliche Inhalte
Ähnlich wie Module PHY6002 Inorganic Semiconductor Nanostructures Lectur.docx
Ähnlich wie Module PHY6002 Inorganic Semiconductor Nanostructures Lectur.docx (20)
Mehr von moirarandell
Mehr von moirarandell (20)
Kürzlich hochgeladen
Kürzlich hochgeladen (20)
Module PHY6002 Inorganic Semiconductor Nanostructures Lectur.docx
- 1. Module PHY6002 Inorganic Semiconductor Nanostructures Lectures 7, 8, 9 and 10 1 Lecture 7 – The fabrication of semiconductor nanostructures I Introduction In this lecture we will look at the techniques used to fabricate semiconductor nanostructures. The well-established epitaxial methods used to produce quantum wells will be described. The main techniques applied to produce quantum wires and quantum dots will be discussed, with a comparison of their relative advantages and disadvantages. In the next lecture we will look in detail at the most successful technique used to produce quantum dots, self- organisation. Epitaxial techniques There are two well established epitaxial growth techniques used to produce high quality quantum wells: molecular beam epitaxy (MBE) and metal organic vapour phase epitaxy (MOVPE). The following figure shows the main components of an MBE reactor.
- 2. The reactor consists of an ultra-high vacuum chamber with a number of effusion cells, each containing a different element. Each cell has a mechanical shutter placed in front of its opening. In operation the cells are heated to a temperature where the elements start to evaporate, producing a beam of atoms which leave the cells. These beams are aimed at a heated substrate which consists of a thin wafer of a suitable bulk semiconductor. The incident beams combine at the surface of the substrate and a semiconductor is deposited atomic-layer by atomic-layer. The substrate is rotated to ensure even growth over its surface. By opening the mechanical shutters in front of certain cells it is possible to control which semiconductor is deposited. For example opening the shutters in front of the Ga and As cells results in the growth of GaAs. Shutting the Ga cell and opening the Al cell switches to the growth of AlAs. Because the shutters can be operated very rapidly in comparison to the rate at which material is deposited, it is possible to grow An MBE reactor Module PHY6002 Inorganic Semiconductor Nanostructures
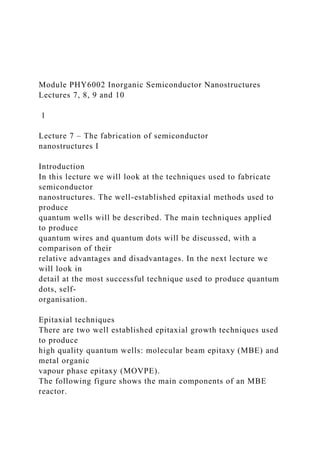
- 3. Lectures 7, 8, 9 and 10 2 very thin layers with very sharp interfaces between layers. The following figure shows a transmission electron microscope image of a quantum well sample containing five wells of different thicknesses. The thinnest well has a thickness of only 1nm. Other cells in the MBE reactor may contain elements used to dope the semiconductor and it is possible to monitor the growth as it proceeds by observing the electron diffraction pattern produced by the surface. The second epitaxial growth technique is metal organic vapour phase epitaxy (MOVPE). In this technique the required elements are carried, as a component of gaseous compounds, to a suitable chamber where they mix as the gases flow over the surface of a heated substrate. The compounds breakdown to deposit the semiconductor on the surface of the substrate with the remaining waste gases being removed from the chamber. Valves in the gas lines leading to the chamber allow the gases flowing into the reactor to be switched on and off. A suitable switching sequence allows layered structures to be deposited. Because it is difficult to switch a gas flow
- 4. quickly, and because the growth rate with MOVPE is faster than for MBE, the latter technique is generally capable of growing thinner layers with more abrupt interfaces. However the faster growth rate of MOVPE has advantages in commercial production where it is necessary to deposit the material as quickly as possible. MOVPE has a number of safety implications as the gases are highly toxic. The following figure shows a schematic diagram of the main components of a MOVPE system. A cross sectional transmission electron microscopy (TEM) image of an InGaAs- InP quantum well structure containing five wells of different thicknesses. Main components of a MOVPE system (From Davies) Module PHY6002 Inorganic Semiconductor Nanostructures Lectures 7, 8, 9 and 10 3 Requirements for semiconductor nanostructures Before we look at the various techniques that have been used to produce quantum wires and dots, it is useful to consider what properties ideal
- 5. structures should exhibit. This will help in analysing the relative advantages and disadvantages of each technique. The main requirements of a semiconductor nanostructure can be summarised as follows • Size. For many applications we require all the electrons and holes to be in their lowest energy state, implying negligible thermal excitation to higher states. The amount of thermal excitation is controlled by the ratio of the energy spacing between the confined states and the thermal energy, given by kT. At room temperature the thermal energy is 25meV and a rule of thumb is that the level separation should be at least three times this value (~75meV). As the spacing between the states is controlled by the size of the structure (see lecture 5 for the case of a quantum well) this places requirements on the size of the nanostructure. • Quality. Defects may increase the probability of carriers recombining non- radiatively. Structures with a large number of defects may be very inefficient light producers. For optical applications nanostructures with low defect numbers are required. • Uniformity. Devices generally contain a large number of nanostructures. Ideally all the nanostructures should be identical otherwise they
- 6. will all emit light at slightly different energies. • Density. It should be possible to produce dense arrays of nanostructures. • Growth compatibility. Industry uses MBE and MOVPE extensively. Nanostructures will find more applications if they can be produced using either or both of these techniques. • Confinement potential. The depth of the potential wells which confine the electrons and holes must be relatively deep. If this is not case then at room temperature carriers will be thermally excited out of the nanostructure. • Electron and/or hole confinement. For electrical applications it is generally only necessary for either electrons or holes to be trapped (confined) within the nanostructure. For electro-optical applications it is necessary for both types of carrier to be confined. • p-i-n structures. Many applications require the electrical injection of carriers into the nanostructure or the transfer of carriers, initially created in a nanostructure, to an external electrical circuit. This can be achieved if the nanostructure can be incorporated within the intrinsic region of a p-i-n structure.
- 7. Fabrication of semiconductor quantum wires and quantum dots Lithography and etching This starts with an epitaxially grown two dimensional system to provide confinement along the growth direction. Lithography (etch resist, optical lithography with a mask or electron beam lithography) is then used to define a pattern on the surface consisting of either wires or dots. These are subsequently etched using a plasma, resulting in free standing dots or wires. The structure can subsequently be returned to a growth reactor to be Module PHY6002 Inorganic Semiconductor Nanostructures Lectures 7, 8, 9 and 10 4 overgrown and incorporated in a p-i-n device. The main stages of this technique are shown in the following figure. The main disadvantage of this technique is that the surface is damaged during the etching stage. The resultant defects produce an optically dead layer where non- radiative recombination is the dominant electron-hole recombination process. This
- 8. dead layer has an almost constant width so becomes increasingly important as the size of the structure decreases. For the small sizes required for practical nanostructures the dead layer occupies all of the structure which is consequently optically dead. Cleaved edge overgrowth A quantum well is initially grown and then the sample is cleaved in the growth reactor along a plane parallel to the growth direction. The sample is then rotated through 90° and a second quantum well followed by a barrier is grown. The growth sequence is shown in the following figure. The two quantum wells form a T-shaped structure. At the intersection of the two wells the effective well width is slightly larger. Because the confined energy levels depend on the inverse of well width squared (see Lecture 5) the intersection region has a slightly lower potential and hence electrons and holes become trapped there – a quantum wire is formed. If during the initial growth multiple wells are grown then the overgrowth of the final well results in a linear array of wires. A second cleave followed by a further overgrowth can be used to produce quantum dots. The surfaces produced by cleaving are clean, in contrast to the dirty surface
- 9. formed by etching. Hence cleaved edge overgrowth dots and wires have a (a) (b) (c) (d)(a) (b) (c) (d) The main stages in forming lithographically defined dots. (a) growth of a 2D quantum well. (b) surface coating with etch resist. (c) exposure of resist to form pattern (d) etching to form dot or wire. (a) (b) (c) (d)(a) (b) (c) (d) The steps involved in the cleaved edge overgrowth of a quantum wire. (a) initial quantum well growth (b) cleavage to form a perfect surface (c) rotation (d) growth of the second quantum well. Module PHY6002 Inorganic Semiconductor Nanostructures Lectures 7, 8, 9 and 10 5 high optical quality. Their main disadvantage is that the potential at the intersection of the wells is not much smaller than in the wells. The carriers are only weakly confined in the intersection region and at room temperature their thermal energy is sufficient to allow them to escape. These structures are
- 10. therefore generally suitable for studying physics at low temperatures but not for device applications, which need to work at room temperature. In addition the cleaving step is a difficult, non-standard process. Growth on Vicinal Substrates Semiconductors are crystalline materials with a periodic structure. Only when a semiconductor crystal is cut in certain directions will it have a flat surface. For other directions the surface will consists of a series of steps (think about a brick wall). Epitaxial growth is usually performed on flat surfaces. However the use of stepped surfaces (so-called vicinal surfaces) can be used to produce quantum wires. The size of the steps is determined by the direction along which the surface is formed but are typically ~20nm or less. The above figure shows the main steps in the growth of vicinal quantum wires. Starting with the stepped surface (a) the wire semiconductor is initially deposited epitaxially (b). Growth tends to occur in the corner of the steps as it here that the highest density of atomic bonds occurs. As the growth proceeds the semiconductor spreads out from the initial corner. When approximately half of the step width has been covered growth is switched to the barrier material (c) which is used to cover the remainder of the step. Growth can then
- 11. be switched back to the wire semiconductor to increase the height of the wire (d). This growth cycle is repeated until the desired vertical height is obtained. Finally the wire is overgrown with a thick layer of the barrier material (e). Although very thin wires can be produced using this technique the growth has to be very well controlled so that exactly the same fraction of the step is covered during each cycle. In addition the coverage on different steps varies and it is difficult to ensure that the original steps are uniform. The resultant wires tend not to exhibit good uniformity. Growth on patterned substrates This starts with a flat semiconductor substrate which is coated with an etch resist and then exposed using either optical or electron beam lithography to produce an array of parallel stripes. The regions between the stripes are then etched in a suitable acid. Because the acid etches different crystal directions at different rates, a v-shaped groove is obtained. The patterned substrate is then cleaned and transferred to a growth reactor. (a) (b) (c) (d) (e)(a) (b) (c) (d) (e) The main steps in the growth of vicinal quantum wires (a) original stepped surface (b) growth occurs in corners of steps, sufficient material deposited to cover ~1/2 of step (c) remainder of step filled in with first material (d) more wire material
- 12. deposited to increase thickness of wire (e) final over growth of wire. Module PHY6002 Inorganic Semiconductor Nanostructures Lectures 7, 8, 9 and 10 6 Quantum wires are usually formed from GaAs, with AlGaAs as the barrier material. Initially the AlGaAs barrier is deposited. This grows uniformly over the whole structure and may sharpen the bottom of the groove which, after the etching, has a rounded profile. Next a thin layer of GaAs is deposited. Although this again grows over the whole surface, the growth rate at the bottom of the groove is faster than that on the sides of the grooves due to the different crystal surfaces. A quantum well is formed with a spatial modulation of its thickness, being thicker at the bottom of the groove. In a similar manner to cleaved edge overgrowth, this thicker region results in a potential minimum forming a quantum wire. A second AlGaAs barrier layer can now be grown; this re-sharpens the groove after the formation of the wire, after which further wires can be grown. The main steps of this technique, resulting in v-groove quantum wires, are shown in the above figure.
- 13. The following figure shows a cross sectional transmission electron microscope image of a multiple v-groove quantum wire structure. The wires have a crescent cross section. (a) (b) (c) (d) The main steps in the formation of v-groove quantum wires (a) original patterned substrate, (b) growth of barrier semiconductor (c) growth of wire semiconductor, greater growth at bottom of groove (d) growth of second barrier, re-sharpening of groove. A cross sectional transmission electron micrograph of three v- groove quantum wires. The wires have a maximum thickness of approximately 8nm. Module PHY6002 Inorganic Semiconductor Nanostructures Lectures 7, 8, 9 and 10 7 Because the quantum wire is not next to the original etched surface, v-groove quantum wires exhibit good optical efficiencies. However it is difficult to control the inplane size of the wires as this is mainly determined by the shape
- 14. of the groove. The uniformity of the wire along its length is also influenced by the original groove quality. For achievable wire sizes the energy level spacings are typically 20~30meV, some what less than required for room temperature operating devices. However in some cases careful control of the groove cross-section has lead to slightly larger level spacings. A further disadvantage of v-groove quantum wires is their complicated structure. In addition to the wire there are quantum wells formed on the sides of the groove (side wall wells) and on the region between the grooves (top wells). These wells may capture carriers, reducing the fraction which recombine in the wire and also producing additional features in the emission spectra. Although the top wells and some of the side wells can be removed by etching after growth this requires a further fabrication step and the structure may need to be returned to the reactor to complete the growth of a p-i-n structure. By initially patterning the substrate not with a single array of stripes but with two perpendicular arrays to give a two dimensional array of squares, the subsequent etching forms an array of pyramidal shaped pits. Epitaxial growth now results in the formation of quantum dots at the bottom of each pit. Strain induced dots and wires
- 15. If a semiconductor is subjected to strain its band structure is modified. In particular by applying the correct sign of strain the band gap may be reduced. If strain is only applied to a small region of the semiconductor then a local reduction of the band gap may occur, resulting in the formation of a wire or dot. In practise a local strain is produced by depositing a thin layer of a different material (e.g. carbon) on the surface of the semiconductor. This will have a very different atomic spacing to the semiconductor so to fit together both the atomic positions in the carbon layer and the surface region of the semiconductor will alter. This alteration constitutes a strain. If the carbon layer is patterned by lithography and then etched to leave only stripes or dots, the local strain field produces a wire or dot in the underlying semiconductor. The remaining isolated pieces of carbon are known as stressors. It is necessary to place a quantum well near to the surface of the semiconductor to provide confinement along the growth direction. The steps in the production of strain induced dots and wires are shown in the following figure. (a) (b) (c)(a) (b) (c) Steps in the formation of strain induced nanostructures (a) initial quantum well (b) deposition of carbon layer (c) formation of stressors by
- 16. lithography and etching. The resultant, localised strain field (dashed lines) forms a wire or dot in the quantum well. Module PHY6002 Inorganic Semiconductor Nanostructures Lectures 7, 8, 9 and 10 8 Although this technique involves an etching step, only the carbon layer is etched, the etching is kept away from the optically active quantum well. Hence defect formation is not a problem as is the case for the etched dots and wires described above. However the strain fields only produce a weak modulation of the band gap and so the confinement potential is relatively small. At room temperature carriers are thermally excited from the dots or wires. Electrostatically induced dots and wires If a thin metal layer is deposited on the surface of a semiconductor (a Schottky contact) then a voltage can be applied between the metal and the semiconductor. This voltage has the effect of either raising or lowering the energies of the conduction and valence bands near the surface, with respect to their energies deeper in the semiconductor. If the bands are
- 17. raised then a potential minimum is created for holes near to the surface. Alternatively if the bands are lowered a potential minimum for electrons is created. This is shown in the following figure. If the metal layer used to make the Schottky contact is patterned using lithography and etching, then the resultant shapes can be used to locally modulate the conduction and valence bands, forming quantum wires or quantum dots. An added sophistication is to form two slightly separated metal strips on the semiconductor surface, a so-called split gate. By applying appropriate voltages a potential minimum is created in the region between the gates, the width of which is determined by the size of the applied voltage. Hence a wire of variable width is created. Electrostatically induced nanostructures form clean systems as only the metal needs to be etched, not the semiconductor. However the potential minima are not very deep and the spacing between the energy levels is small, they are hence only suitable for low temperature operation. Their main limitation however is that only electrons or holes are confined in a given structure, they are hence not suitable for optical applications. V
- 18. V The effect of applying a voltage to a Schottky contacted semiconductor Module PHY6002 Inorganic Semiconductor Nanostructures Lectures 7, 8, 9 and 10 9 Quantum well width fluctuations The width of a quantum well is not constant but exhibits a spatial fluctuation (see the following figure). Because the confined energy levels depend upon the well width, potential minima are formed for electrons and holes at points where the well width is above its average value. These fluctuations confine the carriers within the plane of the dot (the well provides confinement along the growth direction) to give a quantum dot. Although these dots have good optical properties their confining potential is very small, as are the spacings between the confined levels. The inplane size of the dots is virtually impossible to control (the well width fluctuations are essentially random) and the spread of dot sizes is very large. These dots have no device prospects.
- 19. Thermally annealed quantum wells A GaAs-AlGaAs well is grown using standard epitaxial techniques. A very finely focussed laser beam is then used to locally heat the surface. This produces a diffusion of Al from the AlGaAs into the GaAs well, causing an increase in the band gap. By scanning the beam round the edges of a square a potential barrier is produced surrounding the unilluminated centre of the square. Carriers optically excited within this square are confined by the potential barrier and the quantum well, forming a quantum dot. Quantum wires can also be formed by scanning the laser beam along the edges of a rectangle. Because the minimum size of the focussed laser beam is ~1µm the minimum size of the dots is fairly large (~100nm). This results in very closely spaced energy levels and, in addition, the annealing processes can affect the optical quality of the semiconductor. This technique also requires specialised, non-standard equipment. Semiconductor nanocrystals Very small semiconductor particles, which act as quantum dots, can be formed in a glass matrix by heating the glass with a small percentage of a suitable semiconductor. Dots with radii between 1~40nm are formed, the radius being a function of the temperature and heating time. The
- 20. main limitation of these dots is that, because they are formed in an insulating glass matrix, the electrical injection of carriers is not possible. Quantum well width fluctuations. The electrons and holes are localised in regions where the well width is above its average value (blue dashed line). Module PHY6002 Inorganic Semiconductor Nanostructures Lectures 7, 8, 9 and 10 10 Colloidal quantum dots These are formed by injecting organometal reagents into a hot solvent. Nanoscale crystallites grown in the solution with sizes in the range 1~10nm. Subsequent chemical and physical processing can be used to select a subset of the crystallites with good size uniformity. The dots are formed from II-IV semiconductors, including CdS, CdSe and CdTe. The dots exhibit good optical properties but as they are free standing the electrical injection of carriers is not possible. Summary and conclusions In this lecture we have looked briefly at the two established
- 21. epitaxial techniques (MBE and MOVPE) used to grow two dimensional quantum wells. We then considered the main requirements for the properties of semiconductor nanostructures, before discussing the various techniques which have been developed to produce quantum wires and quantum dots. Of the techniques used to produce wires the most important are the v-groove and electrostatic induced ones. Only the former technique has been applied to room temperature device applications (mainly lasers) although it still has a number of disadvantages. For quantum dots, growth on patterned substrates, strain induced structures, electrostatic induced structures, quantum well width fluctuations, quantum well thermal annealing and colloidal dots have all been used to study physics in zero-dimensional systems (generally at very low temperatures). However none of these techniques has so far been suitable for room temperature device applications. We will see in the next lecture that self- organised techniques come the closest to producing ideal dots. Further reading The epitaxial techniques of MBE and MOVPE are discussed in Davies ‘The Physics of Low-Dimensional semiconductors’. Bimberg, Grundmann and Ledentsov ‘Quantum Dot Heterostructures’ discuss some of the requirements for semiconductor nanostructures. Some of the numerous
- 22. fabrication techniques developed to produce wires and dots are described in the previously mention books and in the book by Weisbuch and Vinter ‘Quantum Semiconductor Structures’ More information can be obtained from a number of research papers. Suggestions are • A close look on single quantum dots, A Zrenner, Journal of Chemical Physics Volume 112 page 7790 (2000). Provides an overview of many of the techniques used to prepare quantum dots. Many useful references. • Photoluminescence from a single GaAs/AlGaAs quantum dot, K Brunner et al Physical Review Letters Volume 69 Page 3216 (1992). Thermally annealed dots. • Quantum size effect in semiconductor microcrystals, A Ekimov et al Solid State Communications Volume 56 Page 921 (1985). Semiconductor nanocrystals. • Luminescence from excited states in strain induced InGaAs quantum dots, H Lipsanen et al, Physical Review B Volume 51 page 13868 (1995). Strain induced dots.
- 23. Module PHY6002 Inorganic Semiconductor Nanostructures Lectures 7, 8, 9 and 10 11 • One-dimensional conduction in the two-dimensional electron gas in a GaAs-AlGaAs heterojunction, T J Thornton et al, Physical Review Letters Volume 56 Page 1198 (1986). Electrostatically induced wires. • Synthesis and characterisation of nearly monodispersive CdE (E=S, Se, Te) semiconductor nanocrystallites, C B Murray et al, Journal of the Americal Chemical Society Volume 115 Page 8706 (1993). Colloidal quantum dots. • Formation of a high quality two-dimensional electron gas on cleaved GaAs, L N Pfeiffer et al, Applied Physics Letters Volume 56 Page 1697 (1990). Cleaved edge overgrowth of quantum wires. • Patterned quantum well heterostructures grown by OMCVD on non-planar substrates - applications to extremely narrow SQW lasers, R Bhat et al Journal of Crystal Growth Volume 93 Page 850 (1988). V- groove quantum wires. • Molecular beam epitaxy growth of tilted GaAs AlAs
- 24. superlattices by deposition of fractional monolayers on vicinal (001) substrates, J M Gaines et al, Journal of Vacuum Science and Technology B Volume 6 Page 1381 (1988). Growth of quantum wires on vicinal surfaces. • Self-limiting growth of quantum dot heterostructures on nonplanar {111}B substrates, A Hartmann et al Applied Physics Letters Volume 71 Page 1314 (1997). Growth of quantum dots on patterned substrates. • Homogeneous linewidths in the optical spectrum of a single gallium arsenide quantum dot, D Gammon et al, Science Volume 273 Page 87 (1996). Dots formed from quantum well width fluctuations. Module PHY6002 Inorganic Semiconductor Nanostructures Lectures 7, 8, 9 and 10 12 Lecture 8 – The fabrication of semiconductor nanostructures II Introduction In this lecture we will look at the most successful technique developed so-far to fabricate semiconductor quantum dots – self-assembly. The use of this
- 25. technique will be described and some of the properties of resultant dots will be discussed. The growth of strained semiconductor layers Generally when growing quantum wells it is arranged that the well, barrier and substrate semiconductors have the same atomic spacing (lattice constant). For example GaAs and AlGaAs have almost identical lattice constants. GaAs quantum wells with AlGaAs barriers can therefore be grown on GaAs substrates. If we try to grow a semiconductor which has a very different lattice constant to that of the substrate, then initially it adjusts its lattice constant to fit that of the substrate and the semiconductor will be strained. However to strain a material requires energy. Hence as the thickness of the semiconductor increases energy will build up. Eventually there is sufficient energy to break the atomic bonds of the semiconductor and dislocations (a discontinuity of the crystal lattice) form. Beyond this point the semiconductor can grow with its own lattice constant, strain energy no longer builds up. The thickness of semiconductor which can be grown before dislocations form is known as the critical thickness. The critical thickness is a function of the semiconductor being grown and also the degree of lattice mismatch between this semiconductor and the underlying semiconductor or substrate.
- 26. Dislocations provide a very efficient mechanism for non- radiative carrier recombination. Hence a structure which contains dislocations will, in general, have a very poor optical efficiency. When growing strained semiconductor layers it is therefore important not to exceed the critical thickness. A good example of a strained semiconductor system is InxGa1- xAs-GaAs. When growing quantum wells InxGa1-xAs forms the wells, as it has the smaller band gap, with GaAs forming the barriers. As the In composition of InxGa1-xAs increases the lattice mismatch between InxGa1-xAs and GaAs also increases. Because InxGa1-xAs-GaAs quantum wells are generally grown on a GaAs substrate the InxGa1-xAs wells are strained to fit the GaAs lattice constant. For low In compositions (x~0.2) it is possible to grow quantum wells with thicknesses up to a few 10s nm before the critical thickness is reached. However for higher x the critical thickness decreases rapidly. Self-assembled growth of quantum dots The lattice mismatch between InAs and GaAs is very large (7%) and the critical thickness for the growth of an InAs layer on GaAs is expected to be very small (of the order of a few atomic layers). When InAs is first deposited on GaAs it grows as a highly strained, flat layer (two dimensional growth). However for certain growth conditions before dislocations start
- 27. to form the growth changes to three dimensions in the form of small islands. These islands form the quantum dots and sit on the original two dimensional layer, which is known as the wetting layer. Module PHY6002 Inorganic Semiconductor Nanostructures Lectures 7, 8, 9 and 10 13 This behaviour in which the growth transforms from two to three dimensional is known as the Stranski-Krastanow growth mode. It is caused by a trade off between elastic and surface energy. All surfaces have an associated energy because of their incomplete atomic bonds. The surface energy is directly proportional to the area of the surface. Hence the surface after the islands start to form has a greater energy than the original flat surface. However within the islands the lattice constant of the semiconductor can start to shift back to its bulk value, hence reducing the elastic energy (note this shift is gradually and increases with distance along the growth direction, there are no dislocations formed - see following figure). Because the reduction in elastic energy is greater than the increase in surface energy the transformation to
- 28. three dimensional growth represents the lowest energy, and hence most favourable, state. Following the growth of the dots they are generally overgrown by the barrier semiconductor GaAs. The following figure shows the main steps in the formation of self-assembled quantum dots. InAs GaAs (a) (b) (c) (d) InAs GaAs (a) (b) (c) (d) LHS - change in the lattice spacing for atoms in a self- assembled quantum dot. RHS the main stages in the formation of a self assembled dot:
- 29. (a) GaAs substrate (with buffer layer), (b) initial 2D growth of InAs (c) transformation above critical thickness to 3D island-like growth (d) over growth of dots with GaAs. Module PHY6002 Inorganic Semiconductor Nanostructures Lectures 7, 8, 9 and 10 14 The Physical Properties of Self-Assembled Dots The physical properties of self assembled dots (e.g. size, shape and density) depend to some extent on the conditions used to growth them (e.g. temperature and growth rate). Typically they have a base size between 10~30nm, a height of 5~20nm and a density of 1x10¹⁰~1x1012cm-2. However values outside this range may be possible by carefully controlling the growth conditions. Because of their small size the energy separation between their confined levels is relatively large (40~70meV). They contain no dislocations and so exhibit excellent optical properties. They have a high two dimensional density and multiple layers can be grown (see below). They are grown entirely by an epitaxial process and can easily be incorporated within the intrinsic region of a p-i-n structure. Their confinement potential is relatively deep (100-
- 30. 300meV) and both electrons and holes are confined. Uniformity is reasonable but could be better (see below). The following figure shows a cross-sectional transmission electron microscope (TEM) image of a typical quantum dot. This is a bare dot which has not been over grown with GaAs (it is difficult to obtain similar images of over grown dots as there is very little contrast between InAs and GaAs in the TEM images). The following figure shows an AFM image of quantum dot sample. Again the dots have not been overgrown with GaAs. A cross-sectional TEM image of an InAs quantum dot grown on GaAs. The base of the dot is approximately 18nm. An AFM image of a quantum dot sample. Note the exaggerated vertical scale. Module PHY6002 Inorganic Semiconductor Nanostructures Lectures 7, 8, 9 and 10 15 The shape and composition of self assembled quantum dots Although extensively studied there is still considerable uncertainty as to the
- 31. precise shape of self assembled quantum dots. Various shapes have been claimed including pyramids, truncated pyramids, cones and lenses (part of a sphere). One problem in determining the shape is that it is difficult to study dots which have been overgrown. Although bare dots can be studied using AFM and related surface techniques, there is some evidence that the dot shape may change when they are overgrown. It may be that the shape of self assembled quantum dots depends upon the precise growth conditions. A further complication is the composition of the dots. The dots can either be grown using pure InAs or the alloy InGaAs. However even when grown with InAs there is evidence that the dots consist of InGaAs indicating the diffusion of Ga into the dots from the surrounding GaAs. The Ga composition in the dots is unlikely to be uniform leading to a highly complicated system which is difficult to model theoretically (see below). Multiple quantum dot layers Once one layer of dots has been deposited and overgrown with GaAs a flat surface is formed upon which a second layer can be deposited. It is hence possible to grow multiple layers of dots. When the first dot layer is deposited the positions of the dots are reasonably random. As the InAs in the dots gradually returns to its bulk lattice constant as the dot height
- 32. increases, the initial GaAs deposited on top of the dot will be slightly strained. A strain field will be produced in the GaAs above each dot, although this will gradually decrease to zero as the thickness of the GaAs is increased. However if, when the next dot layer is deposited, these strain fields are still present (only a thin GaAs layer has been grown) they may act as nucleation sites for the next layer of dots. In this case the dots are vertically aligned and stacks of aligned dots may be formed with 10 or more dots in a stack. This alignment only occurs when successive dot layers are separated by very thin GaAs layers (<10nm). For thicker GaAs layers the strain field is essentially zero when the next layer is deposited and the dots form at random positions. The following figure shows a cross sectional transmission electron microscope image of a sample containing 10 dot layers with each layer separated by 9nm of GaAs. The vertical alignment of the dots into stacks can be clearly seem. This alignment may be important for the electronic and optical properties as it is possible that electrons and holes may be able to move between the dots in a stack. A cross sectional TEM image of vertically aligned quantum dots.
- 33. Module PHY6002 Inorganic Semiconductor Nanostructures Lectures 7, 8, 9 and 10 16 Dot uniformity The growth of self assembled dots is a semi-random process. Dots at different positions on the surface will start to form at slightly different times as the amount of InAs deposited will not be totally uniform. This results in the final shape and size (and possibly composition) varying slightly from dot to dot. As the energies of the confined energy states are a function of the dot size, shape and composition these will also vary from dot to dot. The emission from a single dot will consist of a very sharp line (similar to the emission from an atom). However most experiments on self assembled quantum dots probe a large number of dots. For example a typical photoluminescence experiment will use a laser beam focussed to a diameter of 250µm. If the dot density is 1x1011cm-2 the area of the laser beam will contain ~50 million dots, each of which will contribute to the measured spectrum. As each dot will emit light at a slightly different energy the sharp emission from each dot will merge into a broad, featureless emission. This is
- 34. known as inhomogeneous broadening. Only if the number of dots probed can be reduced significantly (e.g. by reducing the diameter of the laser beam - see later lectures) will the individual sharp emission lines be observed. The non-uniformity of self-assembled quantum dots and the resultant inhomogeneous broadening of the optical spectra is a disadvantage for a number of potential device applications. For example the absorption is spread out over a wide energy range instead of being concentrated at a single energy. The inhomogeneous broadening also complicates fundamental physics studies; as will be discussed in later lectures. However there are some applications (e.g. optical memories) which make use of the inhomogeneous broadening. The following figure shows photoluminescence spectra of different numbers of quantum dots. This is achieved by evaporating an opaque metal mask on the sample surface in which holes of different sizes are formed. By shining the laser beam through these different size holes, different numbers of dots can be probed. Photoluminescence spectra of different numbers of quantum dots. From Gammon MRS Bulletin Feb. 1998 Page 44
- 35. Module PHY6002 Inorganic Semiconductor Nanostructures Lectures 7, 8, 9 and 10 17 Theoretical modelling of self-assembled quantum dots Self assembled quantum dots have a high degree of strain and this strain is non-uniform. In addition they have a complicated shape. This makes the calculation of the confined energy levels very difficult. The following figures show the distribution of strain, calculated for pyramidal shaped dots, and the shapes of the wavefunctions for the lowest energy electron and hole states. As we will see in later lectures the optical spectra of the quantum dots are very complicated and difficult to interpret. Hence it is still not possible to test the predictions of the various available theoretical models. In addition many of the input parameters required for the models (e.g. the exact dot size, shape and composition) are still not well known. The strain distribution in self assembled quantum dots: (a) through the wetting layer, (b) through the dot. From Stier et al PRB 59, 5688 (1999).
- 36. Electron and hole wavefunctions for the lowest energy confined quantum dot states. From Stier et al ibid. Module PHY6002 Inorganic Semiconductor Nanostructures Lectures 7, 8, 9 and 10 18 Different self assembled quantum dot systems The most commonly studied self assembled system consists of InAs or InGaAs dots grown within a GaAs matrix. The band gap of bulk InAs is 0.4eV but quantum confinement and strain increase this to between 0.95 and 1.4eV, the precise value being dependent on the shape and size of the dots. This energy range correspond to wavelengths 1300~900nm, which is in the near infrared region of the electromagnetic spectrum. The emission energy can be increased if InAs or InGaAs dots are grown in an AlGaAs matrix. This allows energies up to ~1.8eV (≡690nm) to be obtained. Al can also be added to the dots to increase their emission energy (AlInAs- AlGaAs dots). Self assembled dots have also been fabricated from other semiconductor combinations where there is sufficient lattice mismatch. Examples include InP
- 37. dots in GaInP (emission energy ~1.6-1.9eV [~775-650nm]), Ge dots in Si and InSb, GaSb or AlSb dots in GaAs (emission energy ~1.0-1.3eV [~1200- 950nm]). More recently there have been attempts to grow dots in the wide band gap nitride semiconductors GaN, InN and AlN. Summary and Conclusions In this lecture we have looked at the most promising method for producing quantum dots suitable for electro-optical applications. The main properties of quantum dots prepared using the self-assembly technique are compared with other types of dots and wires in the following table. Self- assembled dots satisfy the majority of requirements for device applications, possibly with the exception of uniformity. As we will see in later lectures, a number of devices based on self assembled quantum dots have now been demonstrated. Further reading 'Quantum Dot Heterostructures' by Bimberg et al provides a comprehensive overview of the self-assembly technique including a discussion of optical, electrical and structural studies and devices based on these quantum dots.
- 38. Module PHY6002 Inorganic Semiconductor Nanostructures Lectures 7, 8, 9 and 10 19 Fa br ic at io n te ch ni qu e S pa ci n g of en er gy
- 60. le hi gh - s em i co nt ro lla bl e Y es hi gh ye s ye s Module PHY6002 Inorganic Semiconductor Nanostructures Lectures 7, 8, 9 and 10
- 61. 20 Lecture 9 – Modulation doping and transport phenomena in semiconductor nanostructures Introduction Using a technique known as modulation doping it is possible to obtain extremely high carrier mobilities in semiconductor nanostructures. This has a number of practical applications and also leads to the observation of a number of highly novel transport related phenomena. Modulation Doping We saw in Lecture 2 that in a bulk semiconductor the carrier mobility is limited by phonon scattering at high temperatures and scattering from charged impurity atoms at low temperatures. The temperature dependence of the electrical mobility hence has the following form. Although the low temperature mobility can be increased by reducing the impurity density this lowers the electrical conductivity as it is these impurities which provide the free carriers (doping). In a semiconductor nanostructure however it is possible to spatially separate the dopant atoms and the resultant free carriers, significantly reducing this scattering mechanism. This leads to very high low temperature carrier
- 62. mobilities. This arrangement, which is known as remote or modulation doping, is shown schematically for n-type doping of a quantum well in the following figure. In this case the donor atoms are placed only in the wider band gap barrier material, the quantum well is undoped1. However the electrons released by the donor atoms in the barrier transfer into the lower energy well states, resulting in a spatial separation of the free electrons and the charged donor atoms. The confined electrons in the quantum well are said to form a two-dimensional electron gas (2DEG); a two-dimensional hole gas can similarly be formed by doping the barriers p-type. The non-zero charge 1 This is simply achieved during MBE growth by only opening the shutter in front of the cell containing the dopant atoms during growth of the barriers. In MOVPE the gas carrying the dopant atoms is similarly switched. M ob ili ty Temperature Phonon scattering
- 63. Impurity scattering M ob ili ty Temperature Phonon scattering Impurity scattering Temperature dependence of electrical mobility for a semiconductor Module PHY6002 Inorganic Semiconductor Nanostructures Lectures 7, 8, 9 and 10 21 present in both the barriers and the well2 adds an electrostatic potential energy which results in a bending of the band edges, as indicated in figure (b). This band bending allows the formation of a modulation doping induced 2DEG at a single interface (a single heterojunction) between two different
- 64. semiconductors, as shown in figure (c). Here the combined effects of the conduction band offset and the band bending result in the formation of a triangular shaped potential well which restricts the motion of the electrons to two dimensions. In a modulation doped structure the barrier region immediately adjacent to the well is generally undoped, forming a spacer layer, which further separates the charged dopant atoms and the free carriers. By optimising both the width of this spacer layer and the structural uniformity of the interface, and by 2 The total charge of the structure remains zero but there are equal and opposite charges in the well and barriers. (a) (b) (c) Donor atom Free electron (a) process of n-type modulation doping in a quantum well, (b) as (a) but also showing the effects on the band edges of the non-zero space charges, (c) modulation doping of a single heterostructure. 0.1 1 10 100 1
- 65. 10 100 1000 1980 1982 1989 GaAs-AlGaAs single heterojunctions Clean bulk GaAs Bulk GaAs El ec tro n M ob ili ty (c m 2 V
- 66. -1 s-1 ) Temperature (K) Temperature dependence of the mobility of bulk GaAs (standard and clean) and three GaAs- AlGaAs single heterostructures (numbers give the corresponding years). Data taken from Stanley et al (Appl. Phys. Lett. 58, 478 (1991)) and Pfeiffer et al (ibid 55, 1888 (1989)) Module PHY6002 Inorganic Semiconductor Nanostructures Lectures 7, 8, 9 and 10 22 minimising unintentional background impurities, it is possible to achieve extremely high low temperature mobilities. The previous figure compares the temperature variation of the electron mobility of standard bulk GaAs, a very clean bulk specimen of GaAs and a series of GaAs-AlGaAs single heterojunctions. At high temperatures, where mobility is limited by phonon scattering, the mobilities of the different structures are very similar. At low temperatures the mobility of bulk GaAs is increased in the cleaner material
- 67. where a lower impurity density reduces the charged impurity scattering. However the absence of doping results in a low carrier density and, as a consequence, a low electrical conductivity. It is therefore not possible to achieve both a high conductivity and high mobility in a bulk semiconductor. Modulation doping however results in both high free carrier densities and low temperature mobilities more than two orders of magnitude larger than those of clean bulk GaAs and almost four orders of magnitude larger than ‘standard’ bulk GaAs. The data for the different heterojunctions presented in the figure demonstrates how the low temperature mobility of a single heterojunction has increased over time, reflecting optimisation of the structure, the use of purer source materials and cleaner MBE growth reactors. The ability to produce 2DEGs of extremely high mobility has allowed the observation of a range of interesting physical processes, a number of which will be discussed later in this lecture and the following lecture. Modulation doping is now used extensively to provide the channel of field effect transistors (FETs), particularly for high frequency applications. Such devices are known as high electron mobility transistors (HEMTs) or modulation doped field effect transistors (MODFETs). Although the use of modulation doping provides negligible enhancement of the room
- 68. temperature carrier mobility, the free carriers are confined to a two dimensional sheet in contrast to a layer of non-zero thickness for conventional doping. This precise positioning of the carriers results in devices exhibiting more linear characteristics and, for still unclear reasons, these devices also exhibit lower noise. III-V semiconductor HEMTs or MODFETs operating up to ~300GHz are achievable with applications including mobile communications and satellite signal reception. The Hall effect in bulk semiconductors The following figure shows the geometry used to study the Hall effect. A current Ix flows along a semiconductor bar to give a current density Jx (=Ix/wh). A magnetic field B applied normal to the axis of the bar produces a magnetic force on each moving charge carrier given by qvB, where q is the charge and v the carrier drift velocity. This force causes the carrier motion to be deflected in a direction perpendicular to both the field and the original motion as shown in the figure. As a consequence of this deflection there is a build up of the charge carriers, and hence a non-zero space charge, along the side of the bar, which results in the creation of an electric field along the y-axis, Ey. This so-called Hall field produces an electrostatic force (qEy) on the charge carriers
- 69. which opposes the magnetic force. Equilibrium is quickly reached where the two forces balance to give a zero net force. /( ) / 1/( )y y x y x HqE qvB E vB J B nq or E J B nq R= ⇒ = = = = Module PHY6002 Inorganic Semiconductor Nanostructures Lectures 7, 8, 9 and 10 23 where the last step follows from the relationship Jx=nqv (see Lecture 2). The ratio Ey/(JxB) is known as the Hall coefficient and has a value 1/(nq). As Ey produces a voltage between the sides of the bar, given by Vy=wEy, all three quantities Ey, Jx and B are easily determined allowing RH and hence the product nq to be found. A Hall measurement of a bulk semiconductor hence allows the carrier density n to be determined as well as the majority carrier type (electrons or holes) from the sign of RH. The Quantum Hall Effect The Hall effect can also be observed in a nanostructure containing a 2DEG. Experimentally the electric field along the sample, Ex, can also be determined
- 70. by measuring Vx as shown in the previous figure. This allows two resistivities to be determined, defined as: ρ ρxx x x xy y x E J E J = = Because RH=Ey/(BJx), for a bulk semiconductor ρxy=RHB, which increases linearly with increasing magnetic field, with ρxx remaining constant. However for a two-dimensional system a very different behaviour is observed, as shown in the following figure. In this case although ρxy increase with increasing field, it does so in a step-like manner. In addition ρxx oscillates between zero and non-zero values, with zeros occurring at fields
- 71. where ρxy forms a plateau. This surprising behaviour of a two-dimensional system is known as the Quantum Hall effect and was discovered in 1980 by Klaus von Klitzing, for which he was awarded the 1985 Nobel Physics Prize. The Quantum Hall effect arises as a result of the form of the density of states of a two-dimensional system in a magnetic field. This corresponds to that of a fully quantised system, with quantisation in one direction resulting from the physical structure of the sample and quantisation in the remaining two directions provided by the magnetic field. Diagram (a) of the following figure shows the discrete energy levels for a perfect system. However in any real system the levels are broadened by carrier scattering events and the energy levels have the form given by the right hand diagrams. These ‘bands’ of states VXVY IX JX B w h Ex Ey
- 72. The geometry of the Hall effect 0 1 2 3 4 5 6 7 8 9 0 2000 4000 6000 8000 10000 12000 14000 ρ XY resistance (h/e 2) 1/7 1/6 1/5 1/4 1/3 1/2 (x60)ρxx
- 73. ρ xy R es is ta nc e (Ω ) Magnetic Field (T) An example of the integer quantum Hall effect. Data taken from Paalanen et al, Phys. Rev. B. 25, 5566 (1982) Module PHY6002 Inorganic Semiconductor Nanostructures Lectures 7, 8, 9 and 10 24 have similarities with the energy bands in a solid (see Lecture 1) and as in that case the electronic properties are a very sensitive function of how the charge carriers occupy the bands. Each band formed by the
- 74. magnetic field is known as a Landau level and it can be shown that the degeneracy of each Landau level is given by eB h Hence as the field is increased the degeneracy of each level also increases. Therefore for a given carrier density in the structure the number of occupied levels decreases with increasing field. In (c) the Landau level degeneracy is such that only the lowest two levels are occupied. This corresponds to the case of an insulator with completely filled bands followed by completely empty bands. In this case the structure has a zero conductivity (σxx=0). In (b) the field has been increased so that now the second Landau level is only half filled. Conductivity is possible for the electrons in this level and hence σxx≠0. Under conditions of high magnetic field the following relationships relate the conductivity and resistivity components 2 1xx xx xy H
- 75. xy xy R B σ ρ ρ σ σ ≈ ≈ = The first relationship shows that the zero conductivity values obtained when exactly an integer number of Landau levels are occupied results in a zero value for ρxx. The plateau values of ρxy can be found by noting that if exactly j Landau levels are fully occupied then S eB N j h = where NS is the two dimensional carrier density. From the above definition of ρxy (a) (b) (c) Quantised energy levels of a two dimensional system placed in a
- 76. magnetic field (a) case of zero level broadening (b) and (c) with level broadening and for different occupations of the levels up to the dashed line. Module PHY6002 Inorganic Semiconductor Nanostructures Lectures 7, 8, 9 and 10 25 2 1 25812.8 xy H S B h R B N e j e j ρ = = = = Ω The plateau values of ρxy are sample independent and are related to the fundamental constants h and e. Values for ρxy can be measured to very high accuracy and are now used as the basis for the resistance standard and also to calculate the fine structure constant α=µ0ce2/2h, where the permeability of free space, µ0, and the speed of light, c, are defined quantities.
- 77. The parameter j is known as the filling factor The quantum Hall effect discussed previously occurs for integer values of j and is therefore known as the integer quantum Hall effect. However, in samples with very high carrier mobilities, plateaus in ρxy and minima in ρxx are also observed for fractional values of j, giving rise to the fractional quantum Hall effect. The discovery and theoretical interpretation of the fractional quantum Hall effect, which results from the free carriers behaving collectively rather than as single particles, lead to the award of the 1998 Nobel Physics prize to Stormer, Tsui and Laughlin. An example of the fractional quantum Hall effect is given in the above figure which was recorded at very low temperatures for a very high mobility GaAs- AlGaAs single heterostructure. In addition to minima in ρxx and plateaus in ρxy for integer values of the filling factor, similar features are also observed for non-integer values, for example 3/5, 2/3, 3/7 etc. Ballistic Carrier Transport The carrier transport considered so far is controlled by a series of random scattering events (see Lecture 2). However the high carrier mobilities which can be obtained by the use of modulation doping correspond to very long path lengths between successive scattering events, lengths that can significantly
- 78. An example of the fractional quantum Hall effect which where the filling factor j has non integer values. The integer quantum Hall effect is still observed at low fields. Figure from R Willet et al Phys. Rev. Lett. 59, 1776 (1987). Module PHY6002 Inorganic Semiconductor Nanostructures Lectures 7, 8, 9 and 10 26 exceed the dimensions of a nanostructure. In this case a carrier can pass through the structure without experiencing a scattering event, a process known as ballistic transport. Ballistic transport conserves the phase of the charge carriers and leads to a number of novel phenomena, two of which will now be discussed. When carriers travel ballistically along a quantum wire there is no dependence of the resultant current on the energy of the carriers. This results from a cancellation between the energy dependence of their velocity (v=(2E/m*)1/2) and the density of states, which in one dimension varies as E- 1/2 (see Lecture 6). For each subband occupied by carriers, a conductance equal to 2e2/h is obtained, a behaviour known as quantised conductance. If the number of occupied subbands is varied then the conductance of the wire
- 79. will exhibit a step-like behaviour, with each step corresponding to a conductance change of 2e2/h. Quantum conductance is most easily observed in electrostatically induced quantum wires (see Lecture 7). The gate voltage determines the width of the wire, which in turn controls the energy spacing between the subbands. For a given carrier density, reducing the subband spacing results in the population of a greater number of subbands and hence an increased conductance. The following figure shows quantum conductance in a 400nm long electrostatically induced quantum wire. These measurements are generally performed at very low temperatures to obtain the very high mobilities required for ballistic transport conditions. In contrast to the plateau values observed for ρxy in the quantum Hall effect, which are independent of the structure and quality of the device, the quantised conductance values of a quantum wire are very sensitive to any potential fluctuations which result in scattering events. This sensitivity prevents the use of quantum conductance as a resistance standard. The inset to the above figure shows a structure in which a quantum wire splits into two wires which subsequently rejoin after having enclosed an area A. Under ballistic transport conditions the wavefunction of an electron incident on
- 80. the loop will split into two components which, upon recombining at the far side -1.6 -1.4 -1.2 -1.0 -0.8 -0.6 0 2 4 6 8 10 12 Split gate 2D EG O hmic co ntacts Split gate 2D EG O hmic co ntacts C on du ct an ce
- 81. (u ni ts 2 e2 /h ) Split Gate Bias Voltage (V) Example of quantum conductance in a quantum wire defined electrostatically from a 2DEG. The inset shows the sample geometry. Data from Hamilton et al, Appl. Phys. Lett. 60, 2782 (1992). 0 10 20 30 40 50 60 70 80 50 100 150 200 250 300 AA
- 82. R es is ta nc e (Ω ) Magnetic Field (mT) An example of the Aharonov-Bohm effect in an electrostatically defined quantum ring. The inset shows the sample geometry. Data from Timp et al, Phys. Rev. B. 39, 6227 (1989). Module PHY6002 Inorganic Semiconductor Nanostructures Lectures 7, 8, 9 and 10 27 of the loop, will interfere. If a magnetic field is now applied normal to the plane of the loop an additional phase difference is acquired or lost by the wavefunctions, depending upon the sense in which they traverse the loop. The phase difference increases by 2π when the magnetic flux through the
- 83. loop, given by the area multiplied by the field (BA), changes by h/e. Hence as the magnetic field is increased the system will oscillate between conditions of constructive interference (corresponding to a high conductance) and destructive interference (corresponding to low conductance). The change in field (∆B) between two successive maxima (or minima) is given by the condition ∆BA=h/e, resulting in the conductance of the system oscillating periodically with increasing field. An example of this behaviour, known as the Aharonov-Bohm effect is shown in the previous figure for a loop of diameter 1.8µm formed from the 2DEG of a GaAs-AlGaAs single heterostructure by patterning the surface with metal gates defined by electron beam lithography. Summary and Conclusions In this lecture we have shown how modulation doping allows the attainment of very high carrier mobilities at low temperatures. This allows the observation of a number of novel effects including the integer and fractional quantum Hall effects. The high mobilities correspond to long average distances between scattering events and carriers may be able to pass through a nanostructure ballistically without undergoing a single scattering event. In this case processes which include quantised conductance and the Aharonov-Bohm
- 84. effect are observable. Further reading The paper by Pfeiffer et al (Appl. Phys. Lett. 55, 1888 (1989)) describes the optimisation of the MBE technique to give very high electron mobilities. Carrier scattering processes are discussed in detail in ‘The Physics of Low Dimensional Semiconductors’ by J H Davies. The discussion of the integer quantum Hall effect give in this lecture is relatively non- mathematical. A more detailed treatment which includes the importance of disorder is given in ‘Band theory and Electronic Properties of Solids’ by J Singleton (OUP). Module PHY6002 Inorganic Semiconductor Nanostructures Lectures 7, 8, 9 and 10 28 Lecture 10 Tunnelling and related processes in semiconductor nanostructures Introduction Quantum mechanical tunnelling, in which a particle passes through a classically forbidden region, is the mechanism by which α particles escape from the nucleus during α decay and electrons escape from a solid in
- 85. thermionic emission. Tunnelling can also be observed in semiconductor nanostructures where the ability to deposit very thin layers permits the easy production of tunnelling barriers. Tunnelling can be observed either through a single barrier or through two barriers separated by a quantum well or quantum dot. A range of novel physical processes are observed with a number of practical applications. Tunnelling through a single square barrier Consider the single square barrier of potential height V0 and thickness a as shown in the following figure. Such a structure can be easily fabricated by depositing a thin layer of a wide band gap semiconductor between thicker layers of a narrower band gap semiconductor. Away from the barrier, and on both sides, would normally be doped regions to provide a reservoir of carriers. By fabricating a suitable device an applied voltage can be used to vary the energy of the carriers and their ability to pass through the barrier is indicated by the magnitude of current flowing through the device. The following figure shows the calculated transmission probability for an electron of energy E incident on a barrier of height 0.3eV and thickness 10nm. The classical result has a value of zero when the electron energy is less than the barrier height and one otherwise. In contrast the quantum
- 86. mechanical result is non-zero for energies below that of the barrier height indicating that the electron can quantum mechanically tunnel through the barrier, a region where classically it would have negative kinetic energy. The oscillations of the probability for energies which exceed the barrier height are a result of the interference between waves which are reflected from the two sides of the barrier. For electron energies less than the barrier height the transmission probability T can be approximated to Vo a E Schematic diagram of a single barrier tunnelling structure. Module PHY6002 Inorganic Semiconductor Nanostructures Lectures 7, 8, 9 and 10 29 * 0
- 87. 2 0 2 ( )16 exp( 2 ) m V EE T a where V κ κ − ≈ − = Because of the exponential function the transmission probability is very sensitive to both the energy of the electron and the width and height of the barrier. Double barrier resonant tunnelling structures Of greater practical interest than a single barrier tunnelling structure is the case of two barriers separated by a thin quantum well, known as a double barrier resonant tunnelling structure (DBRTS). A schematic diagram of a DBRTS is shown in the following figure. Quantised energy levels are formed in the quantum well as described in Lecture 5.
- 88. Calculated transmission coefficient as a function of electron energy for a single barrier of height 0.3eV. taken from J H Davies ‘The Physics of Low-dimensional semiconductors’ CUP I V I I V V (a) (b) (d) (c) A double barrier resonant tunnelling structure. Module PHY6002 Inorganic Semiconductor Nanostructures Lectures 7, 8, 9 and 10 30
- 89. The previous figure also shows a DBRTS for various applied voltages. For the sign of voltage shown electrons travel from left to right. Electrons are first incident on the left most barrier through which they must tunnel. However at low applied voltages their energy when they have tunnelled into the well is below that of the lowest confined state and the two barriers plus the well therefore behave as one effectively thick barrier; the tunnelling probability and hence the current is very low. As the voltage is increased the energy of the electrons tunnelling through the first barrier comes into resonance with the lowest state in the well. The effective barrier width is now reduced and it becomes much easier for the electrons to pass through the structure. As a result the current increases significantly. For further increase in voltage the resonance condition is lost and the current decreases. However additional resonances may be observed with higher energy confined states. The figure also shows the expected current-voltage characteristic of a DBRTS indicating the relationship between specific points on the characteristic and the different voltage conditions. The previous figure shows experimental results obtained for a DBRTS consisting of a 20nm GaAs quantum well confined between
- 90. 8.5nm AlGaAs barriers. Resonances with five confined quantum well states are observed. Beyond each resonance a DBRTS exhibits a negative differential resistance, a region where the current decreases as the applied voltage is increased. Such a characteristic has a number of applications including the generation and mixing of microwave signals. Very high frequencies are possible because of the rapid transit time of the electrons through the structure. DBRTS can also exhibit hysteresis in their current-voltage characteristics, particularly when the thicknesses of the two barriers are asymmetrical. A thinner first barrier allows carriers to tunnel easily into the well but a thicker second barrier impedes escape, resulting in charge build up in the well. This charge build up modifies the voltage dropped across the initial part of the structure and maintains the resonance condition to higher voltages than would 0 10 20 30 40 50
- 91. 60 0 1 2 3 0 10 20 30 40 x35 E4 E3 E2 E1 C ur re nt (m A )
- 92. Bias Voltage (V) x100 C ur re nt (m A ) Bias Voltage (V) Measured current voltage characteristics of a double barrier resonant tunnelling structure. Data supplied by P Buckle and W Tagg (University of Sheffield). Module PHY6002 Inorganic Semiconductor Nanostructures Lectures 7, 8, 9 and 10 31 occur in the case of an empty well. This broadened resonance is only observed as the voltage is increased allowing charge to
- 93. accumulate in the well. If the voltage is taken above the resonance condition the well empties and decreasing the voltage results in a narrower resonance as there is now no charge accumulation. For such a structure the current follows a different path depending upon the direction in which the voltage is varied; the current- voltage characteristics exhibit a hysteresis. The inset to the previous figure shows the characteristics of an asymmetrical DBRTS with 8.5 and 13nm thick Al0.33Ga0.67As barriers and a 7.5nm In0.11Ga0.89As quantum well. Two important figures of merit for a resonant tunnelling structure are the widths of the resonance and the ratio of the current at the peak of the resonance to that immediately after the resonance, the peak-to- valley-ratio. Once resonance has been reached with the lowest energy confined quantum well state it might be expected that current would continue to flow for higher voltages because of the continuum of states which exist as a result of inplane motion (see Lecture 5). However when an electron tunnels through the first barrier not only must energy be conserved but also the two components of the inplane momentum or wavevectors kx and ky. Conservation of kx and ky prevents tunnelling into higher continuum states as these correspond to high values of kx and ky whereas the tunnelling electrons will
- 94. generally have relatively small inplane wavevectors. In fact the electrons to the left of the first barrier will have a range of initial energies, a result of their density and the Pauli exclusion principle, and hence a range of kx and ky values. This range of inplane wavevectors contributes to the width of the resonance. That the current immediately after a resonance does not fall to zero indicates that additional non-resonant tunnelling is occurring. The precise nature of these additional processes is still unclear but may include tunnelling via impurity states in the barriers or phonon scattering which allows electrons of an initially incorrect energy to tunnel via the quantum well states. In general the peak-to-valley-ratio decreases as the device temperature is increased. Tunnelling via quantum dots – Coulomb blockade The quantum well of a double barrier resonant tunnelling structure can be replaced by a quantum dot. In addition to the modification of the energy level structure the small size of a typical quantum dot results in a new effect. A small quantum dot will posses a relatively large capacitance. If a quantum dot already contains one or more electrons then a significant energy is required to add an additional electron as a result of the work that must be done against the repulsive electrostatic force between like charges. This charging energy,
- 95. given by e2/2C where C is the dot capacitance, modifies the energies of the confined dot states which would occur for an uncharged system. Charging effects are most easily understood by referring to a structure of the form shown in the inset to the following figure, which consists of a quantum dot placed close to a reservoir of free electrons. Applying a voltage to the metal gate on the surface of the structure allows the energy of the dot to be varied with respect to the reservoir. If a given energy level in the dot is below the energy of the reservoir then electrons will tunnel from the reservoir into the dot level. Alternatively if the energy level is above the reservoir then the level will be unoccupied. Hence by varying the gate voltage the dot states can be sequentially filled with electrons. This filling can be monitored by measuring Module PHY6002 Inorganic Semiconductor Nanostructures Lectures 7, 8, 9 and 10 32 the capacitance of the device which will exhibit a characteristic feature each time an additional electron is added to the dot. The main part of the
- 96. previous figure shows the capacitance trace recorded for a device containing an ensemble of self assembled quantum dots. These dots have two confined electron levels; the lowest (ground state) able to hold two electrons (degeneracy of two) with the excited level able to hold four electrons (degeneracy of four). In the absence of charging effects only two features would be observed in the capacitance trace, one at the voltage corresponding to the filling of the ground state, the other when the voltage reaches the value required for electrons to tunnel into the excited state. However once one electron has been loaded into the ground state charging effects result in an additional energy, and a higher voltage, being required to add the second electron. This leads to two distinct capacitance features corresponding to the filling of the ground state. Similarly four distinct features are expected as electrons are loaded into the excited state although in the present case inhomogeneous broadening prevents these being individually resolved. This charging behaviour is known as Coulomb blockade and is observed experimentally when the charging energy exceeds the
- 97. thermal energy, kT. Coulomb blockade effects can also be observed in transport processes where carriers tunnel through a quantum dot. Suitable dots may be formed electrostatically using split gates to define the dot and to provide tunnelling barriers between the dot and the surrounding 2DEG which forms a reservoir of carriers. An additional gate electrode allows the energy of the dot to be varied with respect to the carrier reservoirs. The relatively large dot size results in Coulomb charging energies that are much larger than the confinement energies. The former therefore dominate the energetics of the system. The inset to the following figure shows a schematic diagram of the structure where a small bias voltage has been applied between the left and right two-dimensional carrier reservoirs. The dot initially contains N electrons resulting in an energy indicated by the lower horizontal line. An additional electron can tunnel into the dot from the left hand reservoir but this increases the dot energy by the charging energy. Hence this process is only energetically possible if the energy of the dot with N+1 electrons lies below the maximum energy of the electrons in the left hand reservoir. Tunnelling of this additional electron into the right hand reservoir may subsequently occur
- 98. -1.0 -0.8 -0.6 -0.4 -0.2 0.0 0.2 0.4 2.10 2.12 2.14 2.16 2.18 2.20 2.22 2.24 f r e e e l e c t r o n s q u a n t u m d o t b l o c k in g b a r r ie r g a te Excited state Ground state C ap ac
- 99. ita nc e (n F) Voltage (V) Structure and results from a device in which a controllable number of electrons can be loaded on to a quantum dot. Figure redrawn from Fricke et al Europhysics Lett. 36, 197 (1996). Module PHY6002 Inorganic Semiconductor Nanostructures Lectures 7, 8, 9 and 10 33 but only if the N+1 dot energy lies above the maximum energy of this reservoir. If these two conditions are satisfied, requiring that the N+1 dot energy lie between the energy maxima of the two reservoirs, a sequential flow of single electrons through the structure occurs; the system exhibits a non-zero conductance. As the gate voltage is used to vary the dot energy, the condition for sequential tunnelling will be
- 100. satisfied for different values of N and a series of conductance peaks will be observed, an example is shown in the above figure for a dot of radius 300nm. This large dot size results in a large capacitance and a correspondingly small charging energy (0.6meV for the present example). Hence measurements must be performed at very low temperatures in order to satisfy the condition e2/2C>>kT. Two practical applications of Coulomb blockade will be described in a later lecture. Summary and Conclusions In this lecture we have seen that it is possible to fabricate tunnelling structures based on semiconductor nanostructures. Double barrier resonant tunnelling structures give very non-linear current-voltage characteristics and display negative differential resistance. Because the transit time of carriers through such a structure is very short they have a number of applications including high frequency microwave oscillators and mixers. Tunnelling structures containing a quantum dot display an added complication due to the charge of the carriers; the Coulomb blockade effect. Further reading For a fuller, mathematical treatment of Coulomb blockade the
- 101. following articles may be useful, ‘Artificial Atoms’ by M A Kastner, Physics Today 24 January 1993 and ‘Single electron charging effects in semiconductor quantum dots’ by L P Kouenhoven et al Zeitschrift für Physik B Condensed Matter 85, 367 (1991). The generally mathematics of quantum mechanical tunnelling is described in quantum mechanics text books and also with respect to the present subject in ‘The Physics of Low-Dimensional semiconductors’ by J H Davies CUP. Finally ‘Low-Dimensional Semiconductors materials, physics, technology, devices’ by M J Kelly OUP discusses applications of resonant tunnelling structures. -0.60 -0.58 -0.56 -0.54 -0.52 -0.50 0.0 0.5 1.0 N N+1 eV C on
- 102. du ct an ce (e 2 /h ) Gate Voltage (V) Coulomb blockade effect observed for tunnelling through an electrostatically defined quantum dot. The measurement temperature is 10mK. The inset shows the carrier tunnelling steps and the energy levels of the system. Data redrawn from L P Kouwenhoven, et al Z. Phys. B. 85, 367 (1991). Financial Management • Autumn 2004 • pages 5 - 37 Why Has IPO Underpricing Changed Over Time? Tim Loughran and Jay Ritter* In the 1980s, the average first-day return on initial public offerings (IPOs) was 7%. The average first-day return doubled to almost 15% during 1990- 1998, before jumping to 65%
- 103. during the internet bubble years of 1999-2000 and then reverting to 12% during 2001-2003. We attribute much of the higher underpricing during the bubble period to a changing issuer objective function. We argue that in the later periods there was less focus on maximizing IPO proceeds due to an increased emphasis on research coverage. Furthermore, allocations of hot IPOs to the personal brokerage accounts of issuing firm executives created an incentive to seek rather than avoid underwriters with a reputation for severe underpricing. What explains the severe underpricing of initial public offerings in 1999-2000, when the average first-day return of 65% exceeded any level previously seen before? In this article, we address this and the related question of why IPO underpricing doubled from 7% during 1980-1989 to almost 15% during 1990-1998 before reverting to 12% during the post-bubble period of 2001- 2003. Our goal is to explain low-frequency movements in underpricing (or first-day returns) that occur less often than hot and cold issue markets. We examine three hypotheses for the change in underpricing: 1) the changing risk composition hypothesis, 2) the realignment of incentives hypothesis, and 3) a new hypothesis, the changing issuer objective function hypothesis. The changing issuer objective function hypothesis has two components, the spinning hypothesis and the analyst lust hypothesis. The changing risk composition hypothesis, introduced by Ritter (1984), assumes that riskier
- 104. IPOs will be underpriced by more than less-risky IPOs. This prediction follows from models where underpricing arises as an equilibrium condition to induce investors to participate in the IPO market. If the proportion of IPOs that represent risky stocks increases, there should be greater average underpricing. Risk can reflect either technological or valuation uncertainty. Although there have been some changes in the characteristics of firms going public, these changes are found to be too minor to explain much of the variation in underpricing over time if there is a stationary risk-return relation. The realignment of incentives and the changing issuer objective function hypotheses both We thank Hsuan-Chi Chen, Harry DeAngelo, Craig Dunbar, Todd Houge, Josh Lerner, Lemma Senbet and James Seward (the Editors), Toshio Serita, Ivo Welch, Ayako Yasuda, and Donghang Zhang; seminar participants at the 2002 Chicago NBER behavioral finance meetings, the 2002 Tokyo PACAP/APFA/FMA meetings, the 2003 AFA meetings, Boston College, Cornell, Gothenburg, Indiana, Michigan State, Penn State, Stanford, the Stockholm School of Economics, Vanderbilt, NYU, SMU, TCU, and the Universities of Alabama, California (Berkeley), Colorado, Houston, Illinois, Iowa, Notre Dame, and Pennsylvania, and several anonymous referees; and especially Alexander Ljungqvist for useful comments. Chris Barry, Laura Field, Paul Gompers, Josh Lerner, Alexander Ljungqvist, Scott Smart, Li-Anne Woo, and Chad Zutter generously provided IPO data. Bruce Foerster assisted us in ranking underwriters. Underwriter ranks are available online at http://bear.cba.ufl.edu/ritter/rank.htm. Donghang Zhang supplied useful
- 105. research assistance. *Tim Loughran is a Professor of Finance at the University of Notre Dame. Jay Ritter is the Cordell Professor of Finance at the University of Florida. Financial Management • Autumn 2004 6 posit changes over time in the willingness of issuing firms to accept underpricing. Both hypotheses assume that underwriters benefit from rent-seeking behavior that occurs when there is excessive underpricing. The realignment of incentives hypothesis, introduced by Ljungqvist and Wilhelm (2003), argues that the managers of issuing firms acquiesced in leaving money on the table during the 1999-2000 bubble period. (Money on the table is the change between the offer price and the first closing market price, multiplied by the number of shares sold.) The hypothesized reasons for the increased acquiescence are reduced chief executive officer (CEO) ownership, fewer IPOs containing secondary shares, increased ownership fragmentation, and an increased frequency and size of “friends and family” share allocations. These changes made issuing firm decision-makers less motivated to bargain for a higher offer price. The realignment of incentives hypothesis is similar to the changing risk composition hypothesis in that it is changes in the characteristics of
- 106. ownership, rather than any nonstationarities in the pricing relations, that are associated with changes in average underpricing. It differs from the changing risk composition hypothesis, however, in that underpricing is not determined solely by the investor demand side of the market. In our empirical work, we find little support for the realignment of incentives hypothesis as an explanation for substantial changes in underpricing. We find no relation between the inclusion of secondary shares in an IPO and underpricing. And although CEO fractional ownership was lower during the internet bubble period, the CEO dollar ownership (the market value of the CEO’s holdings) was substantially higher, resulting in increased incentives to avoid underpricing. Furthermore, it is possible that changes in the characteristics of ownership may be partly a response to higher underpricing as well as a cause. Ljungqvist and Wilhelm (2003) do not provide an explanation for why these changes occurred. The changing issuer objective function hypothesis argues that, holding constant the level of managerial ownership and other characteristics, issuing firms became more willing to accept underpricing. We hypothesize that, during our sample period, there are two reasons for why issuers became more willing to leave money on the table. The first reason is an increased emphasis on analyst coverage. As issuers placed more importance on hiring a lead underwriter with a highly ranked analyst to cover the firm, they
- 107. became less concerned about avoiding underwriters with a reputation for excessive underpricing. We call this desire to hire an underwriter with an influential but bullish analyst the analyst lust hypothesis. This results in each issuer facing a local oligopoly of underwriters, no matter how many competing underwriters there are in total, because there are typically only five Institutional Investor all-star analysts covering any industry. As Hoberg (2003) shows, the more market power that underwriters have, the more underpricing there will be in equilibrium. The second reason for a greater willingness to leave money on the table by issuers is the co-opting of decision-makers through side payments. Beginning in the 1990s, underwriters set up personal brokerage accounts for venture capitalists and the executives of issuing firms in order to allocate hot IPOs to them. By the end of the decade, this practice, known as spinning, had become commonplace. The purpose of these side payments is to influence the issuer’s choice of lead underwriter. These payments create an incentive to seek, rather than avoid, underwriters with a reputation for severe underpricing. We call this the spinning hypothesis. In the post-bubble period, increased regulatory scrutiny reduced spinning dramatically. This is one of several explanations why underpricing dropped back to an average of 12%. The reduction in spinning removed the incentive for issuers to choose investment bankers who underprice. Investment bankers responded by underpricing less in the post-
- 108. bubble period. Loughran & Ritter • Why Has IPO Underpricing Changed Over Time? 7 The contributions of our research are three-fold. First, we develop the changing issuer objective function hypothesis for the increased underpricing of IPOs during the 1990s and the bubble periods. Second, we document many patterns regarding the evolution of the US IPO market during the last two decades. Much of the data has been or will be posted on a website for other researchers to use. Many, although not all, of these patterns have been previously documented, especially for the first two subperiods. Third, we formally test the ability of the changing risk composition, realignment of incentives, and changing issuer objective function hypotheses to explain the changes in underpricing from 1980-1989 (“the 1980s”) to 1990-1998 (“the 1990s”), 1999-2000 (“the internet bubble”), and 2001-2003 (“the post-bubble period”). Much of the increased underpricing in the bubble period is consistent with the predictions of the changing issuer objective function hypothesis. In multiple regression tests, the changing risk composition and the realignment of incentives hypotheses have little success at explaining the increase in first-day returns from the 1980s to the 1990s, to the bubble period, or to the post-bubble period. The regression results
- 109. show that only part of the increase in the bubble period is attributable to the increased fraction of tech and internet stocks going public. Consistent with the changing issuer objective function hypothesis, underpricing became much more severe when there was a top- tier lead underwriter in the latter time periods. These conclusions are not substantially altered after controlling for the endogeneity of underwriter choice. The rest of this article is as follows. In Section I, we present our changing issuer objective function hypothesis. In Section II, we describe our data. In Section III, we report year-by- year mean and median first-day returns and valuations. In Section IV, we report average first- day returns for various univariate sorts. In Section V, we report multiple regression results with first-day returns as the dependent variable. Section VI discusses alternative explanations for the high underpricing of IPOs during the internet bubble period. Section VII presents our conclusions. Four appendices provide detailed descriptions of our data on founding dates, post-issue shares outstanding, underwriter rankings, and internet IPO identification. I. Causes of a Changing Issuer Objective Function Most models of IPO underpricing are based on asymmetric information. There are two agency explanations of underpricing in the IPO literature. Baron (1982) presents a model of underpricing where issuers delegate the pricing decision to underwriters. Investment bankers
- 110. find it less costly to market an IPO that is underpriced. Loughran and Ritter (2002) instead emphasize the quid pro quos that underwriters receive from buy-side clients in return for allocating underpriced IPOs to them. The managers of issuing firms care less about underpricing if they are simultaneously receiving good news about their personal wealth increasing. This argument, however, does not explain why issuers hire underwriters who will ex post exploit issuers’ psychology. Neither does the realignment of incentives hypothesis. One can view issuers as seeking to maximize a weighted average of IPO proceeds, the proceeds from future sales (both insider sales and follow-on offerings), and side payments from underwriters to the people who will choose the lead underwriter: α 1 IPO Proceeds + α 2 Proceeds from Future Sales + (1 - α 1 - α 2 )Side Payments (1) Financial Management • Autumn 2004 8
- 111. The changing issuer objective function hypothesis states that issuers choosing an underwriter in some periods put less weight on IPO proceeds and more weight on the proceeds from future sales and side payments. In Equation (1), IPO proceeds are a function of the choice of underwriter and underwriting contract (auction or bookbuilding) at the start of the process and, several months later, the bargaining at the pricing meeting for IPOs when bookbuilding is used. Loughran and Ritter (2002) provide a prospect theory analysis of the bargaining at the pricing meeting. The Ljungqvist and Wilhelm (2003) realignment of incentives hypothesis can also be viewed as a theory of the bargaining at the pricing meeting. Neither of these theories, though, explains why an issuing firm would choose an underwriter that would, at the pricing meeting, propose an offer price that leaves more money on the table than necessary. In contrast, the changing issuer objective function hypothesis does provide a theory for the choice of underwriter at the start of the process. Before discussing the analyst lust and spinning hypotheses in more detail, we explain why underwriters want to underprice. A. Why Underwriters Want to Underprice IPOs Underwriters, as intermediaries, advise the issuer on pricing the issue, both at the time of issuing a preliminary prospectus that includes a file price range, and at the pricing meeting when the final offer price is set. If underwriters receive
- 112. compensation from both the issuer (the gross spread) and investors, they have an incentive to recommend a lower offer price than if the compensation was merely the gross spread. Bookbuilding is the mechanism used to price and allocate IPOs for 99.9% of our sample, with auctions used for the other 0.1%. In the case of bookbuilding, underwriters can decide to whom to allocate shares if there is excess demand. Benveniste and Wilhelm (1997) and Sherman and Titman (2002) emphasize that underwriter discretion can be used to the benefit of issuing firms. Underwriters can reduce the average amount of underpricing, thereby increasing the expected proceeds to issuers, by favoring regular investors who provide information about their demand that is useful in pricing an IPO. Shares can be allocated to those who are likely to be buy-and-hold investors, minimizing any costs associated with price support. Underwriter discretion can completely eliminate the winner’s curse problem if underwriters allocate shares in hot issues only to those investors who are willing to buy other IPOs. As Ritter and Welch (2002) note, if underwriters used their discretion to bundle IPOs, problems caused by asymmetric information could be nearly eliminated. The resulting average level of underpricing should then be no more than several percent. Thus, given the use of bookbuilding, the joint hypothesis that issuers desire to maximize their proceeds and that underwriters act in the best interests of issuers can be rejected
- 113. whenever average underpricing exceeds several percent. Although underwriter discretion in allocating IPOs can be desirable for issuing firms, it can also be disadvantageous if conflict of interest problems are not controlled. Underwriters acknowledge that in the late 1990s IPOs were allocated to investors largely on the basis of past and future commission business on other trades. In 1998- 2000, for example, Robertson Stephens allocated IPOs to institutional clients almost exclusively on the basis of the amount of commission business generated during the prior 18 months, according to its January 9, 2003 settlement with the NASD and SEC. Credit Suisse First Boston (CSFB) received commission business equal to as much as 65% of the profits that some investors received Loughran & Ritter • Why Has IPO Underpricing Changed Over Time? 9 from certain hot IPOs, such as the December 1999 IPO of VA Linux.1 The VA Linux IPO was priced at $30 per share, with a 7% gross spread equal to $2.10 per share. For an investor who was allocated shares at $30, and who then sold at the closing market price of $239.25, the capital gains would have amounted to $209.25 per share. If the investor then traded shares to generate commissions of one-half of this profit, the total underwriter compensation per share was $2.10 plus $104.625, or $106.725.
- 114. The receipt of commissions by underwriting firms in return for hot IPO allocations violates NASD Rule 2110 on “Free Riding and Withholding.” Because the underwriter has an economic interest (a share of the profits) in the IPO after it has been allocated, there is not a “full distribution” of the security. This is economically equivalent to withholding shares and selling them at a price higher than the offer price, in violation of Rule 2110. But if the NASD (a self-regulatory organization) did not enforce its rules, underwriters might find it optimal to violate the rules. Evidence consistent with commission business affecting IPO allocations is contained in Reuter (2004). The willingness of buy-side clients to generate commissions by sending trades to integrated securities firms depends on the amount of money left on the table in IPOs. Underwriters have an incentive to underprice IPOs if they receive commission business in return for leaving money on the table. But the incentive to underprice presumably would have been as great in the 1980s as during the internet bubble period, unless there was a “supply” shift in the willingness of firms to hire underwriters with a history of underpricing. We argue that such a shift did indeed occur, resulting in increased underpricing. B. The Analyst Lust Explanation of Underpricing We hypothesize that issuing firms have increasingly chosen their lead underwriter largely on the basis of expected analyst coverage. Providing research
- 115. coverage is expensive for investment bankers; the largest brokerage firms each spent close to $1 billion per year on equity research during the bubble (Rynecki, 2002). These costs are covered partly by charging issuers of securities explicit (gross spread) and implicit (underpricing) fees. The more that issuing firms see analyst coverage as important, the more they are willing to pay these costs. There are several reasons for our opinion that analyst lust was more important during the 1990s and bubble period than in the 1980s. First, the investment bankers and venture capitalists we have talked to are unanimous in their agreement. Supporting this, in the early 1970s Morgan Stanley had “no research business to speak of,” even though it was a major IPO underwriter (Schack, 2002). As we will show, the number of managing underwriters in 1See the January 22, 2002 SEC litigation release 17327 and news release (available on the SEC website at http://www.sec.gov), and the NASD Regulation news release (available at http://www.nasdr.com). The NASD Regulation news release states that “For example, after a CSFB customer obtained an allocation of 13,500 shares in the VA Linux IPO, the customer sold two million shares of Compaq and paid CSFB $.50 a share—or $1 million—as a purported brokerage commission. The customer immediately repurchased the shares through other firms at normal commission rates of $.06 per share at a loss of $1.2 million on the Compaq sale and repurchase because of the $1 million paid to CSFB. On that same day, however, the customer sold the VA Linux IPO shares, making a one-day profit of $3.3 million.”
- 116. According to paragraphs 48 and 49 of the SEC complaint, for the July 20, 1999 IPO of Gadzoox, which CSFB lead managed, “at least 261,025 shares were allocated to customers that were willing to funnel a portion of their IPO profits to CSFB.” CSFB distributed approximately 3.4 million of the 4.025 million offer, which went from an offer price of $21 to a closing price of $74.8125, up 256%. The following day, July 21, 1999, CSFB was the lead manager on MP3, which was priced at $28 and closed at $63.3125, up 126%. “CSFB distributed 7.2 million of the 10.35 million MP3 shares offered through underwriters. Of the 7.2 million MP3 shares distributed by CSFB, at least 520,170 shares were allocated to customers that were willing to funnel a portion of their trading profits to CSFB.” Financial Management • Autumn 2004 10 IPO syndicates has increased over time. Investment bankers note that co-managers are included in a syndicate almost exclusively to provide research coverage. Indeed, by 2000 co- managers were generally not even invited to participate in road shows and the pricing meeting at which the final offer price is determined. Second, as valuations have increased, changes in growth rates perceived in the financial markets represent more dollars. Firm value can be decomposed into the value of existing assets in place plus the net present value of growth opportunities. As the value of growth opportunities increases relative to the value of assets in place, issuing firms come to place