2. « PMET 11336 layout: SPEC (pmet)reference style: apa file: pmet9096.tex (Ramune) aid: 9096 doctopic: OriginalPaper class: spr-spec-pmet v.2008/12/03 Prn:3/12/2008; 15:54 p. 2/22»
PSYCHOMETRIKA
51 of examinees). Also, we believe that it is reasonable for test equating to satisfy the range require-
52 ment, that is, for all possible scores x of Test X, eY (x) should fall in the range of possible scores
53 in Test Y .
54 Also, in the practice of test equating, examinee scores on the two tests are collected accord-
55 ing to one of the three major types of equating designs, with each type having different versions
56 (von Davier et al., 2004, Chap. 2; Kolen & Brennan, 2004, Section 1.4). The first is the Sin-
57 gle Group (SG) design where a random sample of common population of examinees complete
58 both Test X and Test Y , the second is an Equivalent Groups (EG) design where two independent
59 random samples of the same examinee population complete Test X and Test Y , respectively,
60 and the third is the nonequivalent groups (NG) design where random samples from two differ-
61 ent examinee populations complete Test X and Test Y , respectively. A SG design is said to be
62 counterbalanced (a CB design) when one examinee subgroup completes Test X first and the re-
63 maining examinees Test Y first. NG designs, and some EG designs, make use of an anchor test
64 consisting of items appearing in both Test X and Test Y. The anchor test, call it Test V (with
65 possible scores v1 , v2 , . . .), is said to be internal when the anchor items contribute to the scores
66 in Test X and in Test Y , and is said to be external when they do not contribute.
67 If the c.d.f.s FX (·) and FY (·) are discrete, then often FX (x) will not coincide with FY (y)
68 for any possible score on Test Y , in which case the equipercentile equating function in (1)
69 is ill-defined. This poses a challenge in equipercentile equating, because often in psychome-
70 tric practice, test scores are discrete. Even when test scores are on a continuous scale, the
71 empirical distribution estimates of (FX , FY ) are still discrete, with these estimates given by
72 FX (x) = n(X) 1(xi ≤ x) and FX (y) = n(Y ) 1(yi ≤ y), with 1(·) the indicator function. A
1 1
73 solution to this problem is to model (FX , FY ) as continuous distributions, being smoothed ver-
74 sions of discrete test score c.d.f.s (GX , GY ), respectively (with corresponding probability mass
75 functions (gX , gY )). This approach is taken by the four well-known methods of observed-score
76 equating. They include the traditional methods of percentile-rank equating, linear equating, mean
77 equating (e.g., Kolen & Brennan, 2004), and the kernel method of equating (von Davier et al.,
78 2004). While in the equating literature they have been presented as rather distinct methods, each
79 of these methods corresponds to a particular mixture model for (FX , FY ) having the common
80 form:
81
p(X) p(Y )
82
83 FX (·) = wk,p(X) FXk (·); FY (·) = wk,p(Y ) FY k (·),
84 k=1 k=1
85
where for each Test X and Test Y , the Fk (·) are continuous c.d.f.s and wp = (w1,p , . . . , wp,p ),
p
k=1 wk,p = 1, are mixture weights defined by a discrete test score distribution G. For ex-
86
87
ample, the linear equating method corresponds to the simple mixture model defined by p(X) =
88
p(Y ) = 1, with FX (·) = Normal(·|μX , σX ) and FY (·) = Normal(y|μY , σY ), and the mean equat-
2 2
89
ing method corresponds to the same model with the further assumption that σX = σY . While the
2 2
90 σY
equating function for linear or mean equating is usually presented in the form eY (x) = σX (x −
91
−1
92 μX ) + μY , this equating function coincides with eY (x) = FY (FX (x)), when FX (·) and FY (·)
∗
are normal c.d.f.s with parameters (μX , σX ) and (μY , σY ), respectively. Now, let {xk−1 < xk , k =
2 2 ∗
93
2, . . . , p(X)} be the possible scores in Test X assumed to be consecutive integers, with x0 = ∗
94
∗ − 1 , x∗ ∗ ∗
x1 2 p(X)+1 = xp(X) + 2 , and {yk−1 < yk
1 ∗ , k = 2, . . . , p(Y )}, y ∗ , and y ∗
95 0 p(Y )+1 are similarly de-
96 fined for Test Y . The percentile-rank method corresponds to a model defined by a mixture of uni-
∗ ∗ ∗
form c.d.f.s, with FXk (·) = Uniform(·|xk − 1 , xk + 1 ) and wk,p(X) = gX (xk ) (k = 1, . . . , p(X)),
97
2 2
along with FY k (·) = Uniform(·|yk ∗ − 1 , y ∗ + 1 ) and w ∗ ) (k = 1, . . . , p(Y )) (for
98
2 k 2 k,p(Y ) = gY (yk
99 a slightly different view, see Holland and Thayer 2000). Finally, the kernel method corre-
100 sponds to a model defined by a mixture of normal c.d.f.s, with (pX , pY ) defined similarly,
3. « PMET 11336 layout: SPEC (pmet)reference style: apa file: pmet9096.tex (Ramune) aid: 9096 doctopic: OriginalPaper class: spr-spec-pmet v.2008/12/03 Prn:3/12/2008; 15:54 p. 3/22»
GEORGE KARABATSOS AND STEPHEN G. WALKER
101 FXk (·; hX ) = Normal(RXk (·; hX )|0, 1) and FY k (·; hY ) = Normal(RY k (·; hY )|0, 1), where hX
102 and hY are fixed bandwidths. (In particular, RXk (x; hX ) = [x − xk aX − μX (1 − aX )](hX aX )−1 ,
103 with aX = [σX /(σX + h2 )]1/2 . The function RY k (y; hY ) is similarly defined). In the kernel
2 2 2
X
104 ∗
model, the mixing weights are defined by (GX , GY ) with {wk,p(X) = gX (xk ) : k = 1, . . . , p(X)}
105 and {wk,p(Y ) = gY (yk ∗ ) : k = 1, . . . , p(Y )}, where (G , G ) are marginals of the bivariate dis-
X Y
106 tribution GXY assumed to follow a log-linear model. In the kernel equating model, the pos-
107 ∗ ∗
sible scores of each test (i.e., all the xk and all the yk ) need not be represented as consecu-
108 tive integers. In general, for all these models and their variants, it is assumed that the contin-
109 uous distributions (FX , FY ) are governed by some chosen function ϕ of a finite-dimensional
110 parameter vector θ (Kolen & Brennan, 2004; von Davier et al., 2004). Also, in practice, a
−1
111 point-estimate of the equating function at x is obtained by eY (x; θ ) = FY (FX (x; θ )|θ ) via
112 the point-estimate θ , usually a maximum-likelihood estimate (MLE) (Kolen & Brennan, 2004;
113 von Davier et al., 2004). Asymptotic (large-sample) standard errors and confidence intervals for
114 any given equated score eY (x; θ ) (for all values of x) can be obtained with either analytic or
115 bootstrap methods (Kolen & Brennan, 2004; von Davier et al., 2004). In the kernel equating
116 model, given the MLE GXY obtained from a selected log-linear model, the marginals (GX , GY )
117 are derived, and then the bandwidth parameter estimates (hX , hY ) are obtained by minimizing a
118
p ∗
squared-error loss criterion (h = arg minh>0 k=1 (wk,p − f (xk ; h))2 ).
119 The percentile-rank, linear, mean, and kernel equating models each have seen many suc-
120 cessful applications in equating. However, for five reasons, they are not fully satisfactory, and
121 these reasons invite the development of a new model of test equating. First, under any of these
122 four equating models, the mixture distributions (FX , FY ) support values outside the range of
123
∗ ∗ ∗ ∗
scores of Test X and/or of Test Y , the ranges given by [x1 , xp(X) ] and [y1 , yp(Y ) ], respec-
124 tively. The kernel, linear, and mean equating models each treat (FX , FY ) as normal distrib-
125 utions on R2 , and the percentile-rank model treats (FX , FY ) as continuous distributions on
∗ ∗ ∗ ∗
[x0 , xp(X)+1 ] × [y0 , yp(Y )+1 ]. As a consequence, under either of these four models, the estimate
126
−1
127 of the equating function eY (·; θ) = FY (FX (·; θ )|θ ) can equate scores on Test X with scores on
128 ∗ ∗
Test Y that fall outside the correct range [y1 , yp(Y ) ]. While it is tempting to view this as a minor
129 ∗ ∗
problem which only affects the equating of Test Y scores around the boundaries of [y1 , yp(Y ) ],
130
the extra probability mass that each of these models assign to values outside of the sample space
131 ∗ ∗ ∗ ∗
[x1 , xp(X) ] × [y1 , yp(Y ) ] can also negatively impact the equating of scores that lie in the middle
132
of the [y1 , yp(Y ) ] range. Second, the standard errors and confidence intervals of equated scores
133
are asymptotic, and thus are valid for only very large samples (e.g., von Davier et al., 2004,
134
pp. 68–69). Third, the kernel and percentile-rank models do not guarantee symmetric equating.
135
Fourth, the percentile-rank, linear, and mean equating models each make overly-restrictive as-
136
sumptions about the shape of (FX , FY ). There is no compelling reason to believe that in practice,
137 (continuized) test scores are truly normally distributed or truly a mixture of specific uniform
138 distributions. Fifth, each of the four equating models carry the assumption that the test score dis-
139 tributions (FX , FY ) are independent (e.g., von Davier et al., 2004, Assumption 3.1, p. 49). This
140 is not a realistic assumption in practice, since the two tests to be equated are designed to measure
141 the same trait, under the “equal construct” requirement of equating mentioned earlier. The equal
142 construct requirement implies the prior belief that (FX , FY ) are highly correlated (dependent),
143 i.e., that (FX , FY ) have a similar shapes, in the sense that the shape of FX provides information
144 about the shape of FY , and vice versa. A correlation of 1 represents the extreme case of depen-
145 dence, where FX = FY . A correlation of 0 represents the other extreme case of independence,
146 where the shape of FX provides absolutely no information about the shape of FY , and vice versa.
147 However, the assumption is not strictly true in practice and is not warranted in general.
148 In this paper, a novel Bayesian nonparametric model for test equating is introduced (Kara-
149 batsos & Walker, 2007), which address all five issues of the previous equating models, and can
150 be applied to all the equating designs. Suppose with no loss of generality that the test scores are
4. « PMET 11336 layout: SPEC (pmet)reference style: apa file: pmet9096.tex (Ramune) aid: 9096 doctopic: OriginalPaper class: spr-spec-pmet v.2008/12/03 Prn:3/12/2008; 15:54 p. 4/22»
PSYCHOMETRIKA
151 mapped into the interval [0, 1], so that each test score can be interpreted as a “proportion-correct”
152 score (a simple back-transformation gives scores on the original scale). In the Bayesian equating
153 model, continuous test score distributions (FX , FY ) are modeled nonparametrically and as de-
154 pendent, through the specification of a novel, bivariate Bernstein polynomial prior distribution.
155 This prior supports the entire space {FXY } of continuous (measurable) distributions on [0, 1]2
156 (with respect to the Lebesgue measure), where each FXY corresponds to univariate marginals
157 (FX , FY ). The bivariate Bernstein prior distribution is a very flexible nonparametric model,
158 which defines a (random) mixture of Beta distributions (c.d.f.s) for each marginal (FX , FY ).
159 In particular, the (p(X), p(Y )) are random and assigned an independent prior distribution. Also,
160 the vectors of mixing weights {wp(X) , wp(Y ) } are random and defined by discrete score distribu-
161 tions (GX , GY ) which themselves are modeled nonparametrically and as dependent by a bivari-
162 ate Dirichlet Process (Walker & Muliere, 2003). The Dirichlet process modeling of dependence
163 between (GX , GY ) induces the modeling of dependence between (FX , FY ). Under Bayes’ the-
164 orem, the bivariate Bernstein prior distribution combines with the data (the observed scores on
165 Tests X and Y ) to yield a posterior distribution of the random continuous distributions (FX , FY ).
166 For every sample of (FX , FY ) from the posterior distribution, the equating function is simply
−1
167 obtained by eY (·) = FY (FX (·)), yielding a posterior distribution of eY (·). It is obvious that for
−1
168 every posterior sample of (FX , FY ), the equating function eY (·) = FY (FX (·)) is symmetric and
169 equates scores on Test X with a score that always falls in the [0, 1] range of scores on Test Y .
170 Also, the posterior distribution of the equating function easily provides finite-sample confidence
171 interval estimates of the equated scores, and fully accounts for the uncertainty in all the parame-
172 ters of the bivariate Bernstein model. Furthermore, the Bayesian nonparametric method of test
173 equating can be applied to all major types of data collection designs for equating, with no special
174 extra effort (see Section 2.3). The bivariate Bernstein polynomial prior distribution is just one
175
example of a nonparametric prior distribution arising from the field of Bayesian nonparametrics.
176
For reviews of the many theoretical studies and practical applications of Bayesian nonparamet-
177
rics, see, for example, Walker, Damien, Laud, and Smith (1999) and Müller and Quintana (2004).
178
Also, see Karabatsos and Walker (2009) for a review from the psychometric perspective.
179
The Bayesian nonparametric equating model is presented in the next section, including the
180
Dirichlet process, the bivariate Dirichlet process, the random Bernstein polynomial prior distri-
bution, and the bivariate Bernstein prior distribution. It is proven that the percentile-rank, lin-
181
ear, and mean equating models are special cases of the Bayesian nonparametric model, under
182
highly informative choices of prior distribution for (FX , FY ). Also, it is shown that under rea-
183
sonable conditions the Bayesian model guarantees consistent estimation of the true marginal
184
distributions (FX , FY ), and as a consequence, guarantees consistent estimation of the true equat-
185
ing function eY (·). Furthermore, a Gibbs sampling algorithm is described, which provides a
186
means to infer the posterior distribution of the bivariate Bernstein polynomial model. Section 3
187
illustrates the Bayesian nonparametric equating model in the analysis of three data sets gen-
188
erated from the equivalent groups design, the counterbalanced design, and the nonequivalent
189
groups design with internal anchor, respectively. These data sets are classic examples of these
190
equating designs, and are obtained from modern textbooks on equating (von Davier et al., 2004;
191
Kolen & Brennan, 2004). The equating results of the Bayesian nonparametric model are com-
192
pared against the equating results of the kernel, percentile-rank, linear, and mean equating mod-
193
els. Finally, Section 4 ends with some conclusions about the Bayesian equating method.
194
195
196 2. Bayesian Nonparametric Test Equating
197
198 2.1. Dirichlet Process Prior
199 Any prior distribution generates random distribution functions. A parametric model gener-
200 ates a random parameter which then fits into a family of distributions, while a nonparametric prior
5. « PMET 11336 layout: SPEC (pmet)reference style: apa file: pmet9096.tex (Ramune) aid: 9096 doctopic: OriginalPaper class: spr-spec-pmet v.2008/12/03 Prn:3/12/2008; 15:54 p. 5/22»
GEORGE KARABATSOS AND STEPHEN G. WALKER
201 generates random distribution functions which cannot be represented by a finite-dimensional pa-
202 rameter. The Dirichlet process prior, which was first introduced by Ferguson (1973), is conve-
203 niently described through Sethuraman’s (1994) representation, which is based on a countably-
204 infinite sampling strategy. So, let θj , for j = 1, 2, . . . , be independent and identically distrib-
205 uted (i.i.d.) from a fixed distribution function G0 , and let vj , for j = 1, 2, . . . , be independent
206 and identically distributed from the Beta(1, m) distribution. Then a random distribution function
207 chosen from a Dirichlet process prior with parameters (m, G0 ) can be constructed via
208
∞
209
210
F (x) = ωj 1(θj ≤ x),
j =1
211
212
where ω1 = v1 and for j > 1, ωj = vj l<j (1 − vl ), and 1(·) is the indicator function. Such a
213
prior model is denoted as Π(m, G0 ). In other words, realizations of the DP can be represented as
214
infinite mixtures of point masses. The locations θj of the point masses are a sample from G0 . It is
215
obvious from the above construction that any random distribution F generated from a Dirichlet
216
process prior is discrete with probability 1.
217
Also, for any measurable subset A of a sample space X ,
218
219 F (A) ∼ Beta mG0 (A), m 1 − G0 (A)
220
221 with prior mean E[F (A)] = G0 (A), and prior variance
222
G0 (A)[1 − G0 (A)]
223 Var F (A) = .
224 m+1
225
Hence, m acts as an uncertainty parameter, increasing the variance as m becomes small. The
226
parameter m is known as a precision parameter, and is often referred to as the “prior sample
227
size.” It reflects the prior degree of belief that the chosen baseline distribution G0 represents
228
the true distribution. An alternate representation of the Dirichlet process involves the Dirichlet
229
distribution. That is, F is said to arise from a Dirichlet process with parameters m and G0 if
230
for every possible partition A1 , . . . , Ap of the sample space, F (A1 ), . . . , F (Ap ) is distributed as
231
Dirichlet (mG0 (A1 ), . . . , mG0 (Ap )).
232
With the Dirichlet process being a conjugate prior, given a set of data x n = {x1 , . . . , xn }
233
with empirical distribution F (x), the posterior distribution of F is also a Dirichlet process, with
234
updated parameters given by m → m + n, and
235
236 F (A)|x n ∼ Beta mG0 (A) + nF (A), m 1 − G0 (A) + n 1 − F (A)
237
238 for any measurable subset A of a sample space X . It follows that the posterior distribution of F
239 under a Dirichlet process can be represented by:
240
241 F (A1 ), . . . , F (Ap )|x n ∼ Dirichlet mG0 (A1 ) + nF (A1 ), . . . , mG0 (Ap ) + nF (Ap ) ,
242
for every measurable partition A1 , . . . , Ap of a sample space X . The posterior mean under the
243
Dirichlet process posterior is given by
244
245
mG0 (x) + nF (x)
246 Fn (x) = E F (x)|x n = F (x)Πn (dF ) = .
m+n
247
248 In the equation above, Πn denotes the Dirichlet process posterior distribution over the space of
249 sampling distributions {F } defined on a sample space X . Hence, the Bayes estimate, the posterior
250 mean, is a simple mixture of the data, via the empirical distribution function and the prior mean,
6. « PMET 11336 layout: SPEC (pmet)reference style: apa file: pmet9096.tex (Ramune) aid: 9096 doctopic: OriginalPaper class: spr-spec-pmet v.2008/12/03 Prn:3/12/2008; 15:54 p. 6/22»
PSYCHOMETRIKA
251 G0 . As seen in the above equation, Fn is the posterior expectation and is thus the optimal point-
252 estimate of the true sampling distribution function (of the data), under squared-error loss.
253 In general, if FX is modeled with a Dirichlet process with parameters (m(X), G0X ), and FY
254 is modeled with parameters (m(Y ), G0Y ), then given data x n(X) = {x1 , . . . , xn(X) } and y n(Y ) =
255
{y1 , . . . , yn(Y ) },
256
257 −1
P FY FX (x) > y|FX , x n(X) , y n(Y )
258
259 = Beta FX (x); m(Y )G0Y + n(Y )FY (y), m(Y )[1 − G0Y ] + n(Y )[1 − FY ] (y) ,
260
261 where n(Y ) is the number of observations on test Y , and Beta(t; ·, ·) denotes the c.d.f. of a beta
262
distribution. See Hjort and Petrone (2007) for this result. From this, the density function for
263 −1
FY (FX (x)) is available (see (4) in Hjort and Petrone 2007), and so an alternative score for Test
264
Y which corresponds to the score of x for Test X can be the mean of this density. A sampling
265
approach to evaluating this is as follows: take FX (x) from the beta distribution with parameters
266
267
m(X)G0X (x) + n(X)FX (x), m(X) 1 − G0X (x) + n(X) 1 − FX (x)
268
269
270
and then take y = y(i) with probability
271
−1
272 n(Y ) + m(Y ) β FX (x); m(Y )G0Y (y(i) ) + i, m(Y ) 1 − G0Y (y(i) ) + n(Y ) − i + 1 ,
273
274 where β(·, ·) denotes the density function of the beta distribution (see Hjort & Petrone, 2007).
275 Here, y(1) < · · · < y(n) are the ordered observations and assumed to be distinct.
276 This Dirichlet process model assumes (FX , FY ) are independent, and for convenience, this
277
model is referred to as the Independent Dirichlet Process (IDP) model. As proven in Appendix I,
278
the linear equating, mean equating, and percentile-rank models are each a special case of the
279
IDP model for a very highly-informative choice of prior distribution. This highly-informative
280
choice of prior distribution is defined by precision parameters m(X), m(Y ) → ∞ which lead to
281
an IDP model that gives full support to baseline distributions (G0X , G0Y ) that define the given
282
(linear, mean, or percentile-rank) equating model (see Section 1). Moreover, while the kernel
283
equating model cannot apparently be characterized as a special case of the IDP, like the mean,
284
linear, and percentile-rank equating models, it carries the assumption that the true (FX , FY ) are
285
286
independent. However, as we explained in Section 1, there is no compelling reason to believe
287
that real test data are consistent with the assumption of independence or, for example, that the
288
test score distributions are symmetric.
289
The next subsection describes how to model (FX , FY ) as continuous distributions using
290 Bernstein polynomials. The subsection that follows describes the bivariate Bernstein polyno-
291 mial prior that allows the modeling of dependence between (FX , FY ) via the bivariate Dirichlet
292 process.
293
294
2.2. Random Bernstein Polynomial Prior
295
296 As mentioned before, the Dirichlet process prior fully supports discrete distributions. Here,
297 a nonparametric prior is described, which gives support to the space of continuous distributions,
298 and which leads to a smooth method for equating test scores. As the name suggests, the random
299 Bernstein polynomial prior distribution depends on the Bernstein polynomial (Lorentz, 1953).
300 For any function G defined on [0, 1] (not necessarily a distribution function), such that G(0) = 0,
7. « PMET 11336 layout: SPEC (pmet)reference style: apa file: pmet9096.tex (Ramune) aid: 9096 doctopic: OriginalPaper class: spr-spec-pmet v.2008/12/03 Prn:3/12/2008; 15:54 p. 7/22»
GEORGE KARABATSOS AND STEPHEN G. WALKER
301 the Bernstein polynomial of order p of G is defined by
302
p
303 k p k
304
B(x; G, p) = G x (1 − x)p−k (2)
p k
305 k=0
p
306
k k−1
307 =. G −G Beta(x|k, p − k + 1) (3)
p p
308 k=1
309 p
310 =. wk,p Beta(x|k, p − k + 1), (4)
311 k=1
312
313 and it has derivative:
314 p
315 f (x; G, p) = wk,p β(x|k, p − k + 1).
316 k=1
317 Here, wk,p = G(k/p) − G((k − 1)/p) (k = 1, . . . , p), and β(·|a, b) denotes the density of the
318 Beta(a, b) distribution, with c.d.f. denoted by Beta(·|a, b).
319 Note that if G is a c.d.f. on [0, 1], B(x; G, p) is also a c.d.f. on [0, 1] with probability density
320 function (p.d.f.) f (x; k, G), defined by a mixture of p beta c.d.f.s with mixing weights wp =
321 (w1,p , . . . , wp,p ), respectively. Therefore, if G and p are random, then B(x; G, p) is a random
322 continuous c.d.f., with corresponding random p.d.f. f (x; G, p). The random Bernstein–Dirichlet
323 polynomial prior distribution of Petrone (1999) has G as a Dirichlet process with parameters
324 (m, G0 ), with p assigned an independent discrete prior distribution π(p) defined on {1, 2, . . .}.
325 Her work extended from the results of Dalal and Hall (1983) and Diaconis and Ylvisaker (1985)
326 who proved that for sufficiently large p, mixtures of the form given in (2) can approximate
327 any c.d.f. on [0, 1] to any arbitrary degree of accuracy. Moreover, as Petrone (1999) has shown,
328 the Bernstein polynomial prior distribution must treat p as random to guarantee that the prior
329 supports the entire space of continuous densities with domain [0, 1]. This space is denoted by
330 Ω = {f }, and all densities in Ω are defined with respect to the Lebesgue measure.
331 We can elaborate further: A set of data x1 , . . . , xn ∈ [0, 1] are i.i.d. samples from a true
332 density, denoted by f0 , where f0 can be any member of Ω. With the true density unknown in
333 practice, the Bayesian assigns a prior distribution Π on Ω and, for example, Π could be chosen
334 as the random Bernstein polynomial prior distribution defined on Ω. Under Bayes’ theorem, this
335 prior combines with a set of data x1 , . . . , xn ∈ [0, 1] to define a posterior distribution Πn , which
336 assigns mass:
337
n
i=1 f (xi )Π(df )
338
Πn (A) = A
n
339 Ω i=1 f (xi )Π(df )
340
to any given subset of densities A ⊆ Ω. Let f0 denote the true density of the data, which can be
341
any member of Ω. As proved by Walker (2004, Section 6.3), the random Bernstein prior satisfies
342
strong (Hellinger) posterior consistency, in the sense that Πn (A ) converges to zero as the sample
343
size n increases, for all > 0, where:
344
345 A = {f ∈ Ω : H (f, f0 ) > }
346
√ √
347 is a Hellinger neighborhood around the true f0 , and H (f, f0 ) = { ( f (x) − f0 (x))2 dx}1/2
348 is the Hellinger distance. This is because the random Bernstein prior distribution, Π , satis-
349 fies two conditions which are jointly sufficient for this posterior consistency (Walker, 2004,
350 Theorem 4). First, the Bernstein prior satisfies the Kullback–Leibler property, that is, Π({f :
8. « PMET 11336 layout: SPEC (pmet)reference style: apa file: pmet9096.tex (Ramune) aid: 9096 doctopic: OriginalPaper class: spr-spec-pmet v.2008/12/03 Prn:3/12/2008; 15:54 p. 8/22»
PSYCHOMETRIKA
351 D(f, f0 ) < }) > 0 for all f0 ∈ Ω and all > 0, where D(f, f0 ) = log[f0 (x)/f (x)]f0 (x) dx
352 is the Kullback–Leibler divergence. Second, the prior satisfies k Π(Ak,δ )1/2 < ∞ for all δ > 0,
353 where the sets Ak,δ = {f : H (f, fk ) < δ} (k = 1, 2, . . .) are a countable number of disjoint
354 Hellinger balls having radius δ ∈ (0, ) and which cover A , where {fk } = A . Moreover, Walker,
355 Lijoi, and Prünster (2007) proved that consistency is obtained by requiring the prior distribution
356 π(p) on p to satisfy π(p) < exp(−4p log p) for all p = 1, 2, . . . . Also, assuming such a prior
357 for p under the random Bernstein polynomial prior, the rate of convergence of the posterior dis-
358 tribution is (log n)1/3 /n1/3 , which is the same convergence rate as the sieve maximum likelihood
359 estimate (Walker et al., 2007, Section 3.2).
360 In practice, Petrone’s (1999) Gibbs sampling algorithm may be used to infer the posterior
361 distribution of the random Bernstein polynomial model. This algorithm relies on the introduction
362 of an auxiliary variable ui for each data point xi (i = 1, . . . , n), such that u1 , . . . , un |p, G are
363 i.i.d. according to G, and that x1 , . . . , xn |p, G, u1 , . . . , un are independent, with joint (likelihood)
364 density:
365 n
366 β xi |θ (ui , p), p − θ (ui , p) + 1 ,
367
i=1
368 p
369
where for i = 1, . . . , n, θ (ui , p) = k=1 k1(ui ∈ Ak,p ) indicates the bin number of ui , where
370
Ak,p = ((k − 1)/p, k/p], k = 1, . . . , p. Then for the inference of the posterior distribution, Gibbs
371
sampling proceeds by drawing from the full-conditional posterior distributions of G, p, and
372
ui (i = 1, . . . , n), for a very large number of iterations. For given p and ui (i = 1, . . . , n), as
373
suggested by the Dirichlet distribution representation of the Dirichlet process in Section 2.1, the
374
full conditional posterior of wp = (w1,p , . . . , wp,p ) is Dirichlet(wp |α1,p , . . . , αp,p ), with
375
αk,p = mG0 (Ak,p ) + nFu (Ak,p ), k = 1, . . . , p,
376
377 where G0 denotes the baseline distribution of the Dirichlet process for G, and Fu denotes the
378 empirical distribution of the latent variables. For given ui (i = 1, . . . , n), the full conditional
379 posterior distribution of p is proportional to
380
n
381
382
π(p) β xi |θ (ui , p), p − θ (ui , p) + 1 .
383 i=1
384
Also, it is straightforward to sample from the full conditional posterior distribution of ui , for
385
i = 1, . . . , n (for details, see Petrone, 1999, p. 385).
386
387 2.3. Dependent Bivariate Model
388
389
A model for constructing a bivariate Dirichlet process has been given in Walker and Muliere
390
(2003). The idea is as follows: Take GX ∼ Π(m, G0 ) and then for some fixed r ∈ {0, 1, 2, . . .},
391
and take z1 , . . . , zr to be independent and identically distributed from GX . Then take
392
GY ∼ Π m + r, (mG0 + r Fr )/(m + r) ,
393
394
where Fr is the empirical distribution of {z1 , . . . , zr }. Walker and Muliere (2003) show that the
395
marginal distribution of GY is Π(m, G0 ). It is possible to have the marginals from different
396
Dirichlet processes. However, it will be assumed that the priors for the two random distributions
397
are the same. It is also easy to show that for any measurable set A, the correlation between
398
GX (A) and GY (A) is given by
399
400 Corr GX (A), GY (A) = r/(m + r)
9. « PMET 11336 layout: SPEC (pmet)reference style: apa file: pmet9096.tex (Ramune) aid: 9096 doctopic: OriginalPaper class: spr-spec-pmet v.2008/12/03 Prn:3/12/2008; 15:54 p. 9/22»
GEORGE KARABATSOS AND STEPHEN G. WALKER
401 and hence this provides an interpretation for the prior parameter r.
402 For modeling continuous test score distributions (FX , FY ), it is possible to construct a bi-
403 variate random Bernstein polynomial prior distribution on (FX , FY ) via the random distributions:
404
p(X)
405 k k−1
406
FX ·; GX , p(X) = GX − GX Beta ·|k, p(X) − k + 1 ,
p(X) p(X)
407 k=1
408 p(Y )
k k−1
409 FY ·; GY , p(Y ) = GY − GY Beta ·|k, p(Y ) − k + 1
410
p(Y ) p(Y )
k=1
411
412
with (GX , GY ) coming from the bivariate Dirichlet process model, and with independent prior
distributions π(p(X)) and π(p(Y )) for p(X) and p(Y ). Each of these random distributions are
413
defined on (0, 1]. However, without loss of generality, it is possible to model observed test scores
414
after transforming each of them into (0, 1). If xmin and xmax denote the minimum and maximum
415
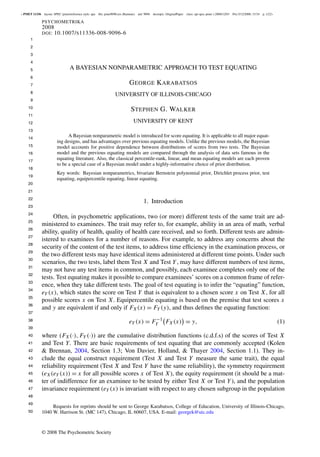
possible scores on a Test X, each observed test score x can be mapped into (0, 1) by the equation
416
x = (x − xmin + )/(xmax − xmin + 2 ), where > 0 is a very small constant, with xmin and xmax
417
denoting the minimum and maximum possible scores on the test. The scores can be transformed
418
back to their original scale by taking x = x (xmax − xmin + 2 ) + xmin − ; similarly, for y and
419
y for Test Y .
420
Under Bayes’ theorem, given observed scores x n(X) = {x1 , . . . , xn(X) } and y n(Y ) =
421
{y1 , . . . , yn(Y ) } on the two tests (assumed to be mapped onto a sample space [0, 1]), the random
422
bivariate Bernstein polynomial prior distribution combines with these data to define a posterior
423
distribution. This posterior distribution, Πn , assigns mass:
424
n(X) n(Y )
A{
425
i=1 fX (xi ) i=1 fY (yi )}Π(dfXY )
426 Πn (A) = n(X) n(Y )
427 Ω{ i=1 fX (xi ) i=1 fY (yi )}Π(dfXY )
428
to any given subset of bivariate densities A ⊆ Ω = {fXY } defined on [0, 1]2 (with respect to
429
Lebesgue measure). For notational convenience, the posterior distribution of the bivariate Bern-
430
stein model is represented by FX , FY |x n(X) , y n(Y ) , where (FX , FY ) (with densities fX and fY )
431
are the marginal distributions of FXY . Recall from Section 2.2 that this posterior distribution can
432
also be represented by wX , wY , p(X), p(Y )|x n(X) , y n(Y ) , where the mixing weights wX and wY
433
each follow a Dirichlet distribution.
434
It is natural to ask whether the random bivariate Bernstein prior satisfies strong (Hellinger)
435
posterior consistency, in the sense that Πn (A ) converges to zero as the sample size n increases,
436
for all > 0. Here, A is a Hellinger neighborhood around f0XY , denoting a true value of fXY .
437
It so happens that this consistency follows from the consistency of each univariate marginal
438
density fX and fY , since as the sample sizes go to infinity, the dependence between the two
439
models disappears to zero (since r is fixed). As mentioned in Section 2.2, posterior consistency
440
of the random Bernstein prior in the univariate case was established by Walker (2004) and Walker
441
et al. (2007). Moreover, as proven by Walker et al. (2007), consistency of the bivariate model is
442 obtained by allowing the prior distribution π(pX ) to satisfy π(pX ) < exp(−4pX log pX ) for
443 all large pX , and similarly for pY . A desirable consequence of this posterior consistency of the
444 true marginal densities, (f0X , f0Y ), corresponding to marginal distribution functions (F0X , F0Y ),
445 posterior consistency is achieved in the estimation of the true equating function, given by eY (·) =
446 −1
F0Y (F0X (·)).
447 Inference of the posterior distribution of the bivariate Bernstein model requires the use of
448 an extension of Petrone’s (1999) Gibbs sampling algorithm, which is described in Appendix II.
449 A MATLAB program was written to implement the Gibbs sampling algorithm, to infer the pos-
450 terior distribution of the bivariate Bernstein polynomial model. This program can be obtained
10. « PMET 11336 layout: SPEC (pmet)reference style: apa file: pmet9096.tex (Ramune) aid: 9096 doctopic: OriginalPaper class: spr-spec-pmet v.2008/12/03 Prn:3/12/2008; 15:54 p. 10/22»
PSYCHOMETRIKA
451 through correspondence with the first author. At each iteration of this Gibbs algorithm, a current
452 set of {p(X), wX } for Test X and {p(Y ), wY } for Test Y is available, from which it is possible to
453 construct the random equating function
454
−1
455 eY (x) = FY FX (x) = y. (5)
456
457 Hence, for each score x on Test X, a posterior distribution for the equated score on Test Y is
−1
458 available. A (finite-sample) 95% confidence interval of an equated score eY (x) = FY (FX (x))
459 is easily attained from the samples of posterior distribution FX , FY |x n , y n . A point estimate of
460 an equated score eY (x) can also be obtained from this posterior distribution. While one conven-
461 tional choice of point-estimate is given by the posterior mean of eY (x), the posterior median
462 point-estimate of eY (·) has the advantage that it is invariant over monotone transformations. This
463 invariance is important considering that the test scores are transformed into the (0, 1) domain,
464 and back onto the original scale of the test scores.
465 As presented above, the Bayesian nonparametric equating method readily applies to the EG
466
design with no anchor test, and the SG design. However, with little extra effort, this Bayesian
467
method can be easily extended to a EG or NG design with an anchor test, or to a counterbal-
468
anced design. For an equating design having an anchor test, it is possible to implement the
469
idea of chained equipercentile equating (Angoff, 1971) to perform posterior inference of the
470
random equating function. In particular, if x n(X) and v n(V1 ) denote the set of scores observed
471
from examinee group 1 who completed Test X and an anchor Test V , and y n(Y ) and v n(V2 )
472
sets of scores observed from examinee group 2 who completed Test Y and the same anchor
473
Test V , then it is possible to perform posterior inference of the random equating functions
−1 −1
474
eY (x) = FY (FV2 (eV1 (x))) and eV1 (x) = FV1 (FX1 (x)), based on sample from the posterior dis-
475
tributions FX , FV1 |x n(X) , v n(V1 ) and FY , FV2 |y n(Y ) , v n(V2 ) each under a bivariate Bernstein prior.
476
For a counterbalanced design, to combine the information of the two examine subgroups 1 and 2
477
in the spirit of von Davier et al. (2004, Section 2.3), posterior inference of the random equating
−1
478
function eY (x) = FY (FX (x)) is attained by taking FX (·) = X FX1 (·) + (1 − X )FX2 (·) and
479
FY (·) = Y FY1 (·) + (1 − Y )FY2 (·), where (FX1 , FX2 , FY1 , FY2 ) are from the posterior distrib-
480
utions FX1 , FY2 |x n(X1 ) , y n(Y2 ) and FX2 , FY1 |x n(X2 ) , y n(Y1 ) under two bivariate Bernstein models,
481
respectively. Also, 0 ≤ X , Y ≤ 1 are chosen weights, which can be varied to determine how
482
much they change the posterior inference of the equating function eY (·).
483
484
485
3. Applications
486
487
The following three subsections illustrate the Bayesian nonparametric model in the equating
488
of test scores arising from the equivalent groups design, the counterbalanced design, and the non-
489
equivalent groups design for chain equating, respectively. The equating results of the Bayesian
490
model will also be compared against the results of the kernel, percentile-rank, linear, and mean
491
models of equating. In so doing, the assumption of independence will be evaluated for each of the
492
three data sets. Before proceeding, it is necessary to review some themes that repeat themselves
493
in the three applications.
494 1. In applying our Bayesian model to analyze each of the three data sets, we assumed the bi-
495 variate Dirichlet process to have baseline distribution G0 that equals the Beta(1, 1) distrib-
496 ution. Also, we assumed a relatively noninformative prior by taking m = 1 and r = 4, re-
497 flecting the (rather uncertain) prior belief that the correlation of the scores between two tests
498 is 0.8 = r/(m + r). In particular, the Beta(1, 1) distribution reflects the prior belief that the
499 different possible test scores are equally likely, and the choice of “prior sample size” of m = 1
500 will lead to a data-driven posterior distribution of (FX , FY ). This is true especially considering
11. « PMET 11336 layout: SPEC (pmet)reference style: apa file: pmet9096.tex (Ramune) aid: 9096 doctopic: OriginalPaper class: spr-spec-pmet v.2008/12/03 Prn:3/12/2008; 15:54 p. 11/22»
GEORGE KARABATSOS AND STEPHEN G. WALKER
501 that among the three data sets analyzed, the smallest sample size for a group of examinees was
502 about 140 (i.e., 140 times the prior sample size), and the other two data sets had a sample size
503 of around 1,500 for each group of examinees. Furthermore, up to a constant of proportionality,
504 we specify an independent prior distribution of π(p) ∝ exp(−4p log p) for each p(X) and on
505 p(Y ). As discussed in Sections 2.2 and 2.3, this choice of prior ensures the consistency of the
506 posterior distribution of (FX , FY ).
507 2. For each data set analyzed with the Bayesian model, we implemented the Gibbs sampling al-
508 gorithm (Appendix II) to generate 10,000 samples from the posterior distribution of (FX , FY ),
509 including (p(X), p(Y )), after discarding the first 2,000 Gibbs samples as burn-in. We found
510 that Gibbs sampler displayed excellent mixing in the posterior sampling. Also, while we chose
511 the first 2,000 Gibbs samples as burn in, this number was a conservative choice because trace
512 plots suggested that convergence was achieved after the first 500 samples.
513 3. For the percentile rank model, the estimate (GX , GY ) is given by the empirical distribution
514 estimates of the scores in Test X and Test Y , respectively. For either the linear or the mean
515 2 2
equating model, the estimate (μX , σX , μY , σY ) is given by sample means and variances of the
516 test scores. For the kernel model, the estimate (GX , GY ) of the discrete test score distributions
517 are obtained as marginals of the estimate GXY obtained via maximum likelihood estimation of
518 a chosen log-linear model. The log-linear model needs to be specified differently for each of
519 the three applications, since they involve different equating designs (von Davier et al., 2004).
520 Also, the percentile-rank, linear, and mean equating models, 95% confidence intervals of the
521 equated scores were estimated from 10,000 bootstrap samples, each bootstrap sample taking
522 n(X) and n(Y ) samples with replacement from the empirical distributions of test scores, GX
523 and GY , and then performing equipercentile equating using these samples. For single-group
524 designs, n = n(X) = n(Y ) samples are taken with replacement from the bivariate empirical
525 distribution GXY having univariate marginals (GX , GY ). Also, unless otherwise noted, for the
526 kernel equating model, 95% confidence intervals of the equated scores were estimated from
527 10,000 bootstrap samples, each bootstrap sample involving taking n(X) and n(Y ) samples
528 with replacement from the continuous distribution estimates of the test scores, FX (·|θ ) and
529 FY (·|θ ), and then performing equipercentile equating using these samples. Efron and Tibshi-
530 rani (1993) suggest that at least 500 bootstrap samples are sufficient for estimating confidence
531 intervals.
532
533
534
3.1. Equivalent-Groups Design
535 The Bayesian nonparametric equating model is demonstrated in the analysis of a large data
536 set generated from an equivalent groups (EG) design. This data set, obtained from von Davier
537 et al. (2004, Chap. 7, p. 100), consists of 1,453 examinees who completed Test X, and 1,455
538 examinees completing Test Y of a national mathematics exam. Each test has 20 items, and is
539 scored by number correct. The average score on Test X is 10.82 (s.d. = 3.81), and the average
540 score on Test Y is 11.59 (s.d. = 3.93), and so the second test is easier than the first.
541 Figure 1 plots the 95% confidence interval of GX (x) − GY (x) (x = 0, 1, . . . , 20), estimated
542 from 10,000 bootstrap samples from the empirical distributions (GX , GY ). The plot suggests that
543 GX and GY have quite similar shapes, and thus are not independent (as assumed by the kernel,
544 percentile-rank, linear, and mean models of equating). In fact, according to the plot, the 95%
545 confidence interval of GX (x) − GY (x) envelopes 0 for all score points except for scores 5, 8,
546 18, and 19. Clearly, there is a need to model the similarity (correlation) between the test score
547 distributions. Furthermore, according to the confidence interval, the two c.d.f.s of the test score
548 distributions differ by about .045 in absolute value at most.
549 For the kernel model, von Davier et al. (2004, Chap. 7) reported estimates of the discrete
550 score distributions (GX , GY ) through maximum likelihood estimation of a joint log-linear model,
12. « PMET 11336 layout: SPEC (pmet)reference style: apa file: pmet9096.tex (Ramune) aid: 9096 doctopic: OriginalPaper class: spr-spec-pmet v.2008/12/03 Prn:3/12/2008; 15:54 p. 12/22»
PSYCHOMETRIKA
551
552
553
554
555
556
557
558
559
560
561
562
563
564
565
566
567
568
569
F IGURE 1.
570
The 95% confidence interval of the difference GX (x) − GY (x) (x = 0, 1, . . . , 20) is given by the thick jagged lines. The
571 horizontal straight line indicates zero differences for all points of x.
572
573 TABLE 1.
574 Comparison of the 95% confidence (credible) intervals of 5 equating methods: EG design.
575
Bayes Kernel PR Linear
576
Kernel 2–18
577
PR 1–16, 20 19
578
Linear 2–15, 20 20 19–20
579
Mean 0, 2–16, 20 20 1–3, 19–20 None
580
581
582 and they also report the bandwidth estimates (hX = .62, hX = .58). For the Bayesian model, the
583 marginal posterior distributions of p(X) and of p(Y ) concentrated on 1 and 2, respectively. Fig-
584 ure 2 presents the posterior median estimate of the equating function for the Bayesian equating
585 model, and the estimate of the equating functions for the other four equating models. This fig-
586 ure also presents the 95% confidence interval estimates of the equating functions. For the kernel
587 model, the 95% confidence interval was obtained from the standard error of equating estimates
588 reported in von Davier et al. (2004, Table 7.4). This figure shows that the equating function es-
589 timate of the Bayesian model differs from the estimates obtained from the other four equating
590 models. Table 1 presents pairwise comparisons of the equating function estimates between the
591 five equating models. This table reports the values of x which provide no overlap between the
592 95% confidence interval of the eY (x) estimate, between two models. Among other things, this
593 table shows that the equating function estimate of the Bayesian model is very different from the
594 equating function estimates of the other four equating models. The assumption of independence
595 between (FX , FY ) may play a role, with independence not assumed in the Bayesian model, and
596 independence assumed by the other four models. Though, as shown earlier, the data present evi-
597 dence against the assumption of independence.
598 Also, this table shows that the equating function estimate of the kernel model do not differ
599 much with the equating estimates of the linear and mean equating models. Furthermore, upon
600 closer inspection, the kernel, linear, and mean equating models equated some scores of Test X
13. « PMET 11336 layout: SPEC (pmet)reference style: apa file: pmet9096.tex (Ramune) aid: 9096 doctopic: OriginalPaper class: spr-spec-pmet v.2008/12/03 Prn:3/12/2008; 15:54 p. 13/22»
GEORGE KARABATSOS AND STEPHEN G. WALKER
601
602
603
604
605
606
607
608
609
610
611
612
613
614
615
616
617
618
619
620
621
622
623
624
625
626
627
628
629
F IGURE 2.
For each of the five equating methods, the point-estimate of eY (·) (thick line) and the 95% confidence interval (thin lines).
630
631
632 with scores outside the range of scores for Test Y . For example, the kernel model equated a score
633 of 20 on Test X with a score of 20.4 on Test Y , and the Test X scores of 0 and 20 led to equated
634 scores on Test Y with 95% confidence intervals that included values outside the 0–20 range of
635 test scores. The linear and mean equating models had similar issues in equating.
636
637 3.2. Counterbalanced Design
638 Here, the focus of analysis is a data set generated from a counterbalanced single-group
639 design (CB design). These data were collected from a small field study from an international
640 testing program, and were obtained from von Davier et al. (2004, Tables 9.7–8). Test X has 75
641 items, Test Y has 76 items, and both tests are scored by number correct. Group 1 consists of 143
642 examinees completed Test X first, then Test Y . The tests of this single-group design are referred
643 to as (X1 , Y2 ). The average score on Test X1 is 52.54 (s.d. = 12.40), and for Test Y2 it is 51.29
644 (s.d. = 11.0). Group 2 consists of 140 examinees completed Test Y first, then Test X, and the
645 tests of this single-group design are referred to as (Y1 , X2 ). The average score on Test Y1 is 51.39
646 (s.d. = 12.18), and for Test X2 it is 50.64 (s.d. = 13.83).
647 Since a pair of test scores is observed from every examinee in each of the two single
648 group designs, it is possible to evaluate the assumption of independence with the Spearman’s
649 rho statistic. By definition, if GXY is a bivariate c.d.f. with univariate margins (GX , GY ), and
650 (X, Y ) ∼ GXY , then Spearman’s rho is the correlation between c.d.f.s GX (X) and GY (Y ) (see
14. « PMET 11336 layout: SPEC (pmet)reference style: apa file: pmet9096.tex (Ramune) aid: 9096 doctopic: OriginalPaper class: spr-spec-pmet v.2008/12/03 Prn:3/12/2008; 15:54 p. 14/22»
PSYCHOMETRIKA
651 Joe, 1997, Section 2.1.9). The Spearman’s rho correlation is .87 between the scores of Test X1
652 and Test Y2 , and this correlation is .86 between the scores of Test X2 and Test Y1 . So clearly, the
653 assumption of independence does not hold in either data set. In contrast, a Spearman’s rho cor-
654 relation of 0 (independence) is assumed for the mean, linear, percentile-rank, and kernel models
655 of equating.
656 In the kernel and percentile-rank methods for the counterbalanced design, the estimate of
657 the equating function,
658
−1
659 eY (x; θ , X, Y ) = FY FX (x; θ , X )|θ , Y ,
660
661 is obtained through weighted estimates of the score probabilities, given by:
662
663
gX (·) = X gX1 (·) + .(1 − X )gX2 (·), gY (·) = Y gY1 (·) + .(1 − Y )gY2 (·),
664
gX1 (·) = gX1 ,Y2 (·, yl ), gX2 (·) = gX2 ,Y1 (·, yl ),
665
l l
666
667 gY1 (·) = gX2 ,Y1 (xk , ·), gY2 (·) = gX1 ,Y2 (xk , ·),
668 k k
669
670
while in linear and mean equating methods, the weights are put directly on the continuous distri-
671
butions, with
672
FX (·; θ , X) = X NormalX1 ·|μX1 , σX1 + (1 −
2
X )NormalX2 ·|μX2 , σX2 ,
2
673
674 FY (·; θ , Y) = Y NormalY1 ·|μY1 , σY1 + (1 −
2
Y )NormalY2 ·|μY2 , σY2 .
2
675
676 Here, X , Y ∈ [0, 1] are weights chosen to combine the information of the two groups of ex-
677 aminees who completed Test X and Test Y in different orders. This idea for equating in the
678 counterbalanced design is due to von Davier et al. (2004, Section 2.3). As they describe, the
679 value X = Y = 1 represents a default choice because it represents the most conservative use
680 of the data in the CB design, while the choice of X = Y = 1/2 is the most generous use of the
681 (X2 , Y2 ) data because it weighs equally the two versions of Test X and of Test Y . One approach
682 is to try these two different weights, and see what effect they have on the estimated equated func-
683 tion. von Davier et al. (2004, Chap. 9) obtain the estimate (GX , GY ) by selecting and obtaining
684 maximum likelihood estimates of a joint log-linear model for the single group designs (X1 , Y2 )
685 and (Y1 , X2 ). Then conditional on that estimate, they found (von Davier’s et al. 2004, p. 143)
686 that the bandwidth estimates are (hX = .56, hY = .63) under X = Y = 1/2, and the band-
687 width estimates are (hX = .56, hY = .61) under X = Y = 1. Through the use of bootstrap
688 methods, it was found that for kernel, percentile-rank, linear, and mean equating methods, the
689 95% confidence intervals for bootstrap samples of eY (x; 1, 1) − eY (x; 1 1 ) enveloped 0 for all
22
690 scores x = 0, 1, . . . , 75. This result suggests that the equating function under X = Y = 1/2
691 is not significantly different than the equating function under X = Y = 1. Also, no equating
692 difference was found for the Bayesian model. Using the chain equating methods described at
693 the end of Section 2.3, it was found that the 95% confidence interval of the posterior distribu-
694 tion of eY (x; 1, 1) − eY (x; 1 1 ) enveloped 0 for all scores x = 0, 1, . . . , 75. Also, the marginal
22
695 posterior mean of p(X1 ), p(Y2 ), p(X2 ), and p(Y1 ) was 2.00 (var = .01), 2.01 (var = .19), 2.00
696 (var = .001), and 2.01 (var = .02), respectively.
697 Figure 3 presents the point-estimate of eY (·; 1 1 ) of the equating function for each of the five
22
698 equating models, along with the corresponding 95% confidence (credible) intervals. As shown in
699 Table 2, after accounting for these confidence intervals, there were no differences in the equating
700 function estimates between the Bayesian equating model and the kernel equating model, and
15. « PMET 11336 layout: SPEC (pmet)reference style: apa file: pmet9096.tex (Ramune) aid: 9096 doctopic: OriginalPaper class: spr-spec-pmet v.2008/12/03 Prn:3/12/2008; 15:54 p. 15/22»
GEORGE KARABATSOS AND STEPHEN G. WALKER
701
702
703
704
705
706
707
708
709
710
711
712
713
714
715
716
717
718
719
720
721
722
723
724
725
726
727
728
729 F IGURE 3.
For each of the five equating methods, the point-estimate of eY (·) (thick line) and the 95% confidence interval (thin lines).
730
731
732 TABLE 2.
Comparison of the 95% confidence (credible) intervals of 5 equating methods: CB design.
733
734 Bayes Kernel PR Linear
735
Kernel None
736 PR 0–14, 75 0–1
737 Linear 0–6, 68–75 None 0–11, 75
738 Mean 74–75 None 0–16, 22–26 0–35, 65–75
739
740
741 there were no differences between the kernel equating model and the linear and mean equating
742 models. Also, for scores of x ranging from 0 to 30, the kernel and the percentile-rank models
743 each have an equating function estimate with a relatively large 95% confidence interval, and for
744 the percentile-rank model, the equating function estimate is flat in that score range. A closer
745 inspection of the data reveals that this is due to the very small number of test scores in the 0 to
746 30 range. In fact, for each test, no more than 16 scores fall in that range. The confidence interval
747 of the Bayesian method does not suffer from such issues. Also, among all five equating models,
748 the kernel model had the largest 95% confidence interval. Upon closer inspection, for x scores of
749 0–4 and 72–75, the kernel model equated scores on Test Y having 95% confidence intervals that
750 included values outside the [0, 76] score range for Test Y . Similar issues were observed for the
16. « PMET 11336 layout: SPEC (pmet)reference style: apa file: pmet9096.tex (Ramune) aid: 9096 doctopic: OriginalPaper class: spr-spec-pmet v.2008/12/03 Prn:3/12/2008; 15:54 p. 16/22»
PSYCHOMETRIKA
751 linear and mean equating models in equating the x score of 75, and for the mean equating model
752 in equating the x score of 0.
753
754 3.3. Nonequivalent Groups Design and Chained Equating
755
756
This section concerns the analysis of a classic data set arising from a nonequivalent groups
757
(NG) design with internal anchor, and it was discussed in Kolen and Brennan (2004). The first
758
group of examinees completed Test X, and the second group of examinees completed Test Y ,
759
both groups being random samples from different populations. Here, Test X and Test Y each
760
have 36 items and is scored by number correct, and both tests have 12 items in common. These
761
12 common items form an internal anchor test because they contribute to the scoring of Test
762
X and of Test Y . While the two examinee groups come from different populations, the anchor
763
test provides a way to link the two groups and the two tests. The anchor test completed by the
764
first examinee group (population) is labeled as V1 and the anchor test completed by the second
765
examinee group (population) is labeled as V2 , even though both groups completed the same
766
anchor test. The first group of 1,655 examinees had a mean score of 15.82 (s.d. = 6.53) on Test
767
X, and a mean score of 5.11 (s.d. = 2.38) for the anchor test. The second group of examinees
768
had a mean score of 18.67 (s.d. = 6.88) on Test Y , and a mean score of 5.86 (s.d. = 2.45) on
769
the anchor test. Also, the scores of Test X1 and Test V1 have a Spearman’s rho correlation of
770
.84, while the Spearman’s rho correlation is .87 between the scores of Test V2 and Test Y2 . In
771
contrast, a zero correlation (independence) is assumed for the mean, linear, percentile-rank, and
772
kernel models of equating.
773
In the analysis of these data from the nonequivalent groups design, chained equipercentile
774
equating was used. Accordingly, under either the kernel, percentile-rank, linear, and mean equat-
−1
775
ing models, the estimate of the equating function is given by eY (x; θ ) = FY2 (FV2 (eV1 (x); θ )|θ )
−1
776 for all x, where eV1 (·; θ ) = FV1 (FX1 (·; θ )|θ ), and θ is the parameter estimate of the correspond-
777 ing model. In the kernel method, to obtain the estimate of the marginals (GX , GY ) through
778 log-linear model fitting, it was necessary to account for the structural zeros in the 37 × 13 contin-
779 gency table for scores on Test X and Test V1 , and in the 37 × 13 contingency table for the scores
780 on Test Y and Test V2 . These structural zeros arise because given every possible score x on
781 Test X (and every possible score y on Test Y ), the score on the internal anchor test ranges from
782 max(0, x − 24) to min(x, 12) (ranges from max(0, y − 24) to min(y, 12)), while for every given
783 score v on the anchor test, the score on Test X (Test Y ) ranges from v to 36 − (12 − v). Therefore,
784 for the two tables, log linear models were fit only to cells with no structural zeros (e.g., Holland
785 and Thayer 2000). In particular, for each table, 160 different versions of a loglinear model were
786 fit and compared on the basis of Akaike’s Information Criterion (AIC; Akaike, 1973), and the one
787 with the lowest AIC was chosen as the model for subsequent analysis. Appendix III provides the
788 technical details about the loglinear model fitting. After finding the best-fitting loglinear model
789 for each of the two tables, estimates of the marginal distributions (GX , GY ) were derived, and
790 then bandwidth estimates (hX = .58, hY = .61, hV1 = .55, hV2 = .59) were obtained using the
791 least-squares minimization method described in Section 1. In the analysis with the Bayesian
792 model, a chained equipercentile method was implemented, described at the end of Section 2.3.
793 The marginal posterior distribution of p(X1 ), p(V1 ), p(V2 ), and p(Y2 ) concentrated on values
794 of 6, 1, 3, and 5, respectively.
795 Figure 4 presents the equating function estimate for each of the five models, along with
796 their corresponding 95% confidence interval. It is shown that for the percentile-rank models, the
797 95% confidence interval is relatively large for x scores ranging between 20 to 36. According to
798 Table 3, taking into account the 95% confidence intervals, the equating function estimate of the
799 Bayesian model again differed from the estimate yielded by the other four models. The equating
800 function estimate of the kernel model did not differ much with the estimates of the linear model.
17. « PMET 11336 layout: SPEC (pmet)reference style: apa file: pmet9096.tex (Ramune) aid: 9096 doctopic: OriginalPaper class: spr-spec-pmet v.2008/12/03 Prn:3/12/2008; 15:54 p. 17/22»
GEORGE KARABATSOS AND STEPHEN G. WALKER
801
802
803
804
805
806
807
808
809
810
811
812
813
814
815
816
817
818
819
820
821
822
823
824
825
826
827
828
829 F IGURE 4.
830 For each of the five equating methods, the point-estimate of eY (·) (thick line) and the 95% confidence interval (thin lines).
831
832 TABLE 3.
833
Comparison of the 95% confidence (credible) intervals of 5 equating methods: NG design.
834 Bayes Kernel PR Linear
835
Kernel 11–32
836
PR 0–1, 7–36 0–1, 10, 11, 36
837 Linear 11–32, 36 None 0–1, 5–15, 33–36
838 Mean 0–7, 15–36 0–36 0, 3–20, 31–36 0–35
839
840
841 Also, upon closer inspection, the kernel model equated scores of x = 0, 1, 2 with scores below
842 the range of Test Y scores. The model also equated an x score of 36 with a score on Test Y having
843 a 95% confidence interval that includes values above the range of Test Y scores. The linear and
844 mean equating models had similar issues.
845
846
847 4. Conclusions
848
849 This study introduced a Bayesian nonparametric model for test equating. It is defined by
850 a bivariate Bernstein polynomial prior distribution that supports the entire space of (random)
18. « PMET 11336 layout: SPEC (pmet)reference style: apa file: pmet9096.tex (Ramune) aid: 9096 doctopic: OriginalPaper class: spr-spec-pmet v.2008/12/03 Prn:3/12/2008; 15:54 p. 18/22»
PSYCHOMETRIKA
851 continuous distributions (FX , FY ), with this prior depending on the bivariate Dirichlet process.
852 The Bayesian equating model has important theoretical and practical advantages over all previous
853 approaches to equating. One key advantage of the Bayesian equating model is that it accounts
854 for the realistic situation that the two distributions of test scores (FX , FY ) are correlated, instead
855 of independent as assumed in the previous equating models. This dependence seems reasonable,
856 considering that in practice, the two tests that are to be equated are designed to measure the same
857 psychological trait. Indeed, for each of the three data sets that were analyzed, there is strong
858 evidence against the assumption of independence. While perhaps the Bayesian model of equating
859 requires more computational effort and mathematical expertise than the kernel, linear, mean, and
860 percentile-rank models of equating, the extra effort is warranted considering the key advantages
861 of the Bayesian model. It can be argued that the four previous models make rather unrealistic
862 assumptions about data, and carry other technical issues such as asymmetry, out-of-range equated
863 scores. The Bayesian model outperformed the other models in the sense it avoids such issues.
864 Doing so led to remarkably different equating function estimates under the Bayesian model.
865 Also, the percentile-rank, linear, and mean equating models were proven to be special cases of
866 the Bayesian nonparametric model, corresponding to a very strong choice of prior distribution
867 for the continuous test score distributions (FX , FY ). In future research, it may be of interest
868 to explore alternative Bayesian approaches to equating that are based on other nonparametric
869 priors that account for dependence between (FX , FY ), including the priors described by De Iorio,
870 Müller, Rosner, and MacEachern (2004) and by Müller, Quintana, and Rosner (2004).
871
872
873 Acknowledgements
874
875 Under US Copyright, August, 2006. We thank Alberto Maydeu-Olivares (Action Editor),
876 Alina von Davier, and three anonymous referees for suggestions to improve the presentation of
877 this manuscript.
878
879
880 Appendix I. A Proof About Special Cases of the IDP Model
881
882 It is proven that the linear equating model, the mean equating model, and the percentile-rank
883 equating model, is each a special case the IDP model. To achieve fullest generality in the proof,
884 consider that a given equating model assumes that the continuous distributions (FX , FY ) are
885 governed by some function ϕ of a finite-dimensional parameter vector θ . This way, it is possible
886 to cover all the variants of these three models, including the Tucker, Levine observed score,
887 Levine true score, and Braun–Holland methods of linear (or mean) equating, the frequency-
888 estimation approach to the percentile-rank equating model, all the item response theory methods
889 of observed score equating, and the like (for details about these methods, see Kolen & Brennan,
890 2004).
891
892 Theorem 1. The linear equating, the mean equating model, and the percentile-rank equating
893 model is each a special case of the IDP model, where m(X), m(Y ) → ∞, and the baseline
894 distributions (G0X , G0Y ) of the IDP are defined by the corresponding equating model.
895
896 Proof: Recall from Section 2.1 that in the IDP model, the posterior distribution of (FX , FY ) is
897 given by independent beta distributions, with posterior mean E[FX (·)] = G0X (·) and variance
898 Var[FX (·)] = {G0X (A)[1 − G0X (A)]}/(m(X) + 1), and similarly for FY . First, define the base-
899 line distributions (G0X , G0Y ) of the IDP model according to the distributions assumed by the lin-
900 ear equating model, with G0X (·) = Normal(·|μX , σX ) and G0Y (·) = Normal(·|μY , σY ), where
2 2
19. « PMET 11336 layout: SPEC (pmet)reference style: apa file: pmet9096.tex (Ramune) aid: 9096 doctopic: OriginalPaper class: spr-spec-pmet v.2008/12/03 Prn:3/12/2008; 15:54 p. 19/22»
GEORGE KARABATSOS AND STEPHEN G. WALKER
901 (μX , σX , μY , σY ) is some function ϕ of a parameter vector θ . Taking the limit m(X), m(Y ) → ∞
2 2
902 leads to Var[FX (·)] = Var[FY (·)] = 0, and then the posterior distribution of (FX , FY ) assigns
903 probability 1 to (G0X , G0Y ), which coincide with the distributions assumed by the linear equat-
904 ing model.
905 The same is true for the mean equating model, assuming σX = σY . The same is also true
2 2
906 p(X) ∗
for the percentile-rank model, assuming G0X (·) = k=1 gX (·; ϕ(θ ))Uniform(·|xk − 1 , xk + 1 )∗
2 2
907 p(Y ) ∗ ∗
and G0Y (·) = k=1 gY (·; ϕ(θ ))Uniform(·|yk − 1 , yk + 1 ), for some function ϕ depending on
2 2
908
a parameter vector θ . This completes the proof.
909
910
911
Appendix II. The Gibbs Sampling Algorithm for Bivariate Bernstein Model
912
913 As in Petrone’s (1999) Gibbs algorithm for the one-dimensional model, latent vari-
914 ables are used to sample from the posterior distribution. In particular, an auxiliary vari-
915 able ui is defined for each data point xi (i = 1, . . . , n(X)), and an auxiliary variable ui(Y )
916 is defined for each data point yi (i = 1, . . . , n(Y )), such that u1(X) , . . . , un(X) |p(X), GX
917 are i.i.d. according to GX , and u1(Y ) , . . . , un(Y ) |p(Y ), GY are i.i.d. according to GY . Then
918 x1 , . . . , xn(X) |p(X), GX , {u1(X) , . . . , un(X) } are independent, and y1 , . . . , yn(X) |p(Y ), GY , and
919 {u1(Y ) , . . . , un(Y ) } are also independent, with joint (likelihood) density:
920
n(X)
921
922
β xi |θ ui(X) , p(Y ) , p(X) − θ ui(X) , p(Y ) + 1
923 i=1
924 n(Y )
925 × β yi |θ ui(Y ) , p(Y ) , p(Y ) − θ ui(Y ) , p(Y ) + 1 .
926 i=1
927
Then for the inference of the posterior distribution, Gibbs sampling proceeds by drawing from the
928
full-conditional posterior distributions of GX , GY , p(X), p(Y ), ui(X) (i = 1, . . . , n(X)), ui(Y )
929
(i = 1, . . . , n(Y )), and zj (j = 1, . . . , r), for a very large number of iterations.
930
The sampling of the conditional posterior distribution of GX is performed as follows. Note
931
that given p(X), the random Bernstein polynomial density fX (x; GX , p(X)) depends on GX
932
only through the values GX (k/p(X)), k = 0, 1, . . . , p(X), and thus GX is fully described by the
933
random vector wp(X) = (w1,p(X) , . . . , wp(X),p(X) ) , with wk,p(X) = GX (k/p(X)] − GX ((k −
934
1)/p(X)], k = 1, . . . , p(X), that random vector having a Dirichlet distributions (e.g., see Sec-
935
tion 2.1). This considerably simplifies the sampling of the conditional posterior distribution of
936
GX . So given p(X), {u1(X) , . . . , un(X) } and {z1 , . . . , zr }, the full conditional posterior distribu-
937
tion of wp(X) (i.e., of GX ) is Dirichlet(wp(X) |α1,p(X) , . . . , αp(X),p(X) ), with
938
939 αk,p(X) = mG0 (Ak,p ) + r Fr (Ak,p(X) ) + n(X)Fu(X) (Ak,p(X) ), k = 1, . . . , p(X)
940
941 where Fu(X) is the empirical distribution of {u1(X) , . . . , un(X) }, and
942
Ak,p(X) = (k − 1)/p(X) , k/p(X)].
943
944 Likewise, given p(X), {u1(Y ) , . . . , un(Y ) } and {z1 , . . . , zr }, the full conditional posterior distrib-
945 ution of wp(Y ) (i.e., of GY ) is Dirichlet(wp(Y ) |α1,p(Y ) , . . . , αp(Y ),p(Y ) ).
946 Given {u1(X) , . . . , un(X) }, the full conditional posterior distribution of p(X) is proportional
947 to
948
n(X)
949
π p(X) β xi |θ ui(X) , p(X) , p(X) − θ ui(X) , p(X) + 1 ,
950
i=1
20. « PMET 11336 layout: SPEC (pmet)reference style: apa file: pmet9096.tex (Ramune) aid: 9096 doctopic: OriginalPaper class: spr-spec-pmet v.2008/12/03 Prn:3/12/2008; 15:54 p. 20/22»
PSYCHOMETRIKA
951 and given {u1(Y ) , . . . , un(Y ) }, the full conditional posterior distribution of p(X) is defined simi-
952 larly. Thus, a straightforward Gibbs sampler can be used for p(X) and for p(Y ).
953 Given p(X) and {z1 , . . . , zr }, the sampling of each latent variable ui(X) (i = 1, . . . , n(X))
954 from its conditional posterior distribution, proceeds as follows. With probability
955
956 β xl |θ ul(X) , p(X) , p(X) − θ ul(X) , p(X) + 1 /(κ1 + κ2 ),
957
958 l = i, set ui(X) equal to ul(X) , where
959
960 p(X)
961 κ1 = mG0 (Ak,p ) + r Fr (Ak,p ) β xi |k, p(X) − k + 1 ,
962 k=1
963
κ2 = β xq |θ uq(X) , p(X) , p(X) − θ uq(X) , p(X) + 1 .
964
q=i
965
966
Otherwise, with probability κ1 /(κ1 + κ2 ), draw ui(X) from the mixture distribution:
967
968
πG0 (Ak ∗ ,p(X) ) + (1 − π)Uniform zk ∈ (Ak ∗ ,p(X) ) ,
969
970
with mixture probability defined by π = m/(m + r Fr ((k ∗ − 1)/p(X), k ∗ /p(X)]), where k ∗ is a
971
random draw from a distribution on k = 1, 2, . . . that is proportional to
972
973
mG0 (Ak ∗ ,p ) + r Fr (Ak ∗ ,p ) β xi |k, p(X) − k + 1 .
974
975
Also, Unif{z ∈ (a, b]} denotes a uniform distribution on a discrete set of values falling in a
976
set (a, b]. Each latent auxiliary variable ui(Y ) (i = 1, . . . , n(Y )) is drawn from its conditional
977
posterior distribution in a similar manner (replace p(X) with p(Y ), the ui(X) s with ui(Y ) s, and
978
the xi s with yi s).
979
Furthermore, up to a constant of proportionality, the full conditional posterior density of the
980
variables {z1 , . . . , zr } is given by
981
982
z1 , . . . , zr |wp(X) , wp(Y ) , p(X), p(Y )
983
984 ∝ π(z1 , . . . , zr )dir(wp(X) |α1,p(X) , . . . , αp(X),p(X) )dir(wp(Y ) |α1,p(Y ) , . . . , αp(Y ),p(Y ) ),
985
986 where dir(w|α1,p , . . . , αp,p ) denotes the density function for the Dirichlet distribution, and
987
988 αk,p(X) = mG0 (Ak,p ) + r Fr (Ak,p ) + n(X)Fu (Ak,p ), k = 1, . . . , p(X).
989
990
Also, π(z1 , . . . , zr ) denotes the density function for the first r samples from a Pólya-urn scheme
991
with parameters (m, G0 ); see, for example, Blackwell and MacQueen (1973).
992 In particular, to generate a sample of each latent zj (j = 1, . . . , r) from its full conditional
993 posterior distribution, the following steps are taken. Let
994
995
A1,t = (c1 = 0, c2 ], A2,t = (c2 , c3 ], ...,
996 Al,t = (cl−1 , cl ], ..., At,t = (ct−1 , ct = 1],
997
998 denote sets formed by taking the union defined by
999
1000 {0, c2 , . . . , ct−1 , 1} = k/p(X) : k = 1, . . . , p(X) ∪ k/p(Y ) : k = 1, . . . , p(Y ) ,