SlideShare ist ein Scribd-Unternehmen logo
1 von 31
Social Network Analysis & Interstate Mobility Matthew Hendrickson & Brock Tibert Bentley University Saratoga Springs, NY November 16, 2010
Probably what you are thinking of...
Data Driven Recomendations
You’ve heard of the 6 degrees of Separation (or Kevin Bacon)...
One study says it’s more like 5 http://www.sysomos.com/insidetwitter/sixdegrees/
Underlying Structure of Networks http://www.consultmark.ie/blog/wp-content/uploads/2009/11/basic-social-network.jpg http://en.wikipedia.org/wiki/Social_network
SNA – The Basics (Scott, 2000) A B C
Sociomatrix (Scott, 2000) A B C
Real World Applications Numerous studies Migration Friend Recommendations Marketing Military Disease Control Etc.
Search Trends – Statistics Packages http://www.r4stats.com/popularity
R has gained ground.... http://www.r4stats.com/popularity
Increasing Popularity of R http://www.r4stats.com/popularity
Integration with SPSS
The reason we are here..... Data: IPEDS 2008 Fall Enrollment Survey – Migration Institutional Characteristics - Directory Information Procedure Public/Private not-for-profit (4-year) Degree Granting Continental 48 states + DC Pset4flg = 1 Removed Students who enrolled in home state Military schools
Most likely used to this http://www.postsecondary.org
Same Chart using Our Dataset
Basic Choropleth Map
Spider Network Graph with Map Overlay
Let’s highlight data of interest         300+ < 300
First Plot – Circle Layout You will see an image if you stare long enough...
Another Way to Visualize the Network
Can Highlight States of Interest
Histogram of Enrollment Volume Mean      148 Median     28
METRICS
Limitations ,[object Object],The migration patterns don’t include international countries Need to filter the data to remove edges that are small in volume Policy implications were omitted from this discussion since they will vary depending upon the type of institution. Policy development and evaluation using SNA has also been limited regarding publications (Van DerValk, Gijsbers 2010)
References and Links Andre, M., Ijaz, K., Tilinghas, J.D., Krebs, V.E., Diem, L.A., Metchock, B., Crisp, T., & McElroy, P.D. (2006). Transmission Network Analysis to Complement Routing Tuberculosis Contact Investigations. American Journal of Public Health, 96. Cahill, Mark. (November 2009). Basics of Network Theory for Social Network Analysis (SNA) Part 1. Retrieved November 11, 2010, http://www.consultmark.ie/blog/wp-content/uploads/2009/11/basic-social-network.jpg Cheng, A. (April 2010). In Six Degrees of Separation, Twitter Style. Retrieved November 11, 2010, http://www.sysomos.com/insidetwitter/sixdegrees/ Doyle, S. (2007). The Role of Social Networks in Marketing. Journal of Database Marketing & Customer Strategy Management, 15, 60-64. DOI: 10.1057/palgrave.dbm.3250070. Hsu, W.H., King, A.L., Paradesi, M.S.R., Pydimarri, T., & Weninger, T. (2006). Collaborative and Structural Recommendation of Friends using Weblog-based Social Network Analysis. AAAI Spring Symposia 2006 on Computational Approaches to Analysing Weblogs. Maier, G. (2005). Internal Migration between US States – A Social Network Analysis. Retrieved November 13, 2010, http://iir-hp.wu-wien.ac.at/sre-disc/sre-disc-2005_04.pdf Muenchen, R.A. (2010). In The Popularity of Data Analysis Software. Retrieved November 11, 2010, http://www.r4stats.com/popularity ntamas (User of Last.fm). (n.d.). In Reconstructing the Structure of the World-Wide Music Scene with Last.fm. Retrieved November 11, 2010, http://sixdegrees.hu/last.fm/index.html Postsecondary.org (April 2010). Interstate Migration of College Freshmen 1986 to 2008. Postsecondary Education Opportunity, 214. Retrieved from http://www.postsecondary.org/last12/214_410pg1_16.pdf  Scott, J.P. (2000). Social Network Analysis: A Handbook 2nd Edition. London: Sage Publications. Social Network. (n.d.). In Wikipedia. Retrieved November 11, 2010, http://en.wikipedia.org/wiki/Social_network VosFellman, P. & Wright, R. (2003). Modeling Terrorist Networks – Complex Systems at the Mid-Range. Retrieved November 13, 2010, http://www.psych.lse.ac.uk/complexity/Conference/FellmanWright.pdf
Resources Drew Conway ZIA http://drewconway.com/zia/ Quick-R www.statmethods.net R4Stats. http://www.r4stats.com/popularity R for SAS and SPSS Users. http://oit.utk.edu/scc/RforSAS&SPSSusers.pdf R Links for the Beginner on World Statistics Day. http://www.r-bloggers.com/r-links-for-the-beginner-on-world-statistics-day/ R Project for Statistical Computing. http://www.r-project.org/ Simple R – Using R for Introductory Statistics. http://cran.r-project.org/doc/contrib/Verzani-SimpleR.pdf Social Network Analysis Resources for R. http://jeromyanglim.blogspot.com/2009/08/social-network-analysis-resources-for-r.html Software for Exploratory Data Analysis and Statistical Modeling. http://www.wekaleamstudios.co.uk/ Some Hints for the R Beginner: Avoiding “Blank Screen Syndrome”. http://www.r-bloggers.com/some-hints-for-the-r-beginner-avoiding-blank-screen-syndrome/ StackOverflow (User Forum) www.stackoverflow.com (tag = R) Statistics with R. http://zoonek2.free.fr/UNIX/48_R/all.html The igraph Library. http://igraph.sourceforge.net/ Use R – Invited Lectures. http://user2010.org/Invited/ YouTube http://www.youtube.com/results?search_query=R+statistics
Contact Info Brock Tibert Director of Institutional Research 781-891-2715 btibert@bentley.edu @BrockTibert Matt Hendrickson Research Analyst 781-891-2595 mhendrickson@bentley.edu
Questions?

Weitere ähnliche Inhalte

Was ist angesagt? (7)

A brief history of plagiarism and how to avoid it
A brief history of plagiarism and how to avoid itA brief history of plagiarism and how to avoid it
A brief history of plagiarism and how to avoid it
 
Media work on reasearch
Media work on reasearchMedia work on reasearch
Media work on reasearch
 
Good Riddance: Academic Publishers are Abandoning Publishing
Good Riddance: Academic Publishers are Abandoning PublishingGood Riddance: Academic Publishers are Abandoning Publishing
Good Riddance: Academic Publishers are Abandoning Publishing
 
What is twitter a social network or news media?
What is twitter a social network or news media?What is twitter a social network or news media?
What is twitter a social network or news media?
 
Challenges in-archiving-twitter
Challenges in-archiving-twitterChallenges in-archiving-twitter
Challenges in-archiving-twitter
 
Bracic_CV_10_2015
Bracic_CV_10_2015Bracic_CV_10_2015
Bracic_CV_10_2015
 
Using DBpedia for Spotting and Disambiguating Entities
Using DBpedia for Spotting and Disambiguating EntitiesUsing DBpedia for Spotting and Disambiguating Entities
Using DBpedia for Spotting and Disambiguating Entities
 

Ähnlich wie Social Network Analysis and Interstate Mobility

Classifying Twitter Content
Classifying Twitter ContentClassifying Twitter Content
Classifying Twitter Content
Stephen Dann
 
Do you ever use facebook
Do you ever use facebookDo you ever use facebook
Do you ever use facebook
hgfhjjff
 
Sci 2011 big_data(30_may13)2nd revised _ loet
Sci 2011 big_data(30_may13)2nd revised _ loetSci 2011 big_data(30_may13)2nd revised _ loet
Sci 2011 big_data(30_may13)2nd revised _ loet
Han Woo PARK
 

Ähnlich wie Social Network Analysis and Interstate Mobility (20)

Classifying Twitter Content
Classifying Twitter ContentClassifying Twitter Content
Classifying Twitter Content
 
Do you ever use facebook
Do you ever use facebookDo you ever use facebook
Do you ever use facebook
 
2010 Catalyst Conference - Trends in Social Network Analysis
2010 Catalyst Conference - Trends in Social Network Analysis2010 Catalyst Conference - Trends in Social Network Analysis
2010 Catalyst Conference - Trends in Social Network Analysis
 
Knowledge Acquisition from Social Awareness Streams
Knowledge Acquisition from Social Awareness StreamsKnowledge Acquisition from Social Awareness Streams
Knowledge Acquisition from Social Awareness Streams
 
Using Social Media to Leverage Triple Helix Insights in Innovation Ecosystems
Using Social Media to Leverage Triple Helix Insights in Innovation EcosystemsUsing Social Media to Leverage Triple Helix Insights in Innovation Ecosystems
Using Social Media to Leverage Triple Helix Insights in Innovation Ecosystems
 
OSNs2.pptx
OSNs2.pptxOSNs2.pptx
OSNs2.pptx
 
OSNs.pptx
OSNs.pptxOSNs.pptx
OSNs.pptx
 
OSNs.pptx
OSNs.pptxOSNs.pptx
OSNs.pptx
 
Relevance Clues: Developing an Experimental Design to Examine the Criteria Be...
Relevance Clues: Developing an Experimental Design to Examine the Criteria Be...Relevance Clues: Developing an Experimental Design to Examine the Criteria Be...
Relevance Clues: Developing an Experimental Design to Examine the Criteria Be...
 
New Forms Of Communication: Harnessing Collective Knowledge through Web Logs
New Forms Of Communication: Harnessing Collective Knowledge through Web LogsNew Forms Of Communication: Harnessing Collective Knowledge through Web Logs
New Forms Of Communication: Harnessing Collective Knowledge through Web Logs
 
New Forms Of Communication: Harnessing Collective Knowledge through Web Logs
New Forms Of Communication: Harnessing Collective Knowledge through Web LogsNew Forms Of Communication: Harnessing Collective Knowledge through Web Logs
New Forms Of Communication: Harnessing Collective Knowledge through Web Logs
 
Jasist11
Jasist11Jasist11
Jasist11
 
ACE NETC 2009: Potential of Web 2.0 Technology to Foster Collaborative Intern...
ACE NETC 2009: Potential of Web 2.0 Technology to Foster Collaborative Intern...ACE NETC 2009: Potential of Web 2.0 Technology to Foster Collaborative Intern...
ACE NETC 2009: Potential of Web 2.0 Technology to Foster Collaborative Intern...
 
Sci 2011 big_data(30_may13)2nd revised _ loet
Sci 2011 big_data(30_may13)2nd revised _ loetSci 2011 big_data(30_may13)2nd revised _ loet
Sci 2011 big_data(30_may13)2nd revised _ loet
 
e-Research: A Social Informatics Perspective
e-Research: A Social Informatics Perspectivee-Research: A Social Informatics Perspective
e-Research: A Social Informatics Perspective
 
CSE509 Lecture 5
CSE509 Lecture 5CSE509 Lecture 5
CSE509 Lecture 5
 
DMI Summer 2010 - Final Presentations
DMI Summer 2010 - Final PresentationsDMI Summer 2010 - Final Presentations
DMI Summer 2010 - Final Presentations
 
Social media for sustainable engineering communication
Social media for sustainable engineering communicationSocial media for sustainable engineering communication
Social media for sustainable engineering communication
 
Citizen Sensing: Opportunities and Challenges in Mining Social Signals and Pe...
Citizen Sensing: Opportunities and Challenges in Mining Social Signals and Pe...Citizen Sensing: Opportunities and Challenges in Mining Social Signals and Pe...
Citizen Sensing: Opportunities and Challenges in Mining Social Signals and Pe...
 
Molinari krems
Molinari kremsMolinari krems
Molinari krems
 

Mehr von Matthew Hendrickson

AIR 2013 - Data Geek to Storyteller
AIR 2013 - Data Geek to StorytellerAIR 2013 - Data Geek to Storyteller
AIR 2013 - Data Geek to Storyteller
Matthew Hendrickson
 
Understanding the U.S. News &amp; World Report “Best Colleges” 2007 - Handout
Understanding the U.S. News &amp; World Report “Best Colleges” 2007 - HandoutUnderstanding the U.S. News &amp; World Report “Best Colleges” 2007 - Handout
Understanding the U.S. News &amp; World Report “Best Colleges” 2007 - Handout
Matthew Hendrickson
 
Understanding the U.S. News &amp; World Report “Best Colleges” 2007
Understanding the U.S. News &amp; World Report “Best Colleges” 2007Understanding the U.S. News &amp; World Report “Best Colleges” 2007
Understanding the U.S. News &amp; World Report “Best Colleges” 2007
Matthew Hendrickson
 

Mehr von Matthew Hendrickson (12)

MidAIR 2013 Keynote - Lighting the Path to Action: Realizing the Power of Sto...
MidAIR 2013 Keynote - Lighting the Path to Action: Realizing the Power of Sto...MidAIR 2013 Keynote - Lighting the Path to Action: Realizing the Power of Sto...
MidAIR 2013 Keynote - Lighting the Path to Action: Realizing the Power of Sto...
 
UPCEA New England 2013 - Non-Traditional Student Retention Model Creation
UPCEA New England 2013 - Non-Traditional Student Retention Model CreationUPCEA New England 2013 - Non-Traditional Student Retention Model Creation
UPCEA New England 2013 - Non-Traditional Student Retention Model Creation
 
AIR 2013 - Data Geek to Storyteller
AIR 2013 - Data Geek to StorytellerAIR 2013 - Data Geek to Storyteller
AIR 2013 - Data Geek to Storyteller
 
AIR 2012 Enrollment & Retention 06.05.2012
AIR 2012 Enrollment & Retention 06.05.2012AIR 2012 Enrollment & Retention 06.05.2012
AIR 2012 Enrollment & Retention 06.05.2012
 
The Student Ratings Debate Continued: What Has Changed?
The Student Ratings Debate Continued: What Has Changed?The Student Ratings Debate Continued: What Has Changed?
The Student Ratings Debate Continued: What Has Changed?
 
The Student Ratings Debate: Are They Valid? How Can We Best Use Them?
The Student Ratings Debate: Are They Valid? How Can We Best Use Them?The Student Ratings Debate: Are They Valid? How Can We Best Use Them?
The Student Ratings Debate: Are They Valid? How Can We Best Use Them?
 
Conflict and Negotiation: How to get from a Problem to a Solution.
Conflict and Negotiation: How to get from a Problem to a Solution.Conflict and Negotiation: How to get from a Problem to a Solution.
Conflict and Negotiation: How to get from a Problem to a Solution.
 
Attitude Measurement
Attitude MeasurementAttitude Measurement
Attitude Measurement
 
Planning
PlanningPlanning
Planning
 
Power, Management, and Conflict Resolution
Power, Management, and Conflict ResolutionPower, Management, and Conflict Resolution
Power, Management, and Conflict Resolution
 
Understanding the U.S. News &amp; World Report “Best Colleges” 2007 - Handout
Understanding the U.S. News &amp; World Report “Best Colleges” 2007 - HandoutUnderstanding the U.S. News &amp; World Report “Best Colleges” 2007 - Handout
Understanding the U.S. News &amp; World Report “Best Colleges” 2007 - Handout
 
Understanding the U.S. News &amp; World Report “Best Colleges” 2007
Understanding the U.S. News &amp; World Report “Best Colleges” 2007Understanding the U.S. News &amp; World Report “Best Colleges” 2007
Understanding the U.S. News &amp; World Report “Best Colleges” 2007
 

Social Network Analysis and Interstate Mobility

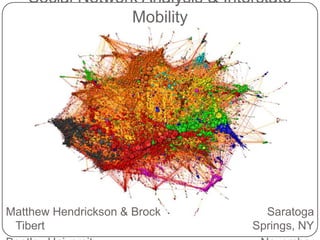
  • 1. Social Network Analysis & Interstate Mobility Matthew Hendrickson & Brock Tibert Bentley University Saratoga Springs, NY November 16, 2010
  • 2. Probably what you are thinking of...
  • 4. You’ve heard of the 6 degrees of Separation (or Kevin Bacon)...
  • 5. One study says it’s more like 5 http://www.sysomos.com/insidetwitter/sixdegrees/
  • 6. Underlying Structure of Networks http://www.consultmark.ie/blog/wp-content/uploads/2009/11/basic-social-network.jpg http://en.wikipedia.org/wiki/Social_network
  • 7. SNA – The Basics (Scott, 2000) A B C
  • 9. Real World Applications Numerous studies Migration Friend Recommendations Marketing Military Disease Control Etc.
  • 10. Search Trends – Statistics Packages http://www.r4stats.com/popularity
  • 11. R has gained ground.... http://www.r4stats.com/popularity
  • 12. Increasing Popularity of R http://www.r4stats.com/popularity
  • 14. The reason we are here..... Data: IPEDS 2008 Fall Enrollment Survey – Migration Institutional Characteristics - Directory Information Procedure Public/Private not-for-profit (4-year) Degree Granting Continental 48 states + DC Pset4flg = 1 Removed Students who enrolled in home state Military schools
  • 15. Most likely used to this http://www.postsecondary.org
  • 16. Same Chart using Our Dataset
  • 18. Spider Network Graph with Map Overlay
  • 19. Let’s highlight data of interest 300+ < 300
  • 20. First Plot – Circle Layout You will see an image if you stare long enough...
  • 21. Another Way to Visualize the Network
  • 22. Can Highlight States of Interest
  • 23. Histogram of Enrollment Volume Mean 148 Median 28
  • 24.
  • 26.
  • 27.
  • 28. References and Links Andre, M., Ijaz, K., Tilinghas, J.D., Krebs, V.E., Diem, L.A., Metchock, B., Crisp, T., & McElroy, P.D. (2006). Transmission Network Analysis to Complement Routing Tuberculosis Contact Investigations. American Journal of Public Health, 96. Cahill, Mark. (November 2009). Basics of Network Theory for Social Network Analysis (SNA) Part 1. Retrieved November 11, 2010, http://www.consultmark.ie/blog/wp-content/uploads/2009/11/basic-social-network.jpg Cheng, A. (April 2010). In Six Degrees of Separation, Twitter Style. Retrieved November 11, 2010, http://www.sysomos.com/insidetwitter/sixdegrees/ Doyle, S. (2007). The Role of Social Networks in Marketing. Journal of Database Marketing & Customer Strategy Management, 15, 60-64. DOI: 10.1057/palgrave.dbm.3250070. Hsu, W.H., King, A.L., Paradesi, M.S.R., Pydimarri, T., & Weninger, T. (2006). Collaborative and Structural Recommendation of Friends using Weblog-based Social Network Analysis. AAAI Spring Symposia 2006 on Computational Approaches to Analysing Weblogs. Maier, G. (2005). Internal Migration between US States – A Social Network Analysis. Retrieved November 13, 2010, http://iir-hp.wu-wien.ac.at/sre-disc/sre-disc-2005_04.pdf Muenchen, R.A. (2010). In The Popularity of Data Analysis Software. Retrieved November 11, 2010, http://www.r4stats.com/popularity ntamas (User of Last.fm). (n.d.). In Reconstructing the Structure of the World-Wide Music Scene with Last.fm. Retrieved November 11, 2010, http://sixdegrees.hu/last.fm/index.html Postsecondary.org (April 2010). Interstate Migration of College Freshmen 1986 to 2008. Postsecondary Education Opportunity, 214. Retrieved from http://www.postsecondary.org/last12/214_410pg1_16.pdf Scott, J.P. (2000). Social Network Analysis: A Handbook 2nd Edition. London: Sage Publications. Social Network. (n.d.). In Wikipedia. Retrieved November 11, 2010, http://en.wikipedia.org/wiki/Social_network VosFellman, P. & Wright, R. (2003). Modeling Terrorist Networks – Complex Systems at the Mid-Range. Retrieved November 13, 2010, http://www.psych.lse.ac.uk/complexity/Conference/FellmanWright.pdf
  • 29. Resources Drew Conway ZIA http://drewconway.com/zia/ Quick-R www.statmethods.net R4Stats. http://www.r4stats.com/popularity R for SAS and SPSS Users. http://oit.utk.edu/scc/RforSAS&SPSSusers.pdf R Links for the Beginner on World Statistics Day. http://www.r-bloggers.com/r-links-for-the-beginner-on-world-statistics-day/ R Project for Statistical Computing. http://www.r-project.org/ Simple R – Using R for Introductory Statistics. http://cran.r-project.org/doc/contrib/Verzani-SimpleR.pdf Social Network Analysis Resources for R. http://jeromyanglim.blogspot.com/2009/08/social-network-analysis-resources-for-r.html Software for Exploratory Data Analysis and Statistical Modeling. http://www.wekaleamstudios.co.uk/ Some Hints for the R Beginner: Avoiding “Blank Screen Syndrome”. http://www.r-bloggers.com/some-hints-for-the-r-beginner-avoiding-blank-screen-syndrome/ StackOverflow (User Forum) www.stackoverflow.com (tag = R) Statistics with R. http://zoonek2.free.fr/UNIX/48_R/all.html The igraph Library. http://igraph.sourceforge.net/ Use R – Invited Lectures. http://user2010.org/Invited/ YouTube http://www.youtube.com/results?search_query=R+statistics
  • 30. Contact Info Brock Tibert Director of Institutional Research 781-891-2715 btibert@bentley.edu @BrockTibert Matt Hendrickson Research Analyst 781-891-2595 mhendrickson@bentley.edu

Hinweis der Redaktion

  1. http://sixdegrees.hu/last.fm/download.html
  2. Most people think of these or similar concepts when considering social networks.They are built upon social networks, but are not social networks in an of themselves.
  3. Have you ever noticed sections of webpages like this one from twitter?They are formulated to suggest friends based on popularity, self-selected interests, and similarity to the user.This is where social networks come into play.
  4. Six Degrees of Separation (aka The Human Web) posits that everyone is on average approximately six steps away form any other person on Earth. This was firstpoularized by FrigyesKarinthy in 1929. It was further popularized by Stanley Milgram as the “Small World” phenomenon. Source: wikipedia.org.
  5. http://www.sysomos.com/insidetwitter/sixdegrees/Recent work by sysomos by way of Twitter suggests otherwise. 79% are within 5 degrees of separation.
  6. How many of you have seen graphs like these? This is SNA. You will see a few more applied to our research in the following slides.
  7. Scott, 2000 – Page 67.Here are a few basic terms.1. Here are the Nodes: The point of the graph representing the observation.2. Here are the Edges/Lines: The line representing the relationship between nodes.Corresponds to the idea of an area of relatively high density in a graph.
  8. Scott, 2000 – Page 67.This is the same SNA graph from the previous page. To the right is its sociomatrix.All social networks are built upon a sociomatrix. The graph is simply a representation of the matrix.This matrix is used for not only social network representation, but also for calculations pertaining to the relational data.MatrixA framework in which raw or coded data can be organized in a more or less efficient way. This is always done in the form of a table. The axes are based on any combination of cases and affiliations (Scott, 2000).
  9. Studies are provided as a way to illustrate the growing use of SNA in multiple disciplines across the globe.Migration – Maier (2005)Friend Recommendations - Hsu, W.H., King, A.L., Paradesi, M.S.R., Pydimarri, T., &amp; Weninger, T. (2006)Marketing – Doyle (2007)Military – VosFellman &amp; Wright (2003)Disease Control - Andre, Ijaz, Tilinghas, Krebs, Diem, Metchock, Crisp, &amp; McElroy (2006)
  10. r4stats provides a link to run an updated graph.This one was run on November 11, 2010.Note:The numbers on the graph reflect how many searches have been done for a particular term, relative to the total number of searches done on Google over time. They don&apos;t represent absolute search volume numbers, because the data is normalized and presented on a scale from 0-100. Each point on the graph is divided by the highest point, or 100. When we don&apos;t have enough data, 0 is shown. The numbers next to the search terms above the graph are summaries, or totals.
  11. This graph shows plainly that R is becoming a widely used resource if considering monthly e-mail discussion lists.Could the numbers in Figure 1 be the result of a few people doing a lot of talking? When you follow any of these discussion lists, it quickly becomes obvious that a core group of people really keep the lists humming. However the number of people who subscribe to each list shows a similar pattern with R-Help dominating the scene, see Table 1. An early version of this table failed to include subscribers to Statalist&apos;s digest version, and so under counted the total by about half.Discussion: Subscribers:R-Help 10,379Statalist 3,692SAS-L 3,253SPSSX-L 2,105Table 1. Number of subscribers for each Internet discussion list on 6/20/2010.
  12. Not only has SNA popularity been on the rise, but so has the popularity of R.Also consider this, since the number of packages in R continue to increase, the possibility that whatever you will need will be available.For instance, once you get past the R learning curve, you can learn and implement many projects that are either not available through SPSS or SAS, but that you may not have a license to use. Just think of a project that you have to do where you only need to use a statistical process once, not providing use enough to purchase the separate software package.
  13. http://nces.ed.gov/ipeds/datacenter/Student Migration/Interstate MobilityThe movement of students who enroll at institutions of higher education outside of their home state (postsecondary.org).1st Time Degree Seeking UG graduating HS in last 12 months (efres02)
  14. http://www.postsecondary.org/last12/214_410pg1_16.pdfText not copyrighted. Permission is granted to make copies from this research letter providing copies are not sold and the source is identified. Copies of research letter charts are available to subscribers in larger sizes at cost. Call for assistance.1:5 leave home state
  15. Order is fairly similar to the Postsecondary study
  16. NJ -&gt; PA = 9300+ studentsMean = 148, median is 28, 2200 plus rows in the datasetCut at 100 is approximately top 25% of the dataset
  17. Main Plot - FR Layout53% of freshmen enroll 100 miles or less
  18. Online sources – simply search for SNA online. Or give us your card/contact info and we can send you a few that we use.