Kearney levine-trends-nov2013-new nber

This document summarizes a study investigating trends in the U.S. teen birth rate between 1981 and 2010. The key points are: 1) The teen birth rate declined significantly from 1991 to 2010, falling 49% overall and 57% for black teens specifically. 2) The study finds that demographic changes like increases in the Hispanic teen population cannot explain the decline, and that economic factors like unemployment rates accounted for 28% of the post-2007 decline. 3) Targeted policies like changes to welfare benefits and expanded access to family planning had small but statistically significant impacts, together explaining 12% of the overall decline from 1991-2010. The study found little evidence that other policies influenced teen birth rates.

Empfohlen
Weitere ähnliche Inhalte
Was ist angesagt?
Was ist angesagt? (20)
Andere mochten auch
Andere mochten auch (16)
Ähnlich wie Kearney levine-trends-nov2013-new nber
Ähnlich wie Kearney levine-trends-nov2013-new nber (20)
Mehr von haramaya university
Mehr von haramaya university (20)
Kearney levine-trends-nov2013-new nber
- 1. 1 Investigating Recent Trends in the U.S. Teen Birth Rate Melissa S. Kearney University of Maryland and NBER Phillip B. Levine Wellesley College and NBER November 2013 ABSTRACT We investigate trends in the U.S. rate of teen childbearing between 1981 and 2010, giving particular attention to the sizable decline that has occurred since 1991. Our primary focus is on establishing the role of state-level demographic changes, economic conditions, and targeted policies in driving recent aggregate trends. We offer three main observations. First, the recent decline cannot be explained by the changing racial and ethnic composition of teens; in fact, all else equal, a rising share of Hispanic teens would have led to an increase in teen childbearing. A temporary increase in the share of teens aged 18-19 can account for nearly half of the transitory increase in teen childbearing around 1991. Second, the only targeted policies that have had a statistically discernible impact on teen birth rates are declining welfare benefits and expanded access to family planning services through Medicaid. However, the combined effect of these two policies is estimated to account for only 12 percent of the observed decline in teen childbearing from 1991-2010. Third, weak labor market conditions, as measured by the unemployment rate, do appear to lead to lower teen birth rates and can account for 28 percent of the decline in teen birth rates since the Great Recession began. Acknowledgements: The authors thank Kelleen Kaye for helpful comments and Lisa Dettling for very capable research assistance. Any views expressed are those of the authors alone. We acknowledge financial support from the National Campaign to Prevent Teen and Unplanned pregnancy.
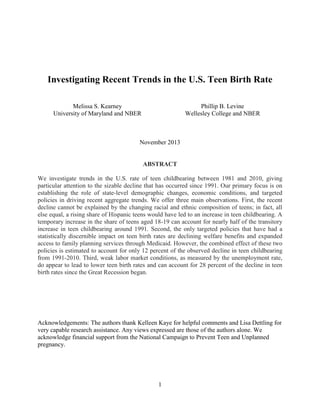
- 2. 2 I. INTRODUCTION Over the past two decades, the teen birth rate in the United States has exhibited a stunning decline. It peaked at 61.8 in 1991, before falling 49 percent, reaching a low of 31.3 in 2011. Over one-third of that decline took place in just the last four years of that period. The longer term decline for black, Non-Hispanic teens has been even more dramatic, falling from a rate of 118.9 in 1991 to 51.5 in 2010, a 57 percent decline. These trends can be seen in Figure 1, which plots the number of births to women between the ages of 15 and 19.1 Understanding the factors that have contributed to these aggregate trends is an important question for economic demography; it is critical in developing a better sense of what drives rates of teen childbearing. This paper empirically investigates the role of state-level demographic changes, economic conditions, and targeted policies in driving aggregate teen birth rate trends over the past few decades. It is crucial to understand the factors that lead teens to alter their decisions and behaviors in order to inform policy discussions about how to alter teen childbearing outcomes. Policy observers offer many potential explanations for the recent decline, with advocates across the political and policy spectrum making competing claims. Some analysts have cited the Great Recession as a potential cause of the decline in the last few years.2 Others reference the success of newer types of sex education programs,3 abstinence only education programs,4 and improved 1 Aggregate teen birth rates are obtained from the National Center for Health Statistics. Estimates by race and ethnicity are provided in bound volumes of Vital Statistics of the United States: Volume I, Natality, for years up through 1993. After that, they are available electronically from annual reports, Report (or Advance Report) of Final Natality Statistics, for 1994 through 1996 and from Births: Final Data beginning ever since 1997. Race and ethnicity are not separately identified in birth data prior to 1989. 2 Carl Haub of the Population Reference Bureau told CBS News: “I don’t think there’s any doubt now that it was the recession. It could not be anything else” (Jaslow, 2011) 3 Leslie Kantor, Vice President of Education for the Planned Parenthood Federation of America takes this view, stating: "Whether it's in the public school system or community-based venues, we've really learned over the last 20 years what kinds of programs help young people to really change their behavior." (Tulumello, 2011) 4 Valerie Huber, executive director of the National Abstinence Education Association in Washington, states "The one thing we know for certain is more teens are waiting to have sex, which tells us ‘abstinence only’ is a message that's resonating with them" (Tulumello, 2011).
- 3. 3 access to contraception.5 While casual observers and advocates are content to make such claims, to date there is a lack of rigorous research verifying the empirical importance of these factors in explaining changes in teen birth rates. Our investigation of the role of state-level factors in driving aggregate trends is built conceptually on the recognition that environmental and policy factors shape individual’s decisions and behaviors. This conceptualization is ubiquitous in the economics of fertility literature, which models fertility decisions within a cost/benefit framework of a utility maximizing individual. This focus stands in contrast to the focus on “mechanical” or “proximate” drivers of teen birth rates among many who work in public and reproductive health circles. We present descriptive information about trends in sexual activity and contraceptive use over the relevant period, which leads to the observation that teenagers have achieved lower birth rates through a combination of less sex and more contraceptive, and not through increased reliance on abortion. But, we emphasize that these facts inform us only about the mechanisms through which teens achieved lower birth rates, and by themselves do not speak to the relevance of various policies. Our paper leads to the following conclusions. First, the observed decline in teen childbearing over the past twenty years is even more surprising given the demographic changes that have taken place. A growing share of Hispanic teenagers – who have higher rates of teen childbearing – would, all else equal, have led to a substantial rise in the aggregate rate of teen childbearing. Second, we find little evidence that targeted policies played much of a role in the decline. Declining welfare benefits and expanded access to family planning services through the Medicaid program each had a statistically discernible, albeit small, effect. Our analysis yields no 5 Kathryn Kost of the Guttmacher Institute states: “The recent declines in teen pregnancy rates are great news … It is time to redouble our efforts to ensure that all teens have access to the information and contraceptive services they need to prevent unwanted pregnancies” (Guttmacher Institute press release, 2/8/2012, available at: http://www.guttmacher.org/media/nr/2012/02/08/index.html, accessed 3/14/2012.
- 4. 4 evidence suggesting that other policies, including abstinence only education or mandatory sex education, had any role in driving aggregate teen birth rates over this period. Third, our results indicate that the dramatic rise in the level of unemployment since 2007 can explain a sizeable portion of the lower teen birth rates lately. This impact, however, should be viewed as transitory since labor market conditions will ultimately rebound, making this factor unlikely to contribute to long term reductions in teen childbearing. II. BACKGROUND: TRENDS IN TEENAGE SEXUAL ACTIVITY AND CONTRACEPTIVE USE It is a matter of biology that a fall in the teen birth rate has to be mechanically driven by a decline in sexual activity, greater contraceptive use, or an increase in the use of abortion (assuming that miscarriages are reasonably fixed in their likelihood). For descriptive purposes, it is useful to know the role that each of these factors played in the historical trend experienced in the United States over the past several years. It is critical to note, however, that an exercise along these lines does not inform us directly about whether particular policies are effective at leading teens to change their behaviors. To know that teenagers used contraception at higher rates, for example, does not tell us anything about whether policies that promote contraception are effective. Teenagers might have made different choices with regard to contraception for reasons having nothing to do with particular policies around contraception at that time. 6 The data rule out abortion as a contending explanation for the decline in teen childbearing rates. Historical statistics reported by Kost and Henshaw (2012) on pregnancies, abortions, and births indicate that abortions among teens have dropped considerably, largely because 6 Yet previous authors have made such claims. Boonstra (2002, p. 8) provides an example: “If recent declines in teen childbearing are the result of fewer teens getting pregnant in the first place, the obvious next question is: why? Are fewer teens avoiding pregnancy by abstaining from sex, or are those who are having sex using contraception more successfully? Not surprisingly, the answer is: both. But deconstructing that answer is critical, because it goes to the heart of a number of relevant and timely public policy questions, among them the debate over public funding for abstinence-only education and for more-comprehensive approaches.” Santelli et al. (2007) express similar views.
- 5. 5 pregnancies have fallen. In 2008 (the most recent year for which abortion data are available), 26 percent of teen pregnancies were aborted, down from 32 percent in 1991. We plot historical trends in sexual activity and contraceptive use among teens using two sources of data: the National Survey of Family Growth (NSFG) and data from the Youth Risk Behavior (YRBS) system. The NSFG includes data on all women between the ages of 15 and 44, but we restrict our attention to those who are unmarried and between 15 and 19. The YRBS focuses on those still enrolled in high school and who are mostly between the ages of 14 and 18. First, as seen in Figure 2, both sources of data indicate that teenage girls were less likely to report sexual activity in the three months preceding the survey over the past two decades.7 In the YRBS, the rate of sexual activity fell from 40.4 percent in 1995 to 34.2 percent in 2011. In the NSFG, it fell from 37.9 percent in 1995 to 30.6 percent in the 2006 through 2010 period.8 Second, the data also show an increase in the likelihood of contraceptive use among “sexually active women” (i.e. those who engaged in sexual activity in the past three months). In the NSFG, the percentage using some form of contraception at last intercourse among sexually active women rose from 79.9 percent in 1988 to 85.6 percent in 2006-2010 (Abma and Sonenstein, 2002; and Martinez, et al., 2011).9 In the YRBS, the data show an increase from 81.9 percent in 1991 to 84.9 percent in 2011. These data suggest that reductions in teen childbearing over the past two decades reflects both a decrease in the rate of sexual activity and an increase in the use of contraception. 7 Sources for these data are Abma and Sonenstein (2001) and Martinez, et al. (2011) for the NSFG and Youth Online: High School YRBS, available at http://apps.nccd.cdc.gov/youthonline/App/Default.aspx, and accessed on 10/29/2012. 8 In 2006, the NSFG switched from including larger samples being surveyed once every several years to smaller samples being surveyed annually. Using the more recent approach, data across years are aggregated to generate larger sample sizes. 9 The NSFG value for 1995 is 70.7 percent, which appears to us to represent an unrealistically large change between this and the values in 1988 and 2002 of 79.9 and 83.2 and inconsistent with the trends in the YRBS. Because of our uncertainty in interpreting the 1995 value, we have chosen to rely on the 1988 estimate (which seems more plausible in historical context and in reference to YRBS estimates) as a starting point for our comparisons over time.
- 6. 6 Another potential contributing factor is that contracepting teenagers switched to more effective methods of contraception. Newer methods including Depo Provera and emergency contraception (“Plan B”) have become available over this period. Indeed, some advocates point to the introduction of newer, more reliable methods as one reason for the falling teen birth rate (cf. Guttmacher 2011). Table 1 presents detailed data from the NSFG on contraceptive methods used among sexually experienced teen women. The top panel of the table presents the methods that teens have ever used. Almost all of them report having used some method at some point; indeed 96 percent report having used condoms. Pill use is the next most common form, with 56 percent of teens reporting having used the pill. A roughly comparable share report having used the withdrawal method. Newer methods – including the contraceptive patch, contraceptive ring, and emergency contraception (EC) – appear to be gaining some users. In 2002, 8 percent of teens report use of EC and 1.5 percent report having used the contraceptive path; these numbers are up to 14 percent and 10 percent by the latest round of data. These are still relatively small shares of this population, as compared to pill and condom use.10 To investigate whether there were substantial rates of switching to more reliable forms of contraception in the aggregate, it is useful to focus on the choice of method used at last intercourse among those who are sexually active (intercourse in the past three months), which is displayed in the bottom panel of the table. This is a more reliable indicator of “usual” form of contraception. By this measure, condoms are still the most popular form of “usual” contraception, and increasingly so. In 2006-10, 52 percent of sexually active respondents report using the condom at last intercourse, as compared to 38 percent in 1995. Pill use rose from 25 10 Existing studies suggest that the introduction of and expanded access to emergency contraception (EC) has generally not led to discernible changes in pregnancy, abortion, or birth outcomes. Girma and Paton (2011, 2006), report such findings in the context of England. Durrance (2012) examines county-level data from Washington State and finds that access to EC is associated with increased rates of STD but no change in abortion or birth rates. Raymond et al. (2007) review 23 studies of emergency contraception access and conclude that the evidence points against there being an effect of EC on pregnancy or abortion rates.
- 7. 7 percent in 1995 to 34 percent in 2002 before falling back to 31 percent in 2006-2010. That fall in pill use in the most recent period was completely compensated by the use of other hormonal methods, which rose from 9 to 12 percent. Our interpretation of these data is that older, highly effective methods of contraception (the pill) were being substituted for new, very highly effective methods of contraception (i.e. Depo Provera) over the past decade. Between 1995 and 2002, however, the increased use of condoms and the pill is commensurate with the increase in the share using any method (as opposed to dual methods), suggesting this is more likely to represent new users. This period also witnessed a large advance in the share reporting dual methods: from 8.4 percent in 1995, up to roughly 20 percent in the latter two surveys. The impact of dual use depends on what women would have used otherwise. Obviously the largest impact would have been realized if these women otherwise would have used no method of contraception, a moderately effective method, such as the condom, versus a highly effective method such as the pill. In previous work we conducted a regression analysis to mechanically decompose the reduction in teen childbearing over this period into changes in rates of sexual activity and changes in contraceptive use (Kearney and Levine, 2012). We constructed a pooled cross- section, time-series dataset, link state data on teen birth rates over time to YRBS data sexual activity and contraceptive practices. That analysis yielded the conclusion that both reduced rates of sexual activity and increased use of contraception make substantive contributions to falling teen birth rates.11 This leads us to underlying question of why those behaviors changed. 11 Santelli, Lindberg, Finer, and Singh (2007) use a simulation approach -- incorporating assumptions about rates of sexual activity and contraceptive use along with their associated probabilities in terms of pregnancy and birth outcomes -- to investigate this same question. They come to roughly the same conclusion.
- 8. 8 III. DEMOGRAPHIC COMPOSITION AND THE TEEN BIRTH RATE In this section we consider the role of (a) demographic composition changes and (b) differential rates of change across demographic subgroups. If behavior remained constant for individuals in different demographic groups, but the relative size of those groups changed over time, that could affect aggregate level outcomes. On the other hand, if all groups remained in constant proportion but one group experienced a particularly large decrease in birth rates that would have an effect on aggregate level outcomes. We consider two features of the composition of the female teen population: the racial/ethnic composition and the specific age distribution of the teen population. The share of the teenage population that falls into a minority racial/ethnic category has increased steadily between 1980 and 2010. Figure 3 shows the upward trends in the share of the female teen population that is Hispanic and the share that is “other race” and non-Hispanic (this group includes American Indian or Alaska Native, Asian, or Native Hawaiian or Pacific Islander – Asian is the subgroup that is driving this increase). Using statistics from the U.S. Census Bureau, we calculate that the percentage of women between the ages of 15 and 19 who are white, non-Hispanic decreased from 76 percent in 1980 to 56 percent in 2010. This trend is largely attributable to a growing Hispanic population: the percentage of the female teen population that is Hispanic rose from 8 percent to 20 percent over this period. An increasing share of other race, non-Hispanic women (again, mostly Asian) from 2 percent to 8 percent explains most of the remainder of the drop among white, non-Hispanic teen women. The relative size of the black population has not appreciably changed over this period. Based on the rise in the Hispanic share of the teenage population, all else held constant, the counterfactual trend in teen childbearing would have been a rising birth rate. The Hispanic teen birth rate has been consistently around 2.5 to 3 times the rate of the white, non-Hispanic birth rate. The black, non-Hispanic teen birth rate is 2.2 to 2.7 times the white, non-Hispanic
- 9. 9 birth rate over this time period, but since the black share of the teen population has not changed that much, this difference is not instrumental to explaining trends. Another important component of demographic change is the precise age distribution of the female teen population. Birth rates to women between ages 15 and 17 are one-third the level of that for women who are 18 or 19 years old (Martin, et al. 2011). As broader population trends move through the teenage years, this could have a sizeable impact on the overall teen birth rate. In particular, Figure 3 shows a blip in the share of teens age 18-19 around 1990.12 This pattern may be relevant to explaining at least some of the increase in teen childbearing that took place around 1990. We conduct a straight-forward econometric analysis relating state/year level variation in teen birth rates, measured in natural logs, to the demographic shares of the teenage population. This exercise is not meant to be an exhaustive exploration of factors affecting teen birth rates. This is simply intended to provide an econometric exploration of the relationship between the demographic trends seen in Figure 3 to the overall birth rate trend seen in Figure 1. We estimate a regression model on pooled cross-section, time series data of teen birth rates using standard panel data methods. The dependent variable is the teen birth rate, measured as a natural log, in a particular state and year. The independent variables represent shares of the teen population that are: (1) age 18-19, (2) black, non-Hispanic, (3) other race, non-Hispanic, and (4) Hispanic. We also include state and year fixed effects to capture long-term, fixed differences in outcomes across states as well as national trends in outcomes. Teen birth rates are calculated from Vital Statistics natality files (the numerator) and intercensal population estimates of women age 15-19 (the denominator) were obtained from the 12 Abortion legalization in the early 1970s is an important contributor to this pattern (Levine, et al., 1999). Birth rates in the mid to late 1960s were reasonably flat, but then fell considerably during the early 1970s as abortion was legalized throughout the United States. As birth rates fell starting around 1971, the fraction of 15 year olds in the 15- 19 age group would begin to decline around 1986. By 1988, the fraction of teens who were 15-17 year olds would be relatively low. This “disequilibrium” would continue until birth rates stopped falling, which took place by, say, 1975. These earlier demographic trends would explain the age pattern in Figure 3.
- 10. 10 U.S. Census Bureau.13 These Census data are also used to construct the explanatory variables. The equation is estimated using 30 years of data, from 1981 to 2010 inclusive. The regression is weighted by the size of the female population age 15-19 in each state. Reported standard errors are adjusted for clustering at the state level. Table 2 reports the results of this exercise. A one percentage point rise in the share of the teenage population age 18-19 leads to a statistically significant 1.61 percent increase in the teen birth rate. The results in Table 1 indicate that a one percentage point increase in the share of the female teen population that is Hispanic results in a 1.72 percent increase in the teen birth rate. We combine these estimated coefficients with data on what actually happened to population shares over this period to get an estimate of what would have happened to the teen birth rates based only on changing demographics. This is a standard method of decomposition in economic analyses (see, for example, Sullivan and Rosenbaum, 2001). The percentage of teens age 18 or 19 who are 18 or 19 dropped from 42 percent to 40 percent between 1984 and 1986. It then rose to 44 percent in 1989 and 1990 before returning to steady state around 40 by 1993. The estimated relationship implies that the 4 point increase in this percentage leading up to 1990 would be associated with a 6.4 percent increase (4*.016) in teen birth rates. With a baseline teen birth rate of around 52 leading up to this period, a predicted 6.4 percent increase around 1990 would lead to a 3.3 unit increase in the teen birth rate. The actual level rose by around 10 units, meaning that this one component of demographic change can explain about one-third of the spike in teen birth rates around 1990. It can also explain virtually the entire drop in the teen birth rate of 61.8 to 58.2 between 1991 through 1994. To the best of our knowledge, this is the only factor that has been identified which can explain any portion of this spike. We view this is a very useful new insight to come out of this simple analysis of demographic factors. 13 These data are available at http://www.census.gov/popest/data/historical/index.html, last accessed March 14, 2012.
- 11. 11 With a rapidly growing Hispanic population over this period, the teen birth rate should have risen, not fallen. Consider the period beginning in 1994, after the impact of a changing age composition ran its course, and running through 2010, a period over which the teen birth rate fell from 58.2 to 34.3, indicating a drop of 41 percent. As dramatic as that drop is, we should have expected that rate to rise by around 12 percent over this period if nothing else changed other than the percentage of Hispanic teens, which jumped from 13 percent to 20 percent. This means that the teen birth rate actually was cut almost in half to 34.3 from a baseline rate of 65.2 (58.2*1.12) if we incorporate the higher share of Hispanic teens. In other words, the change in teen childbearing behavior that needs to be explained is even greater than that indicated by the raw numbers. We now consider another aspect of demographic composition – how teen birth rates changed for racial/ethnic subgroups. Figure 1 plots the trend in teen birth rates separately for non-Hispanic whites, non-Hispanic blacks, and Hispanics beginning in 1990, when data by Hispanic origin became available. The data show very clearly that all groups experienced the same general downward trends in teen childbearing over the past two decades. This implies that the factors which caused these movements were not specific to one racial/ethnic group in particular.14 That said, the post-1990 rate of decrease in the birthrate among black, non-Hispanic teenagers was particularly large. U.S. vital statistics data report that the non-Hispanic black teen birth rate fell from 118.9 in 1991 to 51.5 in 2010; that is a remarkable 67.4 point drop. The overall teen birth rate fell from 61.8 to 34.5 over these same years, a 27.3 point drop. As shown in Figure 3, black, non-Hispanic teens account for a roughly steady 15 percent of the population. This means that the falling teen birth rate among this group can account for a 10.1 drop 14 This does not preclude subsequent investigation into the particular experience of black, non-Hispanic teens, but that such an investigation is outside the scope of the present paper. We would encourage others to pursue this issue further in subsequent research.
- 12. 12 (67.4*.15) out of the overall 27.5 point drop, This indicates that black, non-Hispanics -- which comprise 15 percent of the population - account for 37 percent of the overall decline. To summarize the discussion in this section, we highlight four key findings. First, if nothing else changed, trends in the ethnic composition of the teenage population between 1991 and 2010 would have led to increases in teen childbearing over this period, which leaves us with an even greater decline to explain. Second, the specific age composition of the teenage population has roughly been constant over the 1981 to 2010 period, except for a bulge in the share age 18-19 around 1990. This transitory change in the age structure can explain a large share of the spike in the overall teen childbearing rate that occurred around 1990. Third, white, black, and Hispanic teens all saw their rates of teen childbearing decline substantially between 1991 and 2010. Fourth, black teens saw their rates of teen childbearing fall especially rapidly, and the decrease in the teen birth among this group can account for a disproportionate share of the decline in the overall teen birth rate. IV. THE ROLE OF PUBLIC POLICY AND LABOR MARKET CONDITIONS In this section, we econometrically investigate the role of state-level policies and economic conditions in driving state-year variation in teen birth rates. We take guidance from the existing literature in choosing our set of explanatory policies and variables, with a particular emphasis on policies directly targeted at affecting teen childbearing outcomes. We draw on the excellent review by Lopoo and Raissian (2012), which surveys the research on public policies in the United States relevant to fertility outcomes. Most, if not all, past research has focused on a single or limited number of factors that may matter. An important contribution of our analysis is an integrated approach that simultaneously considers the role of a wide array of relevant policies and economic conditions. To the extent that our findings are consistent with past research, this will enable us to draw stronger conclusions. A. Data and Methods
- 13. 13 To identify the effect of individual policies and economic conditions on teen birth rates, we exploit the variation in the timing of policy implementation and movements in economic conditions across states. This approach allows us to identify the causal relationship between a policy or economic conditions and teen birth rates provided that we have adequately controlled for other factors that might be correlated with them. We accomplish this by employing panel data methods, where the dependent variable is the natural log of the teen birth rate in a particular state and year and the explanatory variables include all of these policy indicators, economic factors, and state-level demographic characteristics, along with a vector of year fixed effects and nonlinear state-specific trends.15 All explanatory variables are lagged one year to better approximate the conditions that existed at the time of conception. We allow state-specific effects to vary nonlinearly by including up to a cubic in state- specific trends. Figure 1 provides the motivation for this specification. Over the sample period used in this analysis, national trends in teen birth rates were roughly flat through the 1980s, spiked in the early 1990s and then have been declining ever since. Year fixed effects would capture this nonlinear pattern at the national level, but presumably these patterns differed across states. A cubic is required to capture the two observed turning points.16 15 The implicit assumption of a difference-in-difference framework that exploits the variation of timing implementation of policies across states is that the precise timing of the introduction of policies at the state level is exogenous to trends in teen birth rates in that state. The inclusion of state-specific trends addresses this potential source of bias. 16 In his paper on the effect of unilateral divorce laws, Wolfers (2006) makes the point that the inclusion of non- linear trends in a difference-in-difference framework could capture some of the dynamic effects of a policy in the post-implementation period. He recommends augmenting the model with indicators for discrete periods of time post-policy, for example, an indicator for one to two years post policy, three to four years post policy, etc. He also observes that the problem is exacerbated when there are few years observed pre policy implementation. Our investigation includes a large set of policies, making it infeasible to put in a full set of post-period time indicators for each policy. Furthermore, for almost all of the binary policy variables in our analysis, we have many years of pre implementation data. And finally, unilateral divorce laws are likely to have dynamic effects on marital churn. The effects of the types of policies we consider are much less likely to be dynamic or cumulative, making it more appropriate to focus on identifying an average effect in the post-implementation years.
- 14. 14 Our analysis uses birth data from the Vital Statistics Natality files between the years of 1981 and 2010 aggregated to the state/year level.17 We combine these data with the intercensal population estimates from the U.S. Census Bureau to construct teen birth rates. We augment these birth rate data with a large set of state-year level policies and two measures of state-year economic conditions. The specific policies and economic conditions that we consider are described in the following section. A data appendix describes the sources used to construct these policy variables and an appendix table displays the years in which the relevant policies were introduced in each state. Our regression models also include control variables for the demographic composition of the state female teenage population in each year using data from the U.S. Census Bureau, as described above for the analysis reported in Table 2. These controls include the percent of the population that is white/non-Hispanic, black/non-Hispanic, percent that is Hispanic, and percent that is age 18-19. We also include broader measures of the state population that might affect general social norms and therefore have an indirect effect on teen childbearing rates. These variables are constructed from Current Population Survey Outgoing Rotation Group files. These controls includes the percent of the state population that is: age 15-19, of childbearing age (15- 44), married, and with a college degree. We estimate this model first for all teen births. We then estimate these models separately for females age 15-17, females age 18-19, nonwhite teens, Hispanic teens, unmarried teens, married teens, and for first births.18 Our motivation for doing this is twofold. First, it is informative to see if the estimated impact of policies varies across population subgroups to think 17 We restrict our sample period to this window because of the difficulty of documenting variation in some of the policies in earlier years. In models focusing on Hispanic fertility, we are restricted to using data beginning in 1990, when Vital Statistics data began separately identifying births to Hispanic women, regardless of race. In models focusing on nonwhite women, we use the full set of data going back to 1981, so Hispanic ethnicity is not separately identified. 18 The denominator in constructed birth rates by marital status and birth order is the total number of women between the ages of 15 and 19.
- 15. 15 about whether there are important differences in treatment effectiveness. Second, it is often useful to check whether the estimates vary in expected ways in order to determine whether the statistical estimates we obtain can be interpreted as causal. For example, some policies, like parental consent for abortion for instance, should only affect younger teens and unmarried teens, so if we obtain estimates that indicate an impact of these laws that are not concentrated on these groups, then it is likely that those results are spurious, not causal. B. Policies Considered We begin with policies that directly target proximate determinants. First, we consider whether a state accepts federal Title V-510 abstinence education funding. This provision was passed as part of the Personal Responsibility and Work Opportunity Reconciliation Act of 1996 (PRWORA) and expanded federal funding for programs that emphasize abstinence curricula, mentoring, counseling, and adult monitoring to promote abstinence from sexual activity outside of marriage. States that accept these funds are required to match 75 percent of the federal funding. Past research has had difficulty finding much of an impact of programs like these (cf. Trenholm, Devaney, Fortson, Clark, Quay, and Wheeler, 2008). We also include two measures of state-level policies on sexual education programs – an indicator for whether the state requires sexual education programs and an indicator for whether state law requires contraception education be included in any sexual education program. Although past research has had difficulty identifying a causal impact of sex ed in any form on teen births (cf. Sabia, 2006 and Kirby, 2007), we consider this possibility here as well.19 In terms of contraceptive access, we focus on increases in eligibility for free family planning services that took place within the context of the Medicaid program. Medicaid has 19 Kirby (2007) reports evidence that sex ed is found to be effective in reducing aspects of risky sexual behavior among teens, but that the impact is not large. This may translate into difficulty finding effects on teen childbearing itself. When we combine a small change in risky behavior with the probability of pregnancy even in the presence of risky behavior, the expected impact of these programs on childbearing would be small as well. Statistical power in these analyses then becomes an important issue, as Kirby points out. Nevertheless, the relevant conclusion is that these programs are unlikely to have a substantial effect on teen childbearing based on this evidence.
- 16. 16 traditionally provided comprehensive access to family planning services to its clients, but participation was largely restricted to mothers who received welfare. For the past two decades or so, states have had the ability to request waivers from the federal government to provide family planning coverage to a broader group of women. As of January 2012, 28 states have done so.20 The expanded services have generally applied to the following groups of women: (1) women whose pregnancy-related care, including post-partum family planning, would otherwise expire; (2) women who would lose their Medicaid eligibility status for any reason; and (3) women whose income is below a specified income threshold (typically 185 percent or 200 percent of the federal poverty threshold), but above the eligibility threshold for the state’s regular Medicaid program, regardless of whether they meet the categorical requirement of having a child or being pregnant. Some of these waivers only apply to the population of women age of 19 and over, so they would presumably have limited effectiveness for the teen population. Kearney and Levine (2009) found that these income-type expansions led to statistically significant reductions in teen childbearing, on the order of a four percent reduction. Another policy change with a family planning component is the introduction of the State Children’s Health Insurance Program (S-CHIP), now known as the Children's Health Insurance Program (CHIP). This federal program provides matching funds to states to provide health insurance coverage to families whose incomes are low, but too high to qualify for traditional Medicaid. The program was implemented during the late 1990s, with some variation across states in exact year of implementation. Adolescents have access to family planning services through the CHIP program and this could have contributed to a reduction in the teen birth rate, at least at that time. The take-up rate of this provision among adolescents, however, is observed to be quite low, perhaps in part because of the lack of confidentiality in their provision (Gold and 20 For a list of states that have instituted these policies as of 1/1/2012, see the report by the Guttmacher Institute, http://www.guttmacher.org/statecenter/spibs/spib_SMFPE.pdf, accessed 1/9/2012.
- 17. 17 Sonfield, 2001). This suggests we are unlikely to find a strong relationship between this policy and teen birth rates. Moving away from factors that are directly targeted at proximate determinants, we explore the role that changing welfare policies may have played. There is a large literature on the incentive effects of welfare benefit levels on non-marital and teen childbearing. Moffitt (1998, 2003) review the evidence on the link between welfare benefits and non-marital childbearing, including teen childbearing. His summary view is that the general consensus is that more generous welfare benefits likely have a modest positive effect on rates of non-marital childbearing. We include in our analysis a measure of welfare generosity at the state-level: the maximum AFCD/TANF benefit amount for a family of three (in year $2009, measured in natural logs). Beyond welfare generosity, a substantial literature also examines the role that welfare reform has played on women’s, and particularly teens’, childbearing decisions. Welfare reform was implemented at the national level with the passage of the 1996 PRWORA legislation; an explicit goal was to reduce rates of teen childbearing. Before PRWORA, many states received waivers from the federal government allowing them to experiment with the rules of welfare. Many of the changes implemented under these state waivers would become permanent under the implementation of the state’s TANF policy. Grogger and Karoly (2005) provide comprehensive reviews of the research on the impacts of welfare reform on a range of outcomes, including birth rates. Some authors have focused explicitly on the impact of welfare reform as a bundle on teen childbearing rates. Both Kaestner, Korenman, and O’Neil (2003), using the NLSY79 and NLSY97, and Offner (2005), using March CPS data, suggest that TANF negatively impacted teen births. But, the results tend to be modest. For example, Offner (2005) finds that TANF is responsible for a 1.1 to 1.6 percentage point decrease in teen birth rates. In our analysis, we
- 18. 18 include indicators for whether a state-year observation has in place a welfare waiver policy or if it had implemented TANF. One type of welfare reform policy directed squarely at childbearing, though not necessarily teen childbearing, is the so-called family cap. States began to implement family cap policies under federal welfare waivers beginning in 1992. These policies limit either in part or completely any additional benefit for having an additional child while participating in the program. The evidence on family caps is somewhat mixed. Several studies find that the family cap or incremental increases in benefits have no effect on women’s fertility (Dyer & Farlie, 2004; Grogger & Bronars, 2001; Joyce et al., 2004; Kearney, 2004; Romero & Agenor, 2009). Horvath-Rose and Peters (2001) and Sabia (2008) suggest otherwise. Our reading of the studies, taking into account the relative strengths and weaknesses of the various papers, is that at least in the earliest years of implementation, family cap policies did not lead to a reduction in birth rates among target populations. But, it is probably most appropriately considered an open question, especially in terms of what happened in later years post implementation. Our regression analysis in this paper includes an indicator for whether a family cap policy is in place. The welfare reform movement of the 1990s did include a policy targeted directly at would-be teen moms – Minor Parent Provisions (MPP). These provisions allowed states to use federal funds to aid teen mothers under age 18 if they were (1) attending secondary school or another educational forum related to obtaining employment and (2) living with their parents or in another adult-supervised setting, if the teen mother is not living with her husband (Haskins & Blank, 2001). Lopoo and DeLeire (2006) use Vital Statistics natality data to investigate the impact of these provisions on birth rates among teens aged 15 to 17, as compared to birth rates among 18 year old teens not subject to the provisions. The authors find that younger teens experience a more rapid decline in birthrates when the MPPs are in effect. However, given that these provisions were largely implemented simultaneously with other welfare reform policies, it
- 19. 19 is difficult to determine that it is actually these provisions specifically that were responsible for any differential trends. Our analysis below includes an indicator variable for the implementation of an MPP policy. Another state-level policy that is potentially relevant to teen birth rates is child support enforcement. The Child Support Enforcement (CSE) program is a federal program, established in 1974, that recognizes an obligation on the part of nonresident parents to contribute financially to the care of the child. The program consists of establishing paternity, creating an award agreement, and enforcing the nonresident parent’s obligation to pay that award. It is well recognized that greater child support enforcement has theoretically ambiguous effects on non- marital birth rates, potentially making it less costly for mothers (but not necessarily if it crowds out more generous informal support) but more costly for would-be non-marital fathers. Plotnick et al. (2004) investigate the relationship between CSE using data from the NLSY97. They, find that CSE strictness reduces the likelihood of nonmarital teenage childbearing among non-Hispanic, white teenagers. They attribute this mainly to paternity establishment. Aizer and McLanahan (2006) use natality data from 1985 to 1999 to estimate difference-in-difference models of the effect of CSE on birth rates, comparing birth rates among single mothers to those of married mothers, controlling for state and year fixed effects. Their measure of CSE strictness is a measure of state-year expenditures. They argue that this is a more appropriate measure to use as compared to state-level policy indicator variables due to (1) data quality concerns about policy features and (2) state expenditure changes being driven by federal changes, which lessons policy endogeneity concerns. They find that a one percent increase in CSE expenditures leads to a decline in single fertility relative to married fertility of 0.09 percent among low-educated mothers. They do not look in particular at teen births. Following Aizer and McLanahan (2006), we include total annual state-level CSE expenditures as an explanatory variable in our analysis.
- 20. 20 Changes in abortion policies also have the potential to alter individual decisions regarding sexual activity, contraceptive use, and childbearing decisions. There are three general sets of restrictive abortion policies at the state level – parental notification laws, mandatory delay periods, and restrictions on Medicaid funding. Parental involvement laws either require minors to notify a parent or guardian or obtain explicit consent before they can obtain an abortion. Mandatory delay laws require a specified period of time after her initial inquiry before a woman can receive an abortion. In some states, these laws require pregnant women to receive abortion counseling. The policy of restricting federal Medicaid funding for abortions means that federal Medicaid funds cannot be used to cover abortion services. However, states can pay the full cost of the abortion, and a number of states have a policy of doing so. Levine’s (2004) summary of this body of research concludes that these forms of restrictive abortion policies are not found to be associated with higher rates of teen childbearing.21 We include in our analysis measures of whether a state’s Medicaid program restricts funding for abortion, along with indicators of the presence of mandatory delay and parental notification laws. In addition to these policy variables, we also consider the role of state-level economic conditions, focusing mainly on the unemployment rate. Labor market conditions actually have an ambiguous effect on the teen birth rate. A stronger labor market may lead to higher income, which would make having a child more affordable. Alternatively, a stronger labor market increases the opportunity cost of having children, reducing one’s willingness to give birth. Shaller (2011) provides a recent empirical examination of this issue. She finds that birth rates are negatively related to the aggregate unemployment rate. Focusing specifically on teens, Colen, et al.(2006) investigate the relationship between age-specific birth rates and state-specific unemployment rates from 1990 to 1999 for Black and White females aged 10–29. They find that 21 Joyce, et al. (2006) is a more recent entry into this literature that provides some evidence of a reduction in births associated with a parental consent law using a case study approach applied to a Texas law.
- 21. 21 falling unemployment rates in the 1990s were associated with decreased childbearing among black women age 15–24, in particular for women age 18 and 19. This would suggest that improved labor market opportunities lead to lower rates of young childbearing for older black teens. But, those authors find no evidence of a relationship between unemployment rates and fertility for young white women. In our analysis, we include standard measures of the state/year unemployment rate from the Bureau of Labor Statistics to examine this issue ourselves. We also include a state-year measure of lower-tail wage inequality: the ratio of household income at the 50th percentile versus the 10th percentile, constructed using CPS data on total household income. C. Empirical Results Table 3, column 1 reports the detailed regression findings for all teens between the ages of 15 and 19. To summarize these findings, it appears that the unemployment rate is an important determinant of teen childbearing. A higher unemployment rate leads to lower teen childbearing.22 In addition, we are able to detect a statistically meaningful effect of two public policies.23 More generous welfare benefits are associated with higher rates of teen births and income-based Medicaid family planning waivers are associated with lower rates of teen births. The fact that the impact of welfare generosity on teen births is driven entirely by unmarried women supports a causal interpretation since welfare eligibility is largely restricted to this group. A finding of a 22 The discrepancy in these results compared to those in Colen, et al. (2006) may be attributable to the timing link between teen birth rates and labor market conditions. We associate the unemployment rate in year t-1 to the teen birth rate in year t. Although it is difficult to say for sure, it appears Colen, et al. link birth rates to contemporaneous unemployment rates. In fact, when we have estimated models of that form, we also obtain a statistically insignificant relationship between labor market conditions and teen birth rates. Because of the roughly nine month lag, however, between the behaviors that lead to a teen birth and the outcome itself, lagging the unemployment rate seems like a more reasonable approach. 23 One potential concern with this analysis is that we are considering a large number of factors, potentially lessening the power of the analysis. We have also estimated the model focusing on subsets of factors and obtained qualitatively similar results.
- 22. 22 discernible effect of these two policy measures is consistent with previous literature. We discuss the magnitudes of these estimated effects below. The absence of statistically significant relationship between some of these measures and teen births can be just as informative as their presence. Importantly, the data do not support the claims of those who attribute declining teen births to abstinence only or any type of sex education programs. Failure to find a statistically significant result is not conclusive evidence that these programs have no effect for any group or in any context. However, the estimated coefficients and associated standard errors do rule out any sizable effect in the aggregate. They are also consistent with past evidence that is also unable to detect much of an impact of these policies. The remaining columns in the table report the results for subgroups. As we move to smaller groups, the analysis loses statistical precision so some of the estimated effects become statistically insignificant, even though point estimates remain fairly far from zero. Moreover, given the large number of parameters being estimated, it would not be surprising to observe a small number of them that are significantly different from zero just by chance. Our interpretation of these results is based upon patterns in the results that make sense based on our own intuition along with findings from past research. For instance, we see that welfare generosity is estimated to have a much larger impact on non-marital teen births as opposed to marital teen births. Based on past research and program requirements that make it far easier and more generous to obtain welfare benefits if the mother is unmarried, this finding makes sense and solidifies our interpretation that we have identified a causal result. For the most part, Medicaid family planning waivers appear to have a similar impact across all demographic groups, with perhaps a larger impact on married teens (albeit still a statistically significant impact on unmarried teens). Kearney and Levine (2009) did not
- 23. 23 separate teens by marital status, and we have no reason to believe that this finding is counter- intuitive. Beyond that, the coefficient estimates tend to be statistically insignificant, with the exception of a handful that do not necessarily fit any obvious pattern. For instance, the results suggest that Hispanic teens have higher birth rates when parental consent and Medicaid funding restrictions are implemented, but lower birth rates when mandatory delay laws are introduced. Our instinct is to interpret these findings as spurious, but we cannot rule out the possibility that Hispanic women respond differently to abortion restrictions than others. Findings like this would require further investigation before drawing any strong conclusions. Taken as a whole, though, we interpret the subgroup analysis as being supportive of our broader conclusion that the only two policies that appear to have a causal impact on teen childbearing are Medicaid family planning waivers and welfare generosity. D. Magnitude of the Estimated Effects Although some policies seem to have an impact on teen childbearing, our back-of-the- envelope calculations suggest that the magnitude of these effects relative to the total decline in teen births is rather small. We first consider the role of welfare benefits. The estimate effect as reported in Table 4 indicates that a 10 percent reduction in welfare benefits reduces the teen birth rate by 1 percent. In the period between 1991 and 2010, the average fall in the maximum monthly benefit for a family of three, weighted by state teen population, was 32.9 percent. We calculate the predicted decline due to this policy variable by multiplying this reduction by the estimated effect in Table 4 by the realized percent decline (0.010*32.9), yielding an estimated reduction of 3.3 percent in teen births over this period attributable to average declining welfare benefits. With regard to income–based Medicaid family planning expansions, the regression analysis finds that the implementation of such a policy leads to an average reduction in teen birth
- 24. 24 rates of 4.4 percent (an estimate that is quite comparable to that in Kearney and Levine, 2009). As of 2010, income-based waiver policies that include teenagers had been implemented in 12 states, representing 43.8 percent of the teen population. Based on our regression estimates, this would lead to a reduction in teen birth rates of 1.9 percent (0.044*43.8). Combined, these two policies would predict a 5.2 percent decline in teen birth rates between 1991 and 2010. The teen birth rate fell over this period from 61.8 to 34.3, a decline of 44.5 percent. This means that these policy changes can account for approximately 12 percent of the decline in teen fertility since 1991. The magnitude of the impact of changing labor market conditions is limited over the longer term, but sizeable over the past few years. From 1991 through 2010, the unemployment rate rose from 6.8 percent to 9.6 percent. This represents a 2.8 percentage point increase. According to our regression results, this would generate a 3.1 (=2.8*-1.1) percent decline in teen childbearing. This only represents 7 percent of the 44.5 percent overall decline over this period. On the other hand, the jump in the unemployment rate associated with the Great Recession, rising from 4.6 percent in 2007 to 9.6 percent in 2010, would predict a larger share of the actual decline. The 5 point rise in unemployment would lead to a 5.5 percent reduction in teen childbearing. This represents 28 percent of the 19.3 percent decline in teen childbearing rates. As the economy recovers, however, this also means that we may expect a reversal in some of the recent decline in teen childbearing. V. DISCUSSION We began this paper by recognizing the stunning decline in the teen birth rate between 1991 and 2011. In terms of the mechanical determinants of the fall in teen childbearing, we document that the recent decline in teen childbearing is attributable to both reduced sexual activity and increased use of contraception. The data reveal that teen abortion rates fell along
- 25. 25 with childbearing rates, so the decline in teen childbearing is clearly not due to an increased reliance on abortion. We argue that it is crucial from a policy perspective to understand the policy and environmental factors that led to these observed changes in behavior. We first considered the role of demographic trends in driving this decline, and observed that the changing ethnic composition of the teen population would have actually led to an increase in teen childbearing rates, making this drop all the more striking. This is because the Hispanic population has become a larger share of the population and Hispanic women have higher than average teen birth rates. The only demographic movement that appears to appreciably explain any recent trend is the temporary increase in the share of the female teenage population comprised of 18-19 year olds around 1990, which can potentially explain about half of the corresponding spike in teen births at that time. We have considered a large number of policies, including those that observers have alleged contributed to the decline. Based on our review of past research along with the results of the empirical analyses we have conducted here, we find little indication that recently-enacted targeted policies drove much of the decline. Consistent with past research, we are able to identify that falling welfare benefit levels and the expansion of family planning services through income- based waivers to the Medicaid program both appear to be causally linked to a reduction in teen births. However, combined these factors can account for about 12 percent of the total fall in teen birth rates from 1991 to 2010. Weaker labor market conditions also appear to make a small contribution to this longer term decline (albeit a larger one over the past few years), accounting for another 5.5 percent of the fall. We cannot point to any other policy or environmental factor that plays a statistically discernible role in the decline, including improved sex education or the introduction of abstinence only programs.
- 26. 26 It is clear that teenagers made a different set of choices in the period 1991 to 2010 with regard to teen childbearing, as compared to the preceding period. Our findings imply that these decisions were not made in response to targeted policies. It is important to note that our empirical analysis is based on an investigation of how policies implemented at different times across states affected teen birth rates. By design, our analysis cannot identify the forces driving national rates of teen childbearing. The appropriate way to interpret our findings is that policy innovations at the state-level did not drive the decline. There appears to be a more general decrease in the rate of teen childbearing over the past 30 years that reflects a broader cultural shift away from teen childbearing. A reasonable hypothesis is that this general trend reflects the combination of expanded educational and labor market opportunities for women. More research is needed into this question, but identifying causal explanations for broadly experienced trends is extremely challenging. What we have learned from this analysis is that none of the relatively easy, policy-based explanations for the recent decline in teen childbearing in the United States hold up very well to careful empirical scrutiny.
- 27. 27 References Abma, Joyce C. and Freya Sonenstein (2002). “Sexual Activity and Contraceptive Practices among Teenagers in the United States, 1988 and 1995.” National Vital Statistics Reports. 23(21). Aizer, Anna & Sarah McLanahan. (2006). The impact of Child Support Enforcement on fertility, parental investments, and child well being. Journal of Human Resources, 41, 28-45. Boonstra, Heather (2002). “Teen Pregnancy: Trends and Lessons Learned.” The Guttmacher Report on Public Policy. 5(1): 7-10. Colen, Cynthia G., Arline T. Geronimus, and Maureen G. Phipps (2006). “Getting a Piece of the Pie? The Economic Boom of the 1990s and Declining Teen Birth Rates in the United States.” Social Science and Medicine, 63(6): 1531-1545. Durrance, Christine (2012). “The effects of increased access to the morning after pill on abortion and STD rates,” UNC mimeo. Dyer, W. T., & Farlie, R. W. (2004). Do family caps reduce out-of-wedlock births? Evidence from Arkansas, Georgia, Indiana, New Jersey, and Virginia. Population Research and Policy Review, 23, 441-473. Girma, Sourafel and David Paton (2011). “The impact of emergency birth control on teen pregnancy and STIs.” Journal of Health Economics 30(2): 373-380. Girma, Sourafel and David Paton (2006). “Matching Estimates of the Impact of Over-the- Counter Emergency Birth Control on Teenage Pregnancy,” Health Economics, 15(9): 1021– 1032. Gold, Rachel Benson and Adam Sonfield (2001). “Expanding Eligibility and Improving Outreach Under CHIP” The Guttmacher Report on Public Policy, 4(3). Grogger, J., & Bronars, S. G. (2001). The effect of welfare payments on the marriage and fertility behavior of unwed mothers: Results for a twins experiment. The Journal of Political Economy, 109, 529-545. Grogger, Jeff and Lynn A. Caroly (2005). Welfare Reform: Effects of a Decade of Change. Harvard University Press. Guttmacher Institute (2011). “New Government Data Finds Sharp Decline in Teen Births: Increased Contraceptive Use and Shifts to More Effective Contraceptive Methods Behind this Encouraging Trend. New York: Guttmacher Institute. Haskins, R., & Blank, R. M. (2001). Welfare reform: An agenda for reauthorization. In R. M. Blank & R. Haskins (Eds.), The new world of welfare. Washington, DC: The Brookings Institution: 3-32.
- 28. 28 Horvath-Rose, A. E., Peters, H. E., & Sabia, J. J. (2008). Capping kids: The family cap and nonmarital childbearing. Population Research and Policy Review, 27, 119-138. Jaslow, Ryan (2011). “U.S. Birth Rates Decline: Blame Recession?” posted 11/17/2011 at (http://www.cbsnews.com/8301-504763_162-57326875-10391704/u.s-birth-rates-decline-blame- recession/ - accessed 1/4/2012. Joyce, T., Kaestner, R., & Korenman, S. (2003). Welfare reform and non-marital fertility in the 1990s: Evidence from birth records. Advances in Economic Analysis and Policy, 3, 1-34. Joyce, Theodore., Robert Kaestner, and Silvie Colman (2006). "Changes in Abortions and Births and the Texas Parental Notification Law." New England Journal of Medicine, 354 (10):1031- 1038 Kaestner, R., Korenman, S., & O’Neil, J. (2003). Has welfare reform changed teenage behaviors?Journal of Policy Analysis and Management, 22, 225-248. Kearney, Melissa S. (2004). “Is There an Effect of Incremental Welfare Benefits on Fertility Behavior? A Look at the Family Cap.” Journal of Human Resources 39(2): 295-325. Kearney, Melissa S. and Phillip B. Levine (2011). “Income Inequality and Early, Non-Marital Childbearing: An Economic Exploration of the Culture of Despair.” NBER working paper 17157. Kearney, Melissa S. and Phillip B. Levine (2009). “Subsidized Contraception, Fertility, and Sexual Behavior.” Review of Economics and Statistics. 91(1): 137-151. Kirby, Douglas (2007). Emerging Answers 2007: Research Findings on Programs to Reduce Teen Pregnancy and Sexually Transmitted Diseases. Washington, DC: National Campaign to Reduce Teen and Unplanned Pregnancy. Kost, Kathryn, and Stanley Henshaw (2012). “U.S. Teenage Pregnancies, Births and Abortions, 2008: National Trends by Age, Race and Ethnicity.” New York: Guttmacher Institute. Levine, Phillip B. (2001) The Sexual Activity and Birth Control Use of American Teenagers” in Jonathon Gruber (ed.) An Economic Analysis of Risky Behavior Among Youths. Chicago: University of Chicago Press. Levine, Phillip B. (2004) Sex and Consequences: Abortion, Public Policy, and the Economics of Fertility. Princeton, NJ: Princeton University Press. Levine, Phillip B., Douglas Staiger, Thomas J. Kane, and David J. Zimmerman (1999). "Roe v. Wade and American Fertility." American Journal of Public Health. 89(2): 199-203. Lopoo, L. M., & DeLeire, T. (2006). Did welfare reform influence the fertility of young teens? Journal of Policy Analysis and Management, 25, 275-298. Lopoo, Leonard M. and Kerri M. Raissian (2012). “Policy Retrospective: Natalist Policies in the United States.” Journal of Policy Analysis and Management. 31(4): 905-946.
- 29. 29 Martin, Joyce A., Brady E. Hamilton, Stephanie J. Ventura, T.J. Mathews, and Michelle J.K. Osterman, Sharon Kirmeyer, T.J. Mathews, and Elizabeth Wilson (2011). “Births: Final Data for 2009.” National Vital Statistics Reports. 60(1). Martinez, Gladys, Casey E. Copen, and Joyce C. Abma (2011). “Teenagers in the United States: Sexual Activity, Contraceptive Use, and Childbearing, 2006-2010 National Survey of Family Growth.” National Vital Statistics Reports. 23(31). Meyer, Bruce and Dan Rosenbuam (2001). “Welfare, the Earned Income Tax Credit, and the Labor Supply of Single Mothers,” Quarterly Journal of Economics 116: 1063-1114. Moffitt, Robert (1998). “The effect of welfare on marriage and fertility.” In Welfare, the family, and reproductive behavior, ed. R. Moffitt, Washington DC: National Academy Press: 50-97. Moffit, Robert (2003). “The Negative Income Tax and the Evolution of U.S. Welfare Policy.” Journal of Economic Perspectives. 17(3):119-140. Offner, P. (2005). Welfare reform and teenage girls. Social Science Quarterly, 86, 306-322. Plotnick, R. D., Garfinkel, I., McLanahan, S. S., & Ku, I. (2004). Better Child Support Enforcement: Can it reduce teenage premarital childbearing? Journal of Family Issues, 25, 634-657. Raymond, Elizabeth G., James Trussell, and Chelsea B. Polis (2007). "Population Effect of Increased Access to Emergency Contraception Pills: A Systematic Review." Obstetrics & Gynecology 109(1): 181–188. Romero, D., & Agenor, M. (2009). US fertility prevention as poverty prevention. Women’s Health Issues, 19, 355-364. Sabia, Joseph J. (2006). “Does Sex Education Affect Adolescent Sexual Behaviors and Health?” Journal of Policy Analysis and Management, 25(4): 783-802. Sabia, J. (2008). Blacks and the family cap: Pregnancy, abortion, and spillovers. Journal of Population Economics, 21, 111-134. Santelli, John, Laura Duberstein Lindberg, Lawrence B. Finer, and Susheela Singh (2007). “Explaining Recent Declines in Adolescent Pregnancy in the United States: The Contribution of Abstinence and Improved Contraceptive Use. American Journal of Public Health. 97(1): 150- 156. Shaller, Jessamyn. 2011. "Booms, Busts, and Fertility: Testing the Becker Model Using Gender- Specific Labor Demand." University of California-Davis mimeo. Trenholm, Christopher, Barbara Devaney, Kenneth Fortson, Melissa Clark, Lisa Quay, and Justin Wheeler (2008). “Impacts of Abstinence Education on Teen Sexual Activity, Risk of Pregnancy, and Risk of Sexually Transmitted Diseases.” (2008) Journal of Policy Analysis and Management. 27(2):255-276.
- 30. 30 Tulumello, Jennifer Skalka. “Why the U.S. Teen Birthrate Hit a Record Low in 2010.” The Christian Science Monitor, posted 12/12/2011 at http://www.csmonitor.com/USA/Society/2011/1212/Why-the-US-teen-birthrate-hit-a-record- low-in-2010, accessed 1/4/2012. Wolfers, Justin, “Did Unilateral Divorce Raise Divorce Rates? A Reconciliation and New Results,” American Economic Review, 96(5) 1802-1820, December 2006.
- 31. 31 Table 1: Methods of Contraception Used by Sexually Active Teens 1995 2002 2006-2010 Methods Ever Used (conditional on ever having sex) Any Method 96.2 97.7 98.9 Condom 93.5 93.7 95.9 Pill 51.6 61.4 55.6 Withdrawal 42.3 55.0 57.3 Injectable 9.7 20.7 20.3 Rhythm 13.2 10.8 15.0 Emergency Contraception --- 8.1 13.7 Contraceptive Patch --- 1.5 10.3 Contraceptive Ring --- --- 5.2 Female Condom 1.1 1.7 1.5 Other 14.5 9.9 7.1 Methods Used at Last Intercourse (conditional on having sex in last 3 months) Any Method 70.7 83.2 85.6 Condom 38.2 54.3 52.0 Pill or Other Hormonal 32.0 43.3 42.7 Pill 25.0 34.2 30.5 Other Hormonal 7.0 9.1 12.2 All Other Methods 9.6 5.1 11.0 Dual Methods 8.4 19.5 20.1 Sources: Abma and Sonenstein, 2001; and Martinez, et al., 2011.
- 32. 32 Table 2: Impact of Demographic Composition on Teen Birth Rate Variable Coefficient (x 100) Standard Error (x 100) % of Teen Population Age 18-19 1.61 0.71 % of Teen Population Black, Non-Hispanic 0.63 0.98 % of Teen Population Other Race, Non-Hispanic 1.79 2.07 % of Teen Population Hispanic 1.72 0.66 Note: Estimates are obtained from a regression model where the dependent variable is the natural log of the teen birth rate and the list of independent variables also includes state and year fixed effects. It is weighted by the size of the female population between the ages of 15 and 19 in each state. Reported standard errors are clustered at the state level.
- 33. 33 Table 3: Impact of Public Policies and Economic Conditions on Teen Birth Rates (standard errors in parentheses) Age 15-19 Age 15-17 Age 18-19 Nonwhite Hispanic Unmarried Married First Birth Percentage of All Teen Births --- 34.9% 65.1% 30.6% 18.9% 72.2% 27.8% 79.1% Unemployment Rate -0.011 -0.011 -0.012 -0.006 -0.011 -0.004 -0.023 -0.012 (0.003) (0.004) (0.003) (0.003) (0.006) (0.005) (0.008) (0.003) Abstinence Education Funding 0.000 -0.003 0.000 0.016 0.015 0.002 -0.020 -0.015 (0.010) (0.014) (0.009) (0.011) (0.012) (0.016) (0.023) (0.009) Mandatory Sex Education -0.003 -0.005 -0.002 -0.003 -0.007 0.003 -0.009 -0.003 (0.011) (0.011) (0.011) (0.014) (0.014) (0.013) (0.020) (0.013) Mandatory Sex Ed with 0.007 0.010 0.007 -0.018 0.021 0.004 0.023 0.009 Contraception Counseling (0.014) (0.014) (0.016) (0.015) (0.012) (0.014) (0.027) (0.017) Medicaid Income-Based -0.044 -0.037 -0.048 -0.035 -0.006 -0.022 -0.140 -0.057 Family Planning Waiver (0.014) (0.014) (0.015) (0.017) (0.015) (0.011) (0.056) (0.013) Medicaid Income-Based 0.019 -0.004 0.030 0.025 0.036 0.028 0.010 0.007 Fam. Plan. Waiver Age 19+ (0.022) (0.019) (0.027) (0.021) (0.028) (0.018) (0.058) (0.019) Medicaid Duration-Based 0.014 0.007 0.018 0.031 -0.019 0.008 -0.017 0.010 Family Planning Waiver (0.012) (0.014) (0.012) (0.015) (0.015) (0.018) (0.037) (0.016) SCHIP Implemented 0.008 0.003 0.010 0.003 -0.007 0.008 0.029 0.010 (0.009) (0.013) (0.008) (0.027) (0.019) (0.014) (0.014) (0.012) LN(max. AFDC/TANF benefit, 0.100 0.106 0.098 0.046 0.072 0.189 0.029 0.106 family of 3) (0.040) (0.041) (0.041) (0.086) (0.058) (0.049) (0.093) (0.043) TANF Implemented -0.005 0.004 -0.010 -0.008 0.005 -0.027 0.008 -0.017 (0.010) (0.009) (0.013) (0.020) (0.012) (0.025) (0.069) (0.010)
- 34. 34 Table 3 (continued): Impact of Public Policies and Economic Conditions on Teen Birth Rates (standard errors in parentheses) Age 15-19 Age 15-17 Age 18-19 Nonwhite Hispanic Unmarried Married First Birth Family Cap Implemented -0.002 -0.004 -0.001 0.010 -0.008 0.007 -0.035 0.002 (0.009) (0.010) (0.010) (0.015) (0.010) (0.012) (0.022) (0.011) AFDC/TANF Minor Parent 0.011 0.005 0.016 -0.008 0.011 0.010 0.010 0.012 Provisions (0.009) (0.010) (0.011) (0.013) (0.010) (0.016) (0.057) (0.008) Parental Consent -0.014 -0.014 -0.014 -0.008 0.064 -0.026 -0.019 -0.019 (0.011) (0.013) (0.012) (0.011) (0.017) (0.019) (0.030) (0.013) Mandatory Delay 0.001 0.004 0.000 -0.011 -0.031 -0.024 0.032 0.011 (0.010) (0.014) (0.009) (0.013) (0.014) (0.018) (0.024) (0.008) Medicaid Funding Restriction 0.038 0.039 0.038 0.031 0.044 0.046 0.012 0.030 (0.025) (0.026) (0.025) (0.024) (0.022) (0.029) (0.027) (0.026) Child Support Expenditures 0.009 0.006 0.010 0.019 0.003 0.002 0.017 0.002 (in millions, $2011) (0.006) (0.007) (0.006) (0.009) (0.006) (0.007) (0.011) (0.006) 50/10 Ratio 0.100 0.096 0.119 0.240 -0.227 -0.064 0.198 0.102 (0.115) (0.139) (0.111) (0.115) (0.158) (0.224) (0.252) (0.118) Sample Size 1530 1530 1530 1530 1071 1530 1530 1530 Notes: The dependent variable in all regression models is the natural log of the birth rate for the relevant demographic group. All models control for the demographic characteristics of the state’s population and also include state and year fixed effects along with state-specific linear, quadratic, and cubic trends. Regressions are weighted by the population for the relevant demographic group. Standard errors are clustered at the state level.
- 35. 0 20 40 60 80 100 120 140 1970 1971 1972 1973 1974 1975 1976 1977 1978 1979 1980 1981 1982 1983 1984 1985 1986 1987 1988 1989 1990 1991 1992 1993 1994 1995 1996 1997 1998 1999 2000 2001 2002 2003 2004 2005 2006 2007 2008 2009 2010 Birthsper1,000WomenAge15-19 Year Figure 1: Trend in the Teen Birth Rate All White Black Hispanic Source: Martin, et al. (2011)
- 38. APPENDIX: DATA SOURCES Maximum AFDC/TANF benefit plus food stamps for a family of three. We obtained these data from the public-use database of state policies provided by the University of Kentucky Center for Poverty Research. These data are available on the Center’s website: http://www.ukcpr.org/EconomicData/UKCPR_National_Data_Set_12_16_10_Public(1).xlsx That source contains detailed lists of sources that they used to compile these data. Welfare reform and “family cap” indicators. Information on welfare reform policies through 2002 were obtained from three sources: (1) a technical report of the Council of Economic Advisers (1999); (2) an Urban Institute report written by Gallagher, Gallagher, Perese, Schrieber, and Watson. (1998); and (3) a report by Crouse (1999), prepared for the U.S. Department of Health and Human Services, which summarizes information contained in a report of the U.S. Department of Health and Human Services (1997). We updated this series for more recent years using information from the Urban Institute Welfare Rules Database. Legal abortion restrictions, including parental notification/consent laws and mandatory waiting periods. Levine (2004) includes a detailed description of these restrictions and how the variables are coded. We updated Levine’s earlier series by comparing changes in legal status between 2004 and what is reported by Guttmacher as 2010 law. For the set of states with reported changes, we searched the state websites for information about dates of implementation: http://prochoiceamerica.org/government-and-you/state-governments/. Medicaid funding of abortion. Levine (2004) includes a detailed description of these restrictions and how the variables are coded. We updated Levine’s earlier series using information from NARAL – “Restrictions on Low Income Women's Access to Abortion”, accessed 10/15/10. This website reports when any new legislation was enacted in states: http://www.prochoiceamerica.org/what-is-choice/fast-facts/low-income-women.html Indicator variables for a poverty-based or duration-based Medicaid family planning waiver. Kearney and Levine (2008) provides details about these policies and implementation dates. We updated that series for more recent years using information from the CMS website: http://www.cms.gov/MedicaidStWaivProgDemoPGI/MWDL/list.asp (Accessed 9/14/10), S-CHIP implementation. Information is obtained from public documents of the Centers for Medicare and Medicaid Services (CMS). State HIV/sex education policies. We use a series of Guttmacher States in Brief reports (ex: http://www.guttmacher.org/statecenter/spibs/spib_SE.pdf, January 2011). For those years with reports not available on-line, we requested and received hard copy documents directly from the Guttmacher Institute. Federal abstinence education funding. We create a state level indicator based on whether a state accepted Abstinence Education (SS Title V Section 510) funding. These data come from the following on-line documents, accessed Jan 2011:
- 39. (1) US Dept Health and Human Services, HRSA, MCHB, 2000 Annual Report for the Abstinence Education Provision of US Welfare Reform Law P.L. 104-193 Table 1b (July 2002) ftp://ftp.hrsa.gov/mchb/abstinence/annualrpt00.pdf (1998-2002) (2) States' Implementation of Title V, FY 1999 (Sonfield and Gold , 1999) (3) SIECUS Funding by State 2003, 2004, 2005, 2006, 2007, 2008, 2009 http://www.siecus.org/index.cfm?fuseaction=Page.ViewPage&PageID=1260 SIECUS Fact Sheet: State by State Decisions: The Personal Responsibility Education Program and Title-V Abstinence Only Education http://www.siecus.org/index.cfm?fuseaction=Page.ViewPage&PageID=1272 Minor Parent Provisions (TANF) – we thank Elizabeth Peters and Len Lopoo for sharing the coding of these provisions, as used in Lopoo and DeLeire (2006). Child Support Enforcement, Total Program Expenditures: Obtained from U.S. Department of Health and Human Services, Office of Child Support Enforcement, years 2005-2011: http://www.acf.hhs.gov/programs/cse/pubs/2012/reports/fy2009_annual_report/. We thank Anna Aizer for providing us with the data for earlier years, as used in Aizer and McLanahan (2006).
- 40. Appendix Table 1: Year of Implementation of Various Policies, by State State Welfare waiver/ TANF Welfare Family Cap Medicaid Abortion Funding Restriction Parental Involve- ment Abortion Mand Wait Period Medicaid Family Planning Waiver, Income Based+ Medicaid Family Planning Waiver, Duration Based SCHIP Accepted Title V-510 Abstin. Funding Mand Sexuality Educ Sex Educ must cover contra- ception Minor Parent Provision (MPP) Alabama 1997 - 1981 1987 - 2000+ - 1999 - 1998 2001 1996 Alaska 1998 - - - - - - 2000 2008 2001 - 1997 Arizona 1996 1996 1977 - - - 1995 1999 - - - 1995 Arkansas 1995 1995 1981 1989 2001 1997 - 1999 - 1998 - 1997 California 1993 1998 - - - 1997 - 1999 1998 - 2001 1998 Colorado 1998 1998 1985 1998 - - - 1999 2008 - 2007 1997 Connecticut 1996 1996 - - - - - 1999 2006 - - 1994 Delaware 1996 1996 1981 1995 - - 1996 2000 2008 1998 2001 1995 District of Columbia 1998 -- 1998 - - - - 1999 1999 1998 2003 1997 Florida 1997 1997 1981 2005 - - 1998 1999 - 2001 - 1996 Georgia 1994 1994 1981 1991 2005 - - 1999 - 1998 - 1997 Hawaii 1998 -- - - - - - 2001 - 1998 2001 1997 Idaho 1998 1998 1981 2001 1995 - - 1998 2008 - - 1997 Illinois* 1994 1996/ 2004 1981 - - 2004+ 2004 1999 - 1998 2004 1997 Indiana 1996 1996 1981 1986 1997 - - 1998 - - - 1995 Iowa 1994 - 1981 1996 - 2006 - 1999 - 1998 - 1993 Kansas 1997 - 1981 1992 1992 - - 1999 - 1998 - 1996 Kentucky 1997 - 1978 1994 2000 - - 1999 - 2001 - 1996 Louisiana 1997 - 1981 1986 1995 2006+ - 1999 - - - 1997 Maine 1997 - 1981 1989 - - - 1999 2005 2001 2002 1996 Maryland 1997 1997 - 1992 - - 1995 1999 - 1998 2001 1996 Massachusetts 1996 1996 - 1986 - - - 1998 2008 - - 1995 Michigan 1993 - 1989 1991 1999 2006+ - 1999 - - - 1992
- 41. Minnesota 1998 2003 1981 1986 - 2006 - 1999 2008 1998 - 1997 Mississippi 1996 1996 1981 1993 1992 2003 - 1999 - - - 1997 Missouri 1996 - 1981 1986 1986 - 1999 1999 - - 2001 1995 Montana 1997 - 1981 - - - - 1999 2007 2006 - 1997 Nebraska 1996 1996 1981 1991 1993 - - 1999 - - - 1996 Nevada 1997 - 1981 - - - - 1999 - 1998 - 1996 New Hampshire 1997 - 1981 - - - - 1999 1998 - - 1996 New Jersey 1993 1993 - - - - - 1999 2007 1998 2001 1997 New Mexico 1998 1998 1981 - - 1998+ - 2000 2008 - - 1997 New York 1998 - - - - 2002 2002 1999 2008 - - 1996 North Carolina 1997 1997 1996 1995 - 2005+ - 1999 - 1998 - 1996 North Dakota 1998 1998 1978 1986 1994 - - 1999 - - - 1997 Ohio 1997 - 1981 1986 1994 - - 1998 2008 - - 1996 Oklahoma 1997 1997 1981 2001 2005 2005+ - 1998 - - - 1996 Oregon 1994 - - - - 1999 - 1999 - 2008 2001 1996 Pennsylvania 1998 - 1985 1994 1994 2007 - 1999 2004 - - 1997 Rhode Island 1998 - 1978 1986 - - 1994 1998 2007 1998 2001 1997 South Carolina 1997 1997 1981 1990 1995 1994 1994 1998 - 1998 2001 1996 South Dakota 1995 - 1981 1997 1994 - - 1999 - - - 1996 Tennessee 1997 1997 1981 1995 - - - 1998 2008 1998 - 1996 Texas 1997 - 1981 1999 2003 - - 1999 - - - 1996 Utah 1993 - 1981 1986 1994 - - 1999 - 1998 - 1996 Vermont 1995 - - - - - - 1999 2007 1998 2001 1994 Virginia 1996 1996 1981 1997 2001 2002 2002 1999 2008 - 2001 1995 Washington 1996 - - - - 2001 - 2001 2008 - 2006 1997 West Virginia 1997 - - 1986 - - - 1999 - 1998 2001 1997 Wisconsin 1996 1996 1981 1986 1997 2003 - 2000 2007 - - 1997 Wyoming 1997 1997 1978 1989 - - - 2000 2007 2001 - 1996 Notes: + State Medicaid family planning waiver specifically excluded teenagers. * Illinois repealed its family cap policy in 2004