PET scan in cardiac imaging
•Als PPTX, PDF herunterladen•
3 gefällt mir•407 views

PET scan in cardiac imaging by Dr. Crystal KC

Empfohlen
Weitere ähnliche Inhalte
Was ist angesagt?
Was ist angesagt? (20)
Ähnlich wie PET scan in cardiac imaging
Ähnlich wie PET scan in cardiac imaging (20)
Mehr von Milan Silwal
Mehr von Milan Silwal (20)
Kürzlich hochgeladen
Kürzlich hochgeladen (20)
PET scan in cardiac imaging
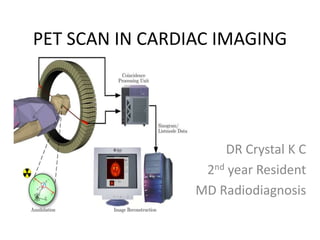
- 1. PET SCAN IN CARDIAC IMAGING DR Crystal K C 2nd year Resident MD Radiodiagnosis
- 2. Introduction • Positron emission tomography (PET) is a modern non-invasive imaging technique for quantification of radioactivity in vivo. • It involves the intravenous injection of a positron-emitting radiopharmaceutical, waiting to allow for systemic distribution, and then scanning to detect and quantification of patterns of radiopharmaceutical accumulation in the body.
- 3. BASICS • Positron Emission: • Positron(e+ ) is the antimatter particle of the electron(e_ ). • Is emitted from the radionuclides such as F- 18, carbon-11 and oxygen -15. • Most commonly used is the isotope of fluorine.
- 4. Fluorine • Atomic number: 9 • Electrons 2+7 • Proton: 9 • Neutrons: 10 • Nucleons : 10+9= 19 • 19 9F is stable. • Isotopes: 18 9F – Is commonly used radioisotope.
- 5. Decay of18 9F •18 9F Decay 18 8O + e+
- 6. • O-18 and F-18 are isobars, that is, they have the same mass number (A nucleons) but different atomic numbers • Z is 8 for oxygen and 9 for fluorine. • F-18 is an unstable radioisotope and has a half-life of 109 minutes. • It decays by beta-plus emission or electron capture and emits a neutrino and a positron.
- 7. Annihilation Figure 1. Annihilation reaction. Positrons released from the nucleus of FDG annihilate with electrons , releasing two coincidence 511- keV photons , which are detected by scintillation crystals (blue rectangles). N neutron, P proton.
- 8. Production of F-18 Figure 2. Production of F-18. After acceleration in a cyclotron, negatively charged hydrogen ions (red and blue spheres) pass through a carbon foil in a carousel, which removes the electrons (blue spheres) from the hydrogen ion, leaving behind high-energy protons (red spheres). The protons are directed toward a target chamber that contains stable O- 18–enriched water, thus producing hydrogen (F-18) fluoride.
- 9. •H2(O-18) +H-1 + energy H2(F-18).
- 10. • Typically, 0.3 mL of O-18–enriched water in a silver container (called a slug) is the target for production of 400–500 mCi of F-18 under standard conditions by using the cyclotron. • This process takes approximately 20 minutes. • By varying the amount of O-18–enriched water in the slug, larger quantities of F-18 fluoride can be produced.
- 11. Synthesis of FDG • Bombarding O-18–enriched water with protons in the cyclotron results in a mixture of H2(F-18) and O-18–enriched water. • Synthesis of FDG from this mixture is an automated computer-controlled radiochemical process that takes approximately 50 minutes to complete. • The FDG thus produced is a sterile, non pyrogenic, colorless, and clear liquid.
- 12. Tumor Physiology and FDG uptake
- 13. Detection of Emission • A positron is a positively charged electron with the same mass as an electron that annihilates with an electron within milliseconds of its emission • Release two photons (511 keV) moving in opposite directions. • These annihilation photons, and not positrons, are detected during PET.
- 14. • The detectors in PET scanners are scintillation crystals coupled to photomultiplier tubes (PMTs). • Compared with most radioisotopes used in nuclear medicine, the radionuclides in PET emit photons of much higher energies (511 keV for FDG vs 140 keV for technetium-99m). • Hence, detectors with much higher stopping power are required.
- 15. Figure : Photograph (frontal view) of a hybrid PET-CT scanner shows the PET ring detector system (red ring). There are up to 250 block detectors in the ring. Drawing shows a detector block with 8x8 smaller scintillation crystals (green and orange rectangles) linked to four photomultiplier tubes (blue circles).
- 16. PET Detectors Cerium doped Lutetium oxyorthosilicate (LSO) o Emits five fold as much light as BGO crystals. o Decay time for LSO is lower at 40 nsec (300nsec) o This enables the necessary counts or scintillation events required for image formation to be obtained in less time when LSO crystals are used, thereby significantly decreasing the scanning time and increasing patient throughput.
- 17. Bismuth germinate (BGO) • Absorption efficiency of BGO crystals is greater than that of LSO crystals. • The coincidence detection efficiency is approximately 80% for photon. Cerium- doped gadolinium silicate (GSO) • Can detect gamma rays over wide energy spectrum from low-energy 28–35-keV photons from iodine-125 to 511- keV annihilation photons from FDG.
- 18. PET- CT Fusion • PET is limited by poor anatomic detail, and correlation with some other form of imaging, such as CT/ MRI is desirable for differentiating normal from abnormal radiotracer uptake. • Precisely coregistered functional and anatomic images can be obtained by performing a PET study and a CT study on the same scanner without moving the patient.
- 19. • As with CT imaging, MR imaging provides accurate anatomic detail but also advanced soft tissue contrast, allowing improved discrimination of lesions and pathological changes. • Less radiation than PET/CT to the young pts and those who has to undergo repeated scans.
- 21. Scanning Technique FDG myocardial metabolism imaging protocol: • 4 hours fasting. • Check blood glucose level with glucose strip. • Ensure hyperinsulineamic euglycemic condition. RBS < 100mg/dl Give 90mg glucose Wait for 1 hr Give 2 U Insulin 10mCi of FDG i/v RBS 100-150 5U Insulin 10mCi FDG RBS 150-200 10U Insulin 10mCi FDG RBS >200 Give 15U Insulin Check RBS after 30min Put in sliding scale 10mCi FDG
- 22. • Perform scan after 40 mins of injection of FDG. • Inhibit speak for 20mins . • No streneous exercise. • Void urine and check whether diuretics used or not. • Process data and dipslay attenuation corrected images in cardiac axis projections (short axis , vertical long axis and horizontal long axis).
- 23. 13 NH3 Non gated Rest- stress Myocardial Perfusion imaging protocol • 12 lead ECG and BP monitoring. • Inject 30mCi 13 NH3 and scan after 5 mins. • Give dipyridamole at 0.142mg/kg/min for 4 mins. • Then again give 30mCi 13 NH3 and scan after 5 mins. • Give aminophyline at 100mg iv slowly. • Process data.
- 24. Terms used Myocardium Coronary artery disease
- 25. i Important prognostic information can be obtained by myocardial perfusion imaging. Normal findings at Stress- rest myocardial perfusion indicates that a person have very low less than 1% event rate future cardiac death or non fatal MI , even when Echocardiography and angiographic findings are positive.
- 27. Hibernating Myocardium • Retains cellular integrity despite reduced perfusion but cannot sustain high energy requirement of contraction. • FDG pet is considered the standard of reference for detecting hibernating myocardium that may be amenable to revascularization.
- 29. SPECT vs PET
- 30. PET imaging of atherosclerotic disease • Atherosclerosis is a leading cause of morbidity and mortality. • The disease is more than simply a flow-limiting process and that the atheromatous plaque represents a nidus for inflammation with a consequent risk of plaque rupture and atherothrombosis, leading to myocardial infarction or stroke. • Positron emission tomography (PET) has allowed the metabolic processes within the plaque to be detected and quantified directly.
- 31. • Frequently used invasive angiography remains the gold standard anatomical imaging technique, non- invasive modalities (CT angiography or perfusion) are increasingly being used for individuals with stable symptoms and low to moderate risk profiles. • But these gives detail about the atherosclerotic stenosis of the coronary vessels and fails to describe about the stability of the plaque.
- 32. • Significant atheroma burden with a high risk of subsequent cardiac events may be present in the absence of luminal stenosis due to outward artery remodeling. • Positron emission tomography (PET) is one such imaging modality that can detect and quantify the pathophysiological processes associated with atherogenesis and subsequent plaque destabilization.
- 33. PET Radioligands • Inflammation (with radioligands targeting macrophages, including 18Ffluorodeoxyglucose, somatostatin receptor ligands, and translocator protein ligands). • Microcalcification :18F-sodium fluoride. • Hypoxia :18F-fluoromisonidazole.
- 34. Pathophysiology • Glucose transporter member (GLUT) 1 and 3, which are upregulated during atherogenesis due to hypoxia within the atheroma core. • Silvera et al. imaged individuals with vascular risk factors and found FDG TBR(Tissue to background ratio) mean to be higher for lipid-rich plaques, which are often vulnerable to rupture, than for collagen- rich or calcified plaques with a lower risk of rupture.
- 35. Standarized Uptake Ratio • The SUV is a semiquantitative assessment of the radiotracer uptake from a static (single point in time) PET image. The SUV of a given tissue is calculated with the following formula: tracer activity in tissue injected radiotracer dose/patient weight • The mean SUV is the mathematical mean of all the pixels in the region of interest • The minimum and maximum SUV are values of the pixel with the lowest and highest SUV, respectively.
- 36. • TBR was devised to correct for blood uptake of radiotracer, the (blood pooling) effect. • TBR is calculated as the ratio of the SUV of the arterial wall to the SUV in the mid-lumen of a large vein with no evident spill-over effect from neighboring tissues.
- 37. Findings • FDG uptake has been shown to identify symptomatic carotid plaques that were non-stenotic on high- resolution MRI, supporting the concept that the severity of stenosis is not the sole determinant for plaque rupture. • Similarly, carotid SUVmean and TBRmean are significantly higher for cohorts with acute coronary syndrome than for those with chronic stable angina.
- 38. FDG-PET/CT showing areas of focal radiotracer uptake in the wall of the descending aorta (arrows)
- 39. • Dynamic contrast enhanced(DCE) MRI has been shown to have superior spatial resolution than PET/CT, and contrast enhancement has been particularly effective in the assessment of fibrous cap thickness and lipid core volume, where the former enhances while the latter fails to enhance.
- 40. 18F-Sodium Fluoride • Inflammation is not the sole metabolic process contributing to plaque vulnerability • Inflammation within the atheroma can promote microcalcification, the formation of deposits of calcium smaller than 50 μm, through cytokine-mediated promotion of osteoblast-like cells derived from vascular smooth muscle cells. • Both macrophage burden and osteogenic activity increased with plaque progression. • Microcalcification may predispose to plaque rupture either through mechanical disruption to the fibrous cap and/or provoking ongoing inflammation around the deposits.
- 41. • 18F-sodium fluoride (NaF) used in PET imaging is able to identify areas of microcalcification in vivo because the radiolabeled fluoride is taken up at sites of mineralization, where it replaces the hydroxyl group of hydroxylapatite. • A prospective study has shown that NaF TBRmax is higher in individuals with coronary artery disease, stable angina, or previous cardiovascular events . • Increased tracer uptake has been shown to be associated with symptomatic coronary plaques, with the increased uptake seen in morphologically high risk but unruptured plaques suggesting that uptake reflects the microcalcification process rather than increased surface area following plaque rupture.
- 42. Lower limb 18F-NaF imaging: non-contrast CT (top left) with a rim of calcification of the vessel, 18F-NaF PET (top right), and fused 18F-NaF PET/ CT (bottom left) of the femoral artery (arrow) at the level of the adductor canal, demonstrating significant vessel uptake in this symptomatic patient. In addition, there is prominent uptake seen in the vessel at the same level on the coronal image (bottom right)
- 43. Quantifying Hypoxia • Atherosclerosis is often associated with hypoxia, presumably due to an increasing oxygen demand from foam cells. • This likely results from reduced diffusion efficiency from lumen to wall as plaque thickness increases. • Whereas structural imaging techniques can assess the size of the necrotic core of the plaque, PET imaging using 18F-fluoromisonidazole (FMISO) can measure the effects of hypoxia within the core directly.
- 44. Cardiac Tumors • Primary cardiac tumors are rare, with an incidence ranging from 0.001% to 0.028% in autopsy reports. • Approximately 20%–25% of these tumors are malignant, with angiosarcoma being the most common malignant cardiac tumor. • In contrast, secondary cardiac tumors, such as metastasis to the heart from other malignant tumors, occur more frequently.
- 45. • Preoperative differentiation of the benign and the malignant tumors is necessary. • Catheter-based biopsy is not suited in most of the tumors. • CT/ MRI may help in differentiation but without sufficient accuracy. • Molecular imaging methods such as 18F-FDG with PET can visualize tumor metabolism and thereby assess metabolic activity.
- 48. Cardiac Tumors
- 49. • FIGURE 3. A 59-y-old woman presenting with pleural, eripcardial effusion and chest pain. Cardiac CT revealed left ventricular epicardial tumor (A, arrow). MR images show hypervascular epicardial tumor (C, T2 hyperintense; D, contrast- enhanced T1) and large pericardial effusion. 18F- FDG PET/CT revealed low uptake within tumor (B, arrow)
- 50. Cardiac tumors A 48-y-old man presenting with incidentally diagnosed cardiac mass in left atrium on echocardiography: transaxial slices zoomed to heart (left), maximum-intensity projection of trunk (middle), and histology image (right). SUVmax of cardiac tumor (yellow arrows) was not increased against background, and there were no further 18F-FDG–positive lesions throughout whole-body 18F- FDG PET/CT. Histologic work- up after tumor resection revealed benign primary cardiac myxoma.
- 51. Cardiac tumors • A 48-y-old woman initially presenting with dyspnea and pleural effusion: transaxial slices zoomed to heart (left), maximum intensity projection of trunk (middle), and histology image (right). Thorax CT revealed right atrial tumor mass, which on PET showed strong 18F-FDG uptake (green arrows). Whole-body 18FFDG PET/CT assessed diffuse bone marrow metastases (pink arrows, right). Histologic work-up of tumor biopsy revealed malignant primary cardiac tumor and angiosarcoma.
- 52. Cardiac Sarcoidosis • MR imaging informs about myocardial structure, function, and the pattern of injury whereas 18F-FDG–PET informs about myocar • MR+PET+ patients demonstrated increased 18F-FDG uptake co-localizing with regions of LGE (Late Gadolinum E Enhancement) images and were considered to have imaging evidence of active cardiac sarcoidosis. • MR+PET– patients had characteristic LGE appearances but no increase in 18F-FDG activity, suggesting chronic scarring secondary to “burnt-out” sarcoidosis, whereas MR–PET– patients had no evidence of cardiac sarcoidosis involvementdial and extra-cardiac inflammation.
- 53. Sarcoidosis Magnetic resonance (MR) and positron emission tomography (PET) images from 4 patients with active cardiac sarcoidosis in whom characteristic patterns of myocardial late gadolinium enhancement (left column) co-localize with increased 18F- fluorodeoxyglucose uptake (fused images, right column)
- 54. Myocarditis • Patients with myocarditis commonly present with troponin-positive chest pain but a normal coronary angiogram. • MR scanning is already widely used to confirm the diagnosis and rule out myocardial infarction based on the characteristic pattern of mid-wall LGE. • In certain cases, addition of 18F-FDG–PET scanning might prove complementary, indicating whether the underlying disease process is active.
- 55. Myocarditits MR/PET imaging of a 25-year-old woman with pericarditic chest pain. (A) The late gadolinium enhancement (LGE) images demonstrate linear mid-wall LGE consistent with myocarditis. (B) Increased 18F- fluorodeoxyglucose (18F-FDG)– PET uptake co-localized with LGE on fusion image indicating active disease
- 56. Cardiac Amyloidosis • MR scanning is a well-established tool in the diagnosis of cardiac amyloidosis. • However, MR scanning is unable to differentiate between the 2 predominant forms of amyloid: acquired monoclonal immunoglobulin light-chain and transthyretin related (TTR). • Different prognoses and emerging treatments.
- 57. • Patients with TTR amyloid exhibited increased myocardial activity of the PET bone tracer 18F- fluoride than patients with acquired monoclonal immunoglobulin light-chain amyloid. • Moreover, increased PET activity was observed to co-localize with the pattern of injury observed on LGE.
- 58. Limitations of PET- CT Misregistration artifact: • Patient motion in PET-CT imaging can produce significant artifacts on the fused images and may cause confusion as to the correct position of the origin of the detected photon. • Patient motion is minimized by carefully instructing patients not to move during the study. • Placing them in a comfortable position before the start of the study • Ensuring that they are not taking diuretics, which may otherwise require them to evacuate the bladder during the study • Having patients empty their bladder before the start of the study
- 59. • Respiratory, cardiac and the bowel motions are unavoidable. • Patient motion may appear as a mismatch between two sets of images. • By comparing the activity of the tracer over normal organs and their CT images artifacts can be determined and can be accounted for interpretations of the images.
- 60. Misregistration artifact. FDG PET–CT was performed for staging in a patient with carcinoma of the left breast. Axial fused FDG PET–CT image shows a lymph node in the left axilla (straight arrow). Focal ypermetabolism in the node (curved arrow) appears lateral to its expected location in the axilla and overlies axillary fat instead of the node. Misregistration between the CT and PET images is due to patient motion between the CT and PET portions of the examination.
- 61. Attenuation correction artefacts. Attenuation correction artifact. (a) Attenuation-corrected coronal fused FDG PET–CT imageshows a focus of intense hypermetabolism in the right supraclavicular region (arrow). (b) Attenuation-uncorrected fused FDG PET–CT image obtained at the same level shows that the apparent focus of hypermetabolism is an attenuation correction artifact from a pacemaker (arrow)
- 62. Attenuation (transmission) correction artifacts • Attenuation (transmission) correction artifacts can occur where there are highly attenuating objects in the path of the CT beam, such as hip prostheses, pacemakers, dental devices, and contrast- enhanced vessels. • PET-CT attenuation corrects (overcorrects photopenic areas adjacent to high attenaution structures at CT and makes them hypermetabolic.
- 63. Patient with transthyretin- related amyloidosis (ATTR). (A) Short-axis fused MR/PET image demonstrating increased myocardial 18F-sodium fluoride uptake co-localizing to areas of LGE (white arrows) in the inferolateral wall.
- 64. • If the patient has undergone strenuous activity preceding or following injection of FDG, normal muscles may take up the radiotracer and show increased activity on the PET images.This is usually easy to distinguish from malignancy by comparison with the CT images for a focal mass or lesions. • FDG uptake in normal muscle is diffuse and frequently symmetric.
- 65. Normal physiological uptake • brain tissue • skeletal muscle, especially after strenuous activity and laryngeal muscles following speech • myocardium • gastrointestinal tract, e.g. intestinal wall • genitourinary tract: FDG is excreted via the renal system and passes into the collecting systems • brown fat • thymus • bone marrow
- 66. False-positive FDG uptake This may occur due to the following conditions: • granulomatous disease • abscess • surgical changes • foreign body reaction • excessive bowel uptake with metformin therapy • inflammation (although at times e.g. evaluating for vasculitis, this may be the finding of interest)
- 67. THANK YOU
- 68. Refrences • An Introduction to PET-CT Imaging; Vibhu Kapoor et al; RadioGraphics 2004; 24:523–543. • PET Imaging of Atherosclerotic Disease: Advancing Plaque Assessment from Anatomy to Pathophysiology Nicholas R. Evans et al. April 2016. • Cardiac PET/CT for the Evaluation of Known or Suspected Coronary Artery Dise Marcelo F. Di Carli ase et al; RadioGraphics 2011; 31:1239–1254. • Differentiation of Malignant and Benign Cardiac Tumors Using 18F- FDG PET/CT;Kambiz Rahbar et al:J Nucl Med 2012; 53:1–8. • SPECT and PET CT in coronary artery disease,Hossein Jodvar; Radiographics 1999.
Hinweis der Redaktion
- 511 kev is according to the law of conservation of energy is equal to the mass of an electron.
- 18F-fluorodeoxyglucose (FDG) is the mainstay radioligand in PET imaging and consequently has been the most common radioligand used in imaging studies of atherosclerosis. Originally used for malignancy staging, incidental findings of FDG accumulation in arterial territories during wholebody scans heralded its utility for detecting and quantifying inflammation within atheroma [