SlideShare ist ein Scribd-Unternehmen logo
1 von 9
Downloaden Sie, um offline zu lesen
News ReleaseFOR IMMEDIATE RELEASE:
Housing demand remains strong despite diminishing supply
VANCOUVER, B.C. – December 2, 2015 – Home sales reached near record levels in
November even as home listings began the traditional year-end decline.
The Real Estate Board of Greater Vancouver (REBGV) reports that residential property sales in
Metro Vancouver reached 3,524 on the Multiple Listing Service® (MLS®) in November 2015.
This represents a 40.1 per cent increase compared to the 2,516 sales recorded in November 2014,
and a 3.3 per cent decrease compared to the 3,646 sales in October 2015.
Last month’s sales were 46.2 per cent above the 10-year sales average for the month and rank as
the second highest November on record for residential property sales.
“November is typically one of the quietest months of the year in our housing market, but not this
year,” Darcy McLeod, REBGV president said. “The ratio of sales to home’s available for sale
reached 44 per cent in November, which is the highest it’s been in our market in nine years.”
New listings for detached, attached and apartment properties in Metro Vancouver totalled 3,392
in November. This represents a 12.5 per cent increase compared to the 3,016 new listings
reported in November 2014.
The total number of properties listed for sale on the real estate board’s MLS® is 8,096, a 35 per
cent decline compared to November 2014 and a 15.4 per cent decline compared to October 2015.
“Demand remains strong and there are housing options at different price points throughout the
region,” McLeod said. “It’s important to work with your REALTOR® to understand your
options before you embark on your home buying journey.”
The MLS® Home Price Index composite benchmark price for all residential properties in Metro
Vancouver is currently $752,500. This represents a 17.8 per cent increase compared to
November 2014.
The sales-to-active-listings ratio in November was 43.5 per cent. Generally, analysts say that
downward pressure on home prices occurs when the ratio declines below the 12 per cent mark,
while home prices often experience upward pressure when it reaches 20 per cent, or higher, in a
particular community for a sustained period of time.
Sales of detached properties in November 2015 reached 1,335, an increase of 31.9 per cent from
the 1,012 detached sales recorded in November 2014, and a 44.2 per cent increase from the 926
units sold in November 2013. The benchmark price for a detached property in Metro Vancouver
increased 22.6 per cent from November 2014 to $1,226,300.
Sales of apartment properties reached 1,553 in November 2015, an increase of 47.6 per cent
compared to the 1,052 sales in November 2014, and an increase of 60.3 per cent compared to the
969 sales in November 2013. The benchmark price of an apartment property increased 14 per
cent from November 2014 to $435,000.
Attached property sales in November 2015 totalled 636, an increase of 40.7 per cent compared to
the 452 sales in November 2014, and a 49.3 per cent increase from the 426 attached properties
sold in November 2013. The benchmark price of an attached unit increased 11.3 per cent
between November 2014 and 2015 to $536,600.
*Editor’s Note: Areas covered by Real Estate Board of Greater Vancouver include: Whistler, Sunshine Coast,
Squamish, West Vancouver, North Vancouver, Vancouver, Burnaby, New Westminster, Richmond, Port Moody,
Port Coquitlam, Coquitlam, New Westminster, Pitt Meadows, Maple Ridge, and South Delta.
-30-
The real estate industry is a key economic driver in British Columbia. In 2014, 33,116 homes changed ownership in
the Board’s area, generating $2.136 billion in economic spin-off activity and an estimated 16,227 jobs. The total
dollar value of residential sales transacted through the MLS® system in Metro Vancouver totalled $27.3 billion in
2014. The Real Estate Board of Greater Vancouver is an association representing nearly 12,000 REALTORS® and
their companies. The Board provides a variety of member services, including the Multiple Listing Service®. For
more information on real estate, statistics, and buying or selling a home, contact a local REALTOR® or visit
www.rebgv.org.
For more information please contact:
Craig Munn
Manager, Communication
Real Estate Board of Greater Vancouver
604.730.3146
cmunn@rebgv.org
Property Type Area
Benchmark
Price
Price
Index
1 Month
Change %
3 Month
Change %
6 Month
Change %
1 Year
Change %
3 Year
Change %
5 Year
Change %
10 Year
Change %
Residential / Composite Lower Mainland $661,200 186.4 2.1% 5.8% 9.5% 16.4% 22.7% 29.3% 68.7%
Greater Vancouver $752,500 196.9 2.2% 6.2% 9.9% 17.8% 25.9% 33.0% 77.7%
Bowen Island $634,200 137.5 -1.6% 0.7% 5.6% 9.0% 10.5% 2.9% 23.4%
Burnaby East $702,500 193.9 2.7% 4.6% 9.4% 16.0% 27.5% 34.3% 75.0%
Burnaby North $631,900 189.9 1.1% 5.1% 9.5% 17.4% 25.8% 32.2% 72.6%
Burnaby South $695,200 196.5 1.1% 6.3% 9.0% 16.3% 23.3% 32.9% 77.5%
Coquitlam $635,500 188.0 1.9% 6.7% 10.3% 18.5% 26.9% 34.6% 72.2%
Ladner $669,400 186.2 2.4% 4.4% 11.2% 19.7% 30.1% 32.0% 70.8%
Maple Ridge $439,800 148.6 1.6% 3.8% 7.1% 11.0% 13.1% 13.0% 38.9%
New Westminster $437,700 186.4 2.4% 6.0% 10.4% 14.5% 21.0% 24.9% 67.0%
North Vancouver $808,400 182.4 3.5% 7.0% 8.1% 17.1% 26.1% 32.5% 66.6%
Pitt Meadows $430,900 157.7 1.3% 0.6% 1.9% 7.1% 12.2% 19.0% 47.0%
Port Coquitlam $476,600 168.9 1.1% 4.5% 7.6% 14.8% 20.2% 22.3% 54.0%
Port Moody $638,700 176.6 2.0% 6.1% 10.0% 17.1% 24.8% 28.4% 58.8%
Richmond $706,500 204.7 1.5% 6.3% 10.3% 18.5% 23.7% 29.3% 85.9%
Squamish $470,400 153.3 1.6% 4.6% 4.8% 12.3% 23.2% 19.9% 43.1%
Sunshine Coast $385,900 135.2 0.9% 1.7% 5.0% 9.6% 9.3% 6.0% 19.4%
Tsawwassen $775,600 194.3 2.7% 5.0% 12.8% 23.8% 30.6% 41.9% 75.7%
Vancouver East $795,500 233.0 2.9% 7.5% 12.3% 20.8% 31.6% 46.9% 106.9%
Vancouver West $1,034,900 218.1 3.0% 7.1% 11.2% 19.2% 31.1% 40.2% 92.8%
West Vancouver $2,103,200 225.7 2.8% 5.7% 11.3% 25.7% 40.1% 61.1% 104.1%
Whistler $530,700 123.3 -0.9% 2.7% 1.4% 6.3% 17.3% 9.7% 15.8%
Single Family Detached Lower Mainland $969,400 205.9 2.1% 5.4% 10.3% 19.8% 29.3% 41.7% 88.2%
Greater Vancouver $1,226,300 226.2 2.4% 5.8% 11.0% 22.6% 33.8% 48.7% 106.8%
Bowen Island $634,200 137.5 -1.6% 0.7% 5.6% 9.0% 10.5% 2.9% 23.4%
Burnaby East $987,900 220.9 3.0% 5.0% 13.1% 22.4% 37.4% 49.3% 99.7%
Burnaby North $1,243,600 240.5 0.7% 4.3% 11.1% 26.3% 36.9% 56.0% 119.2%
Burnaby South $1,261,600 241.5 1.5% 4.6% 8.6% 21.3% 28.9% 56.8% 118.8%
Coquitlam $938,300 207.9 1.7% 5.6% 11.0% 21.9% 33.1% 47.0% 91.8%
Ladner $825,500 199.2 4.1% 7.9% 15.7% 27.0% 39.5% 43.3% 82.4%
Maple Ridge $538,800 153.5 1.7% 3.9% 7.9% 12.2% 17.6% 19.1% 44.5%
New Westminster $861,000 213.6 2.9% 5.2% 12.1% 20.9% 33.4% 42.5% 94.2%
North Vancouver $1,279,600 203.7 3.9% 7.7% 9.6% 23.4% 37.2% 49.3% 88.3%
Pitt Meadows $592,000 166.9 1.5% 3.3% 6.9% 13.2% 18.5% 23.9% 56.9%
Port Coquitlam $719,800 192.0 1.4% 5.8% 11.3% 23.3% 29.8% 37.1% 77.1%
Port Moody $1,093,800 202.0 1.4% 6.4% 10.3% 18.7% 30.8% 44.3% 84.3%
Richmond $1,266,400 254.0 2.0% 6.8% 12.3% 24.0% 31.9% 47.0% 130.3%
Squamish $630,200 167.5 1.6% 3.8% 6.1% 16.1% 28.5% 33.7% 53.5%
Sunshine Coast $383,900 134.5 1.0% 1.7% 5.1% 9.5% 9.0% 5.5% 18.8%
Tsawwassen $993,400 213.9 4.1% 8.7% 17.1% 31.4% 39.5% 57.7% 92.2%
Vancouver East $1,208,800 267.2 2.8% 6.4% 12.9% 26.4% 44.8% 69.4% 142.5%
Vancouver West $2,864,600 294.1 3.3% 6.3% 12.1% 23.2% 41.0% 60.4% 167.9%
West Vancouver $2,519,200 239.5 2.7% 5.2% 10.0% 26.1% 42.0% 69.0% 116.7%
Whistler $1,056,200 146.2 -0.4% 0.8% 3.2% 11.0% 20.4% 20.4% 36.5%
HOW TO READ THE TABLE:
• Benchmark Price: Estimated sale price of a benchmark property. Benchmarks represent a typical property within each market.
• Price Index: Index numbers estimate the percentage change in price on typical and constant quality properties over time. All figures are based on past sales.
• x Month/Year Change %: Percentage change of index over a period of x month(s)/year(s) *
In January 2005, the indexes are set to 100.
Townhome properties are similar to Attached properties, a category that was used in the previous MLSLink HPI, but do not included duplexes.
The above info is deemed reliable, but is not guaranteed. All dollar amounts in CDN.
November 2015*
* MLS®, Multiple Listing Service®, and all related graphics are trademarks of The Canadian Real Estate Association 1 of 14
Property Type Area
Benchmark
Price
Price
Index
1 Month
Change %
3 Month
Change %
6 Month
Change %
1 Year
Change %
3 Year
Change %
5 Year
Change %
10 Year
Change %
November 2015*
Townhouse Lower Mainland $441,500 159.8 1.8% 4.4% 6.3% 9.5% 13.1% 14.2% 46.7%
Greater Vancouver $536,600 173.4 1.9% 4.9% 7.1% 11.3% 17.6% 19.9% 58.6%
Burnaby East $429,900 154.2 -2.1% -3.4% -2.6% 0.5% 3.8% 8.5% 41.9%
Burnaby North $435,500 162.4 -0.5% 0.1% 1.0% 5.8% 13.0% 11.6% 48.7%
Burnaby South $454,600 163.1 -0.5% 3.1% 4.9% 6.7% 9.3% 13.3% 51.4%
Coquitlam $448,300 164.7 0.7% 6.7% 8.6% 11.6% 15.4% 23.8% 49.9%
Ladner $511,800 169.6 -0.4% 1.3% 4.8% 10.3% 17.8% 15.0% 56.2%
Maple Ridge $308,800 150.0 1.6% 6.6% 10.9% 13.2% 14.1% 7.7% 38.0%
New Westminster $433,700 162.9 -1.5% -1.0% -0.1% 2.5% 13.0% 13.1% 50.8%
North Vancouver $686,900 164.4 2.5% 4.8% 8.4% 12.1% 19.3% 21.9% 50.7%
Pitt Meadows $368,900 159.6 1.1% 0.3% 2.6% 8.4% 11.1% 25.4% 48.7%
Port Coquitlam $415,300 157.5 -0.3% 2.9% 4.0% 8.0% 12.0% 14.1% 42.5%
Port Moody $493,300 166.7 3.0% 7.9% 11.4% 14.0% 19.3% 20.2% 50.6%
Richmond $585,900 189.4 2.1% 5.5% 8.5% 13.6% 19.0% 22.3% 73.9%
Squamish $391,300 142.0 2.6% 3.5% 3.0% 7.2% 19.2% 14.1% 38.4%
Tsawwassen $501,400 165.7 -0.7% 1.7% 4.3% 12.7% 15.9% 11.1% 52.6%
Vancouver East $626,400 206.5 3.9% 10.6% 11.7% 17.1% 25.4% 31.4% 78.9%
Vancouver West $866,500 196.0 4.3% 6.8% 9.3% 12.4% 27.6% 30.8% 78.2%
Whistler $533,600 142.7 2.6% 3.0% 2.4% 6.9% 20.6% 23.8% 38.7%
Apartment Lower Mainland $391,200 170.8 2.2% 7.5% 9.5% 13.6% 16.3% 18.0% 51.4%
Greater Vancouver $435,000 174.9 2.2% 7.3% 9.6% 14.0% 18.7% 20.2% 55.2%
Burnaby East $507,100 192.5 7.7% 14.4% 16.0% 19.4% 41.9% 40.3% 66.8%
Burnaby North $389,700 164.7 2.0% 7.6% 10.4% 12.2% 18.9% 20.4% 49.0%
Burnaby South $448,600 180.1 1.2% 8.6% 10.2% 14.8% 22.0% 23.8% 60.8%
Coquitlam $299,900 165.1 2.8% 9.2% 9.8% 15.5% 19.5% 17.8% 49.8%
Ladner $330,000 156.4 -2.1% -6.4% 0.3% 2.8% 9.2% 10.4% 43.9%
Maple Ridge $166,200 120.0 0.9% -1.9% -4.4% -1.4% -12.0% -9.0% 10.0%
New Westminster $314,300 179.0 2.5% 7.3% 11.0% 13.3% 17.0% 19.6% 59.1%
North Vancouver $392,900 159.9 3.0% 7.5% 6.2% 10.0% 12.9% 14.3% 44.3%
Pitt Meadows $245,000 144.8 1.3% -3.0% -5.1% -1.4% 5.3% 7.7% 32.7%
Port Coquitlam $249,600 148.0 1.9% 4.5% 5.8% 8.6% 13.5% 9.1% 33.5%
Port Moody $384,200 160.1 2.1% 4.6% 8.5% 16.4% 19.8% 18.8% 40.9%
Richmond $383,000 161.7 0.4% 6.0% 7.1% 11.4% 12.3% 9.3% 46.1%
Squamish $293,600 141.4 0.2% 8.5% 6.8% 11.7% 21.9% 2.3% 31.8%
Tsawwassen $337,200 142.2 -1.9% -7.2% -0.8% 2.2% 5.3% 2.2% 30.8%
Vancouver East $360,900 199.1 3.0% 8.9% 12.0% 13.9% 17.0% 23.4% 72.2%
Vancouver West $586,100 189.7 2.7% 8.1% 11.5% 17.8% 25.1% 29.4% 65.4%
West Vancouver $750,200 163.9 3.6% 9.0% 21.1% 19.5% 27.1% 22.9% 48.3%
Whistler $274,500 90.0 -6.3% 3.8% 0.1% 4.0% 21.1% -9.9% -17.6%
HOW TO READ THE TABLE:
• Benchmark Price: Estimated sale price of a benchmark property. Benchmarks represent a typical property within each market.
• Price Index: Index numbers estimate the percentage change in price on typical and constant quality properties over time. All figures are based on past sales.
• x Month/Year Change %: Percentage change of index over a period of x month(s)/year(s)
In January 2005, the indexes are set to 100. *
Townhome properties are similar to attached properties, a category that was used in the previous MLSLink HPI, but do not included duplexes.
Lower Mainland includes areas serviced by both Real Estate Board of Greater Vancouver & Fraser Valley Real Estate Board.
The above info is deemed reliable, but is not guaranteed. All dollar amounts in CDN.
* MLS®, Multiple Listing Service®, and all related graphics are trademarks of The Canadian Real Estate Association 2 of 14
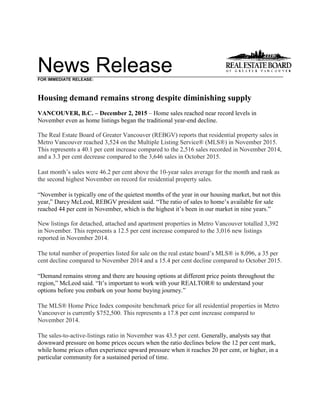
C:DATAMonthEndHpiexporthi_resgv-hpi2.tifGreaterVancouver
5YearTrend
60
80
100
120
140
160
180
200
220
240
Oct 2010
Dec 2010
Feb 2011
Apr 2011
Jun 2011
Aug 2011
Oct 2011
Dec 2011
Feb 2012
Apr 2012
Jun 2012
Aug 2012
Oct 2012
Dec 2012
Feb 2013
Apr 2013
Jun 2013
Aug 2013
Oct 2013
Dec 2013
Feb 2014
Apr 2014
Jun 2014
Aug 2014
Oct 2014
Dec 2014
Feb 2015
Apr 2015
Jun 2015
Aug 2015
Oct 2015
Price
Index
ResidentialDetachedTownhouseApartment
Jan2005HPI=100
11222015MLS®
SALESFacts
Burnaby
Coquitlam
Delta-South
Islands-Gulf
MapleRidge/PittMeadows
NewWestminster
NorthVancouver
PortCoquitlam
PortMoody/Belcarra
Richmond
Squamish
SunshineCoast
VancouverEast
VancouverWest
WestVancouver/HoweSound
Whistler/Pemberton
Detached116108543145361024120192357414416582181,335
Attached85504077153834321102474768837636
Apartment2251081804010913440221988714045816301,553
Detached$1,405,000$1,044,000$1,032,500n/a$585,100$931,500$1,500,000$719,800$982,500$1,350,000$730,000$386,500$1,310,000$3,100,000$2,720,000n/a
Attached$579,950$590,750n/an/a$315,000n/a$718,700$449,900$514,900$616,600$489,450n/a$800,450$961,900n/a$580,000n/a
Apartment$419,500$321,000n/an/a$230,000$297,000$409,450$266,000$385,000$369,900n/an/a$372,500$585,000n/a$309,000
Detached1281135841592513046421942761149163116221,437
Attached94549081113632171322885278925666
Apartment22310433020117123423616119515445720291,543
Detached$1,305,000$950,000$981,750n/a$572,250$922,500$1,448,800$700,000$1,155,000$1,369,000$698,000$455,000$1,288,000$2,910,000$2,700,000$898,500
Attached$575,000$623,000n/an/a$325,000n/a$822,500$414,500n/a$620,000$454,500n/a$799,900$1,049,900n/a$550,000n/a
Apartment$400,000$343,500$400,000n/a$225,450$332,000$399,900$261,500$415,000$365,500n/an/a$410,000$569,900$688,000$299,500
Detached8610649712224742817129183812211765101,012
Attached6139603713393417731854543319452
Apartment1285611037687636141267511733211281,052
Detached$1,050,000$837,500$739,500n/a$515,220$699,750$1,079,000$583,750n/a$1,086,000n/a$412,500$960,500$2,648,000$1,875,000n/a
Attached$538,000$468,000n/an/a$301,841n/a$668,151$368,950n/a$532,800n/an/a$657,000$788,250n/an/an/a
Apartment$379,000$292,250n/an/a$201,900$286,700$437,500$244,200n/a$350,000n/an/a$345,000$495,000n/a$287,500
Detached1,4941,489657481,6943591,4035533142,1873297001,8211,8981,00319016,139
Attached99056510207051534933631991,231229755378411042926,879
Apartment2,2291,10224703541,0281,2364863131,905155771,7365,12619629116,481
Detached$1,250,500$899,950$875,000$375,000$552,285$836,500$1,315,000$670,000$980,500$1,250,000$665,000$410,000$1,215,000$2,820,000$2,432,000$1,107,500
Attached$539,900$524,900$501,250n/a$318,950$460,000$693,900$420,000$452,150$578,000$429,900$270,000$738,000$958,000$1,230,000$566,750n/a
Apartment$395,000$324,900$367,250n/a$214,950$309,000$405,000$248,750$385,000$357,000$265,000$270,000$379,950$532,500$773,000$284,000
Detached1,1001,268589461,2773281,1714522771,5852575381,6551,68477715613,160
Attached712463800440933703272121,00616740477615692665,337
Apartment1,67072416403327458413342741,38498671,3174,12517225612,503
Detached$1,020,000$775,000$701,100$383,500$495,327$705,000$1,075,000$570,000$872,500$1,038,000$545,000$380,000$965,000$2,380,000$2,100,000$1,050,000
Attached$517,500$480,000$438,500n/a$302,000$429,950$659,500$389,000$437,400$535,000$366,846$239,900$655,000$871,000$1,035,000$575,000n/a
Apartment$375,000$297,000$340,000n/a$214,900$306,500$384,000$242,000$358,000$350,000$216,250$249,500$345,000$492,000$748,000$256,500
Note:MedianSellingPricesarenotreportedforareaswithlessthan20salesorfortheGulfIslands
Median
Selling
Price
Number
of
Sales
Median
Selling
Price
October
2015
November
2014
Jan.-
Nov.2015
Jan.-
Nov.2014
Median
Selling
Price
Number
of
Sales
Median
Selling
Price
Number
of
Sales
November
2015
Number
of
Sales
Median
Selling
Price
Number
of
Sales
November
2015
Year-to-date
Year-to-date
11222015MLS®
LISTINGSFacts
Burnaby
Coquitlam
Delta-South
Islands-Gulf
MapleRidge/PittMeadows
NewWestminster
NorthVancouver
PortCoquitlam
PortMoody/Belcarra
Richmond
Squamish
SunshineCoast
VancouverEast
VancouverWest
WestVancouver/HoweSound
Whistler/Pemberton
Detached1011064711222410845211783262153166106191,291
Attached7350404513512719932073763642550
Apartment2071231404386107532925611614441021411,551
Detached115%102%115%300%119%150%94%91%95%108%109%119%94%99%77%95%
Attached116%100%100%n/a171%115%75%126%168%118%120%100%127%108%133%88%n/a
Apartment109%88%129%n/a93%127%125%75%76%77%73%117%97%112%76%73%
Detached1591154991514010242271943462179215153181,549
Attached1043580651756322713835116293926718
Apartment298136240341261286327248151216052329361,859
Detached81%98%118%44%105%63%127%110%156%100%79%98%83%76%76%122%
Attached90%154%113%n/a125%65%64%100%63%96%80%73%84%84%100%96%n/a
Apartment75%76%138%n/a59%93%96%67%133%65%127%42%96%87%69%81%
Detached1068740312122663231145245610313080131,059
Attached633611043183443109818444551027514
Apartment17594904791113532420212717240315261,443
Detached81%122%123%233%101%109%112%88%55%89%75%68%118%90%81%77%
Attached97%108%55%n/a86%72%115%79%170%74%100%125%102%78%30%70%n/a
Apartment73%60%122%n/a79%75%67%68%58%62%58%71%68%82%73%108%
Detached2,1081,886739992,0464321,7846554332,9983951,0662,5553,0681,93731022,511
Attached1,25369111328412085964542261,5122771206671,1811283618,630
Apartment3,2531,65530106191,5581,7407774193,3051841162,3277,07934141324,087
Detached71%79%89%48%83%83%79%84%73%73%83%66%71%62%52%61%
Attached79%82%90%0%84%74%83%80%88%81%83%63%81%71%81%81%n/a
Apartment69%67%82%n/a57%66%71%63%75%58%84%66%75%72%57%70%
Detached2,0901,8508291352,1134751,7595704352,8663971,1972,4033,1581,68929922,265
Attached1,17167411227271715704782651,592220987381,1321393578,446
Apartment2,9521,43625906161,5111,8167504143,0841531462,3817,21134739123,467
Detached53%69%71%34%60%69%67%79%64%55%65%45%69%53%46%52%
Attached61%69%71%0%61%54%65%68%80%63%76%41%65%54%50%75%n/a
Apartment57%50%63%n/a54%49%46%45%66%45%64%46%55%57%50%65%
*Year-to-datelistingsrepresentacumulativetotaloflistingsratherthantotalactivelistings.
Number
of
Listings
November
2015
Number
of
Listings
%Salesto
Listings
Number
of
Listings
%Salesto
Listings
Number
of
Listings
%Salesto
Listings
October
2015
November
2014
Jan.-
Nov.2015
Jan.-
Nov.2014
%Salesto
Listings
Number
of
Listings
%Salesto
Listings
November
2015
Year-to-date*
Year-to-date*
Listing & Sales Activity Summary
Listings Sales
1 2 3 Col. 2 & 3 5 6 7 Col. 6 & 7 9 10 Col. 9 & 10
Nov Oct Nov Percentage Nov Oct Nov Percentage Sep 2014 - Sep 2015 - Percentage
2014 2015 2015 Variance 2014 2015 2015 Variance Nov 2014 Nov 2015 Variance
BURNABY % % %
DETACHED 106 159 101 -36.5 86 128 116 -9.4 304 330 8.6
ATTACHED 63 104 73 -29.8 61 94 85 -9.6 178 256 43.8
APARTMENTS 175 298 207 -30.5 128 223 225 0.9 461 669 45.1
COQUITLAM
DETACHED 87 115 106 -7.8 106 113 108 -4.4 347 347 0.0
ATTACHED 36 35 50 42.9 39 54 50 -7.4 109 152 39.4
APARTMENTS 94 136 123 -9.6 56 104 108 3.8 200 326 63.0
DELTA
DETACHED 40 49 47 -4.1 49 58 54 -6.9 168 170 1.2
ATTACHED 11 8 4 -50.0 6 9 4 -55.6 28 19 -32.1
APARTMENTS 9 24 14 -41.7 11 33 18 -45.5 43 72 67.4
MAPLE RIDGE/PITT MEADOWS
DETACHED 121 151 122 -19.2 122 159 145 -8.8 361 458 26.9
ATTACHED 43 65 45 -30.8 37 81 77 -4.9 108 227 110.2
APARTMENTS 47 34 43 26.5 37 20 40 100.0 92 99 7.6
NORTH VANCOUVER
DETACHED 66 102 108 5.9 74 130 102 -21.5 257 339 31.9
ATTACHED 34 56 51 -8.9 39 36 38 5.6 102 111 8.8
APARTMENTS 113 128 107 -16.4 76 123 134 8.9 242 368 52.1
NEW WESTMINSTER
DETACHED 22 40 24 -40.0 24 25 36 44.0 86 91 5.8
ATTACHED 18 17 13 -23.5 13 11 15 36.4 27 45 66.7
APARTMENTS 91 126 86 -31.7 68 117 109 -6.8 203 306 50.7
PORT MOODY/BELCARRA
DETACHED 31 27 21 -22.2 17 42 20 -52.4 91 81 -11.0
ATTACHED 10 27 19 -29.6 17 17 32 88.2 44 60 36.4
APARTMENTS 24 27 29 7.4 14 36 22 -38.9 80 95 18.8
PORT COQUITLAM
DETACHED 32 42 45 7.1 28 46 41 -10.9 106 129 21.7
ATTACHED 43 32 27 -15.6 34 32 34 6.3 92 97 5.4
APARTMENTS 53 63 53 -15.9 36 42 40 -4.8 97 119 22.7
RICHMOND
DETACHED 145 194 178 -8.2 129 194 192 -1.0 446 562 26.0
ATTACHED 98 138 93 -32.6 73 132 110 -16.7 286 326 14.0
APARTMENTS 202 248 256 3.2 126 161 198 23.0 384 553 44.0
SUNSHINE COAST
DETACHED 56 62 62 0.0 38 61 74 21.3 162 212 30.9
ATTACHED 4 11 7 -36.4 5 8 7 -12.5 9 19 111.1
APARTMENTS 7 12 6 -50.0 5 5 7 40.0 17 21 23.5
SQUAMISH
DETACHED 24 34 32 -5.9 18 27 35 29.6 69 95 37.7
ATTACHED 18 35 20 -42.9 18 28 24 -14.3 62 67 8.1
APARTMENTS 12 15 11 -26.7 7 19 8 -57.9 30 46 53.3
VANCOUVER EAST
DETACHED 103 179 153 -14.5 122 149 144 -3.4 431 437 1.4
ATTACHED 44 62 37 -40.3 45 52 47 -9.6 129 147 14.0
APARTMENTS 172 160 144 -10.0 117 154 140 -9.1 333 451 35.4
VANCOUVER WEST
DETACHED 130 215 166 -22.8 117 163 165 1.2 443 453 2.3
ATTACHED 55 93 63 -32.3 43 78 68 -12.8 166 197 18.7
APARTMENTS 403 523 410 -21.6 332 457 458 0.2 1180 1348 14.2
WHISTLER/PEMBERTON
DETACHED 13 18 19 5.6 10 22 18 -18.2 53 63 18.9
ATTACHED 27 26 42 61.5 19 25 37 48.0 76 98 28.9
APARTMENTS 26 36 41 13.9 28 29 30 3.4 92 91 -1.1
WEST VANCOUVER/HOWE SOUND
DETACHED 80 153 106 -30.7 65 116 82 -29.3 216 265 22.7
ATTACHED 10 9 6 -33.3 3 9 8 -11.1 18 25 38.9
APARTMENTS 15 29 21 -27.6 11 20 16 -20.0 54 61 13.0
GRAND TOTALS
DETACHED 1056 1540 1290 -16.2 1005 1433 1332 -7.0 3540 4032 13.9
ATTACHED 514 718 550 -23.4 452 666 636 -4.5 1434 1846 28.7
APARTMENTS 1443 1859 1551 -16.6 1052 1543 1553 0.6 3508 4625 31.8
ResidentialAverageSalePrices-January1977toNovember2015
0
200
400
600
800
1000
1200
1400
1600
1800
197719781979198019811982198319841985198619871988198919901991199219931994199519961997199819992000200120022003200420052006200720082009201020112012201320142015
DETACHEDCONDOMINIUMATTACHEDAPARTMENTS
INTHOUSANDS($)
NOTE:From1977-1984condominiumaverageswerenotseparatedintoattached&apartment.
$630,018
$500,084
$1,579,170

Weitere ähnliche Inhalte

Was ist angesagt?

REBGV September 2016 Stats Package Mike Stewart Vancouver Realtor
REBGV September 2016 Stats Package Mike Stewart Vancouver RealtorREBGV September 2016 Stats Package Mike Stewart Vancouver Realtor
REBGV September 2016 Stats Package Mike Stewart Vancouver RealtorMike Stewart
 
October 2016 REBGV Statistics Package Vancouver BC Mike Stewart Realtor
October 2016 REBGV Statistics Package Vancouver BC Mike Stewart RealtorOctober 2016 REBGV Statistics Package Vancouver BC Mike Stewart Realtor
October 2016 REBGV Statistics Package Vancouver BC Mike Stewart RealtorMike Stewart
 
January 2017 Rebgv Statistics Package Mike Stewart Vancouver Realtor
January 2017 Rebgv Statistics Package Mike Stewart Vancouver RealtorJanuary 2017 Rebgv Statistics Package Mike Stewart Vancouver Realtor
January 2017 Rebgv Statistics Package Mike Stewart Vancouver RealtorMike Stewart
 
December 2016 rebgv statistics package mike stewart vancouver realtor
December 2016 rebgv statistics package mike stewart vancouver realtorDecember 2016 rebgv statistics package mike stewart vancouver realtor
December 2016 rebgv statistics package mike stewart vancouver realtorMike Stewart
 
March 2017 Rebgv Stats Package Mike Stewart
March 2017 Rebgv Stats Package Mike StewartMarch 2017 Rebgv Stats Package Mike Stewart
March 2017 Rebgv Stats Package Mike StewartMike Stewart
 
February 2017 REBGV Statistics Package Mike Stewart Realtor
February 2017 REBGV Statistics Package Mike Stewart RealtorFebruary 2017 REBGV Statistics Package Mike Stewart Realtor
February 2017 REBGV Statistics Package Mike Stewart RealtorMike Stewart
 
May 2017 REBGV Stats
May 2017 REBGV Stats May 2017 REBGV Stats
May 2017 REBGV Stats Mike Stewart
 
April 2017 Real Estate Board of Greater Vancouver Statistics Package with Charts
April 2017 Real Estate Board of Greater Vancouver Statistics Package with ChartsApril 2017 Real Estate Board of Greater Vancouver Statistics Package with Charts
April 2017 Real Estate Board of Greater Vancouver Statistics Package with ChartsMike Stewart
 
Real Estate Board of Greater Vancouver Statistics Package October 2021
Real Estate Board of Greater Vancouver Statistics Package October 2021Real Estate Board of Greater Vancouver Statistics Package October 2021
Real Estate Board of Greater Vancouver Statistics Package October 2021VickyAulakh1
 
Metro Vancouver Statistics Report October 2021
Metro Vancouver Statistics Report October 2021Metro Vancouver Statistics Report October 2021
Metro Vancouver Statistics Report October 2021VickyAulakh1
 
August 2017 REBGV Stats Mike Stewart Realtor
August 2017 REBGV Stats Mike Stewart RealtorAugust 2017 REBGV Stats Mike Stewart Realtor
August 2017 REBGV Stats Mike Stewart RealtorMike Stewart
 
Rebgv stats-pkg-november-2019-f
Rebgv stats-pkg-november-2019-fRebgv stats-pkg-november-2019-f
Rebgv stats-pkg-november-2019-fVicky Aulakh
 
REBGV STATS PACKAGE JULY 2017
REBGV STATS PACKAGE JULY 2017REBGV STATS PACKAGE JULY 2017
REBGV STATS PACKAGE JULY 2017Marcella Riccardi
 
REBGV Statistics Package June 2020
REBGV Statistics Package June 2020REBGV Statistics Package June 2020
REBGV Statistics Package June 2020Vicky Aulakh
 
REBGV Statistics Package April 2021
REBGV Statistics Package April 2021REBGV Statistics Package April 2021
REBGV Statistics Package April 2021Vicky Aulakh
 
Rebgv stats-pkg-december-2019
Rebgv stats-pkg-december-2019Rebgv stats-pkg-december-2019
Rebgv stats-pkg-december-2019Vicky Aulakh
 
Rebgv stats-pkg-february-2019
Rebgv stats-pkg-february-2019Rebgv stats-pkg-february-2019
Rebgv stats-pkg-february-2019Kathryn Huang
 
REBGV January 2020 Statistics Package
REBGV January 2020 Statistics Package REBGV January 2020 Statistics Package
REBGV January 2020 Statistics Package Vicky Aulakh
 
Rebgv stats-pkg-july-2019
Rebgv stats-pkg-july-2019Rebgv stats-pkg-july-2019
Rebgv stats-pkg-july-2019Vicky Aulakh
 
June 2017 REBGV Statistics Package
June 2017 REBGV Statistics PackageJune 2017 REBGV Statistics Package
June 2017 REBGV Statistics PackageMike Stewart
 

Was ist angesagt? (20)

REBGV September 2016 Stats Package Mike Stewart Vancouver Realtor
REBGV September 2016 Stats Package Mike Stewart Vancouver RealtorREBGV September 2016 Stats Package Mike Stewart Vancouver Realtor
REBGV September 2016 Stats Package Mike Stewart Vancouver Realtor
 
October 2016 REBGV Statistics Package Vancouver BC Mike Stewart Realtor
October 2016 REBGV Statistics Package Vancouver BC Mike Stewart RealtorOctober 2016 REBGV Statistics Package Vancouver BC Mike Stewart Realtor
October 2016 REBGV Statistics Package Vancouver BC Mike Stewart Realtor
 
January 2017 Rebgv Statistics Package Mike Stewart Vancouver Realtor
January 2017 Rebgv Statistics Package Mike Stewart Vancouver RealtorJanuary 2017 Rebgv Statistics Package Mike Stewart Vancouver Realtor
January 2017 Rebgv Statistics Package Mike Stewart Vancouver Realtor
 
December 2016 rebgv statistics package mike stewart vancouver realtor
December 2016 rebgv statistics package mike stewart vancouver realtorDecember 2016 rebgv statistics package mike stewart vancouver realtor
December 2016 rebgv statistics package mike stewart vancouver realtor
 
March 2017 Rebgv Stats Package Mike Stewart
March 2017 Rebgv Stats Package Mike StewartMarch 2017 Rebgv Stats Package Mike Stewart
March 2017 Rebgv Stats Package Mike Stewart
 
February 2017 REBGV Statistics Package Mike Stewart Realtor
February 2017 REBGV Statistics Package Mike Stewart RealtorFebruary 2017 REBGV Statistics Package Mike Stewart Realtor
February 2017 REBGV Statistics Package Mike Stewart Realtor
 
May 2017 REBGV Stats
May 2017 REBGV Stats May 2017 REBGV Stats
May 2017 REBGV Stats
 
April 2017 Real Estate Board of Greater Vancouver Statistics Package with Charts
April 2017 Real Estate Board of Greater Vancouver Statistics Package with ChartsApril 2017 Real Estate Board of Greater Vancouver Statistics Package with Charts
April 2017 Real Estate Board of Greater Vancouver Statistics Package with Charts
 
Real Estate Board of Greater Vancouver Statistics Package October 2021
Real Estate Board of Greater Vancouver Statistics Package October 2021Real Estate Board of Greater Vancouver Statistics Package October 2021
Real Estate Board of Greater Vancouver Statistics Package October 2021
 
Metro Vancouver Statistics Report October 2021
Metro Vancouver Statistics Report October 2021Metro Vancouver Statistics Report October 2021
Metro Vancouver Statistics Report October 2021
 
August 2017 REBGV Stats Mike Stewart Realtor
August 2017 REBGV Stats Mike Stewart RealtorAugust 2017 REBGV Stats Mike Stewart Realtor
August 2017 REBGV Stats Mike Stewart Realtor
 
Rebgv stats-pkg-november-2019-f
Rebgv stats-pkg-november-2019-fRebgv stats-pkg-november-2019-f
Rebgv stats-pkg-november-2019-f
 
REBGV STATS PACKAGE JULY 2017
REBGV STATS PACKAGE JULY 2017REBGV STATS PACKAGE JULY 2017
REBGV STATS PACKAGE JULY 2017
 
REBGV Statistics Package June 2020
REBGV Statistics Package June 2020REBGV Statistics Package June 2020
REBGV Statistics Package June 2020
 
REBGV Statistics Package April 2021
REBGV Statistics Package April 2021REBGV Statistics Package April 2021
REBGV Statistics Package April 2021
 
Rebgv stats-pkg-december-2019
Rebgv stats-pkg-december-2019Rebgv stats-pkg-december-2019
Rebgv stats-pkg-december-2019
 
Rebgv stats-pkg-february-2019
Rebgv stats-pkg-february-2019Rebgv stats-pkg-february-2019
Rebgv stats-pkg-february-2019
 
REBGV January 2020 Statistics Package
REBGV January 2020 Statistics Package REBGV January 2020 Statistics Package
REBGV January 2020 Statistics Package
 
Rebgv stats-pkg-july-2019
Rebgv stats-pkg-july-2019Rebgv stats-pkg-july-2019
Rebgv stats-pkg-july-2019
 
June 2017 REBGV Statistics Package
June 2017 REBGV Statistics PackageJune 2017 REBGV Statistics Package
June 2017 REBGV Statistics Package
 

Ähnlich wie REBGV November 2015 Statistics Package Mike Stewart Realtor

REBGV Statistics package July 2020
REBGV Statistics package July 2020REBGV Statistics package July 2020
REBGV Statistics package July 2020Vicky Aulakh
 
REBGV-Stats-Pkg-April-2022.pdf
REBGV-Stats-Pkg-April-2022.pdfREBGV-Stats-Pkg-April-2022.pdf
REBGV-Stats-Pkg-April-2022.pdfVicky Aulakh
 
November 2017 rebgv stats mike stewart real estate agent
November 2017 rebgv stats mike stewart real estate agentNovember 2017 rebgv stats mike stewart real estate agent
November 2017 rebgv stats mike stewart real estate agentMike Stewart
 
Real Estate Board of Greater Vancouver Statistics Package January 2021
Real Estate Board of Greater Vancouver Statistics Package January 2021 Real Estate Board of Greater Vancouver Statistics Package January 2021
Real Estate Board of Greater Vancouver Statistics Package January 2021 Vicky Aulakh
 
201807 rebgv-stats-package-for-media
201807 rebgv-stats-package-for-media201807 rebgv-stats-package-for-media
201807 rebgv-stats-package-for-mediaKathryn Huang
 
Rebgv stats-pkg-may-2018
Rebgv stats-pkg-may-2018Rebgv stats-pkg-may-2018
Rebgv stats-pkg-may-2018Kathryn Huang
 
Rebgv stats-pkg-february-2020
Rebgv stats-pkg-february-2020Rebgv stats-pkg-february-2020
Rebgv stats-pkg-february-2020Vicky Aulakh
 
Rebgv stats-pkg-august-2018
Rebgv stats-pkg-august-2018Rebgv stats-pkg-august-2018
Rebgv stats-pkg-august-2018Kathryn Huang
 
Real Estate Board of Greater Vancouver Statistics Package - November 2021
Real Estate Board of Greater Vancouver Statistics Package - November 2021Real Estate Board of Greater Vancouver Statistics Package - November 2021
Real Estate Board of Greater Vancouver Statistics Package - November 2021VickyAulakh1
 
Rebgv stats-pkg-june-2018
Rebgv stats-pkg-june-2018Rebgv stats-pkg-june-2018
Rebgv stats-pkg-june-2018Kathryn Huang
 
REBGV Statistics Package November 2022
REBGV Statistics Package November 2022REBGV Statistics Package November 2022
REBGV Statistics Package November 2022VickyAulakh1
 
REBGV Statistics Package October 2020
REBGV Statistics Package October 2020REBGV Statistics Package October 2020
REBGV Statistics Package October 2020Vicky Aulakh
 
REBGV-Stats-Pkg-July-2022
REBGV-Stats-Pkg-July-2022REBGV-Stats-Pkg-July-2022
REBGV-Stats-Pkg-July-2022Vicky Aulakh
 
Real Estate Board of Greater Vancouver - Stats Package May 2021
Real Estate Board of Greater Vancouver - Stats Package May 2021Real Estate Board of Greater Vancouver - Stats Package May 2021
Real Estate Board of Greater Vancouver - Stats Package May 2021AlexanderMackenzie13
 
Rebgv stats-pkg-may-2021
Rebgv stats-pkg-may-2021Rebgv stats-pkg-may-2021
Rebgv stats-pkg-may-2021BC PRIME Realty
 
May 2021 Real Estate Board of Greater Vancouver Statistics Package
May 2021 Real Estate Board of Greater Vancouver Statistics PackageMay 2021 Real Estate Board of Greater Vancouver Statistics Package
May 2021 Real Estate Board of Greater Vancouver Statistics PackageVicky Aulakh
 
2017 Real Estate Board of Greater Vancouver Statistics Package with Charts & ...
2017 Real Estate Board of Greater Vancouver Statistics Package with Charts & ...2017 Real Estate Board of Greater Vancouver Statistics Package with Charts & ...
2017 Real Estate Board of Greater Vancouver Statistics Package with Charts & ...Kathryn Huang
 
Rebgv stats-pkg-april-2018
Rebgv stats-pkg-april-2018Rebgv stats-pkg-april-2018
Rebgv stats-pkg-april-2018Kathryn Huang
 

Ähnlich wie REBGV November 2015 Statistics Package Mike Stewart Realtor (19)

REBGV Statistics package July 2020
REBGV Statistics package July 2020REBGV Statistics package July 2020
REBGV Statistics package July 2020
 
REBGV-Stats-Pkg-April-2022.pdf
REBGV-Stats-Pkg-April-2022.pdfREBGV-Stats-Pkg-April-2022.pdf
REBGV-Stats-Pkg-April-2022.pdf
 
November 2017 rebgv stats mike stewart real estate agent
November 2017 rebgv stats mike stewart real estate agentNovember 2017 rebgv stats mike stewart real estate agent
November 2017 rebgv stats mike stewart real estate agent
 
Real Estate Board of Greater Vancouver Statistics Package January 2021
Real Estate Board of Greater Vancouver Statistics Package January 2021 Real Estate Board of Greater Vancouver Statistics Package January 2021
Real Estate Board of Greater Vancouver Statistics Package January 2021
 
201807 rebgv-stats-package-for-media
201807 rebgv-stats-package-for-media201807 rebgv-stats-package-for-media
201807 rebgv-stats-package-for-media
 
Rebgv stats-pkg-may-2018
Rebgv stats-pkg-may-2018Rebgv stats-pkg-may-2018
Rebgv stats-pkg-may-2018
 
Rebgv stats-pkg-february-2020
Rebgv stats-pkg-february-2020Rebgv stats-pkg-february-2020
Rebgv stats-pkg-february-2020
 
Rebgv stats-pkg-august-2018
Rebgv stats-pkg-august-2018Rebgv stats-pkg-august-2018
Rebgv stats-pkg-august-2018
 
Real Estate Board of Greater Vancouver Statistics Package - November 2021
Real Estate Board of Greater Vancouver Statistics Package - November 2021Real Estate Board of Greater Vancouver Statistics Package - November 2021
Real Estate Board of Greater Vancouver Statistics Package - November 2021
 
Rebgv stats-pkg-june-2018
Rebgv stats-pkg-june-2018Rebgv stats-pkg-june-2018
Rebgv stats-pkg-june-2018
 
REBGV Statistics Package November 2022
REBGV Statistics Package November 2022REBGV Statistics Package November 2022
REBGV Statistics Package November 2022
 
REBGV Statistics Package October 2020
REBGV Statistics Package October 2020REBGV Statistics Package October 2020
REBGV Statistics Package October 2020
 
Rebgv stats-pkg-october-2020
Rebgv stats-pkg-october-2020Rebgv stats-pkg-october-2020
Rebgv stats-pkg-october-2020
 
REBGV-Stats-Pkg-July-2022
REBGV-Stats-Pkg-July-2022REBGV-Stats-Pkg-July-2022
REBGV-Stats-Pkg-July-2022
 
Real Estate Board of Greater Vancouver - Stats Package May 2021
Real Estate Board of Greater Vancouver - Stats Package May 2021Real Estate Board of Greater Vancouver - Stats Package May 2021
Real Estate Board of Greater Vancouver - Stats Package May 2021
 
Rebgv stats-pkg-may-2021
Rebgv stats-pkg-may-2021Rebgv stats-pkg-may-2021
Rebgv stats-pkg-may-2021
 
May 2021 Real Estate Board of Greater Vancouver Statistics Package
May 2021 Real Estate Board of Greater Vancouver Statistics PackageMay 2021 Real Estate Board of Greater Vancouver Statistics Package
May 2021 Real Estate Board of Greater Vancouver Statistics Package
 
2017 Real Estate Board of Greater Vancouver Statistics Package with Charts & ...
2017 Real Estate Board of Greater Vancouver Statistics Package with Charts & ...2017 Real Estate Board of Greater Vancouver Statistics Package with Charts & ...
2017 Real Estate Board of Greater Vancouver Statistics Package with Charts & ...
 
Rebgv stats-pkg-april-2018
Rebgv stats-pkg-april-2018Rebgv stats-pkg-april-2018
Rebgv stats-pkg-april-2018
 

Mehr von Mike Stewart

1_FINTRAC_clientinfo_2021.pdf
1_FINTRAC_clientinfo_2021.pdf1_FINTRAC_clientinfo_2021.pdf
1_FINTRAC_clientinfo_2021.pdfMike Stewart
 
Mike Stewart PREC Listing Contract
Mike Stewart PREC Listing ContractMike Stewart PREC Listing Contract
Mike Stewart PREC Listing ContractMike Stewart
 
October 2017 REBGV Stats Mike Stewart Vancouver Realtor
October 2017 REBGV Stats Mike Stewart Vancouver RealtorOctober 2017 REBGV Stats Mike Stewart Vancouver Realtor
October 2017 REBGV Stats Mike Stewart Vancouver RealtorMike Stewart
 
September 2017 rebgv statistics package mike stewart realtor
September 2017 rebgv statistics package mike stewart realtorSeptember 2017 rebgv statistics package mike stewart realtor
September 2017 rebgv statistics package mike stewart realtorMike Stewart
 
July 2017 Real Estate Board of Greater Vancouver Stats Package Mike Stewart r...
July 2017 Real Estate Board of Greater Vancouver Stats Package Mike Stewart r...July 2017 Real Estate Board of Greater Vancouver Stats Package Mike Stewart r...
July 2017 Real Estate Board of Greater Vancouver Stats Package Mike Stewart r...Mike Stewart
 
15% tax on international buyers in vancouver
15% tax on international buyers in vancouver15% tax on international buyers in vancouver
15% tax on international buyers in vancouverMike Stewart
 
REBGV Stats for December 2011 Courtesy Mike Stewart Vancouver Realtor
REBGV Stats for December 2011 Courtesy Mike Stewart Vancouver RealtorREBGV Stats for December 2011 Courtesy Mike Stewart Vancouver Realtor
REBGV Stats for December 2011 Courtesy Mike Stewart Vancouver RealtorMike Stewart
 
October 2011 REBGV Stats Mike Stewart
October 2011 REBGV Stats Mike StewartOctober 2011 REBGV Stats Mike Stewart
October 2011 REBGV Stats Mike StewartMike Stewart
 
REBGV Stats for Sept 2011 Mike Stewart
REBGV Stats for Sept 2011 Mike StewartREBGV Stats for Sept 2011 Mike Stewart
REBGV Stats for Sept 2011 Mike StewartMike Stewart
 

Mehr von Mike Stewart (9)

1_FINTRAC_clientinfo_2021.pdf
1_FINTRAC_clientinfo_2021.pdf1_FINTRAC_clientinfo_2021.pdf
1_FINTRAC_clientinfo_2021.pdf
 
Mike Stewart PREC Listing Contract
Mike Stewart PREC Listing ContractMike Stewart PREC Listing Contract
Mike Stewart PREC Listing Contract
 
October 2017 REBGV Stats Mike Stewart Vancouver Realtor
October 2017 REBGV Stats Mike Stewart Vancouver RealtorOctober 2017 REBGV Stats Mike Stewart Vancouver Realtor
October 2017 REBGV Stats Mike Stewart Vancouver Realtor
 
September 2017 rebgv statistics package mike stewart realtor
September 2017 rebgv statistics package mike stewart realtorSeptember 2017 rebgv statistics package mike stewart realtor
September 2017 rebgv statistics package mike stewart realtor
 
July 2017 Real Estate Board of Greater Vancouver Stats Package Mike Stewart r...
July 2017 Real Estate Board of Greater Vancouver Stats Package Mike Stewart r...July 2017 Real Estate Board of Greater Vancouver Stats Package Mike Stewart r...
July 2017 Real Estate Board of Greater Vancouver Stats Package Mike Stewart r...
 
15% tax on international buyers in vancouver
15% tax on international buyers in vancouver15% tax on international buyers in vancouver
15% tax on international buyers in vancouver
 
REBGV Stats for December 2011 Courtesy Mike Stewart Vancouver Realtor
REBGV Stats for December 2011 Courtesy Mike Stewart Vancouver RealtorREBGV Stats for December 2011 Courtesy Mike Stewart Vancouver Realtor
REBGV Stats for December 2011 Courtesy Mike Stewart Vancouver Realtor
 
October 2011 REBGV Stats Mike Stewart
October 2011 REBGV Stats Mike StewartOctober 2011 REBGV Stats Mike Stewart
October 2011 REBGV Stats Mike Stewart
 
REBGV Stats for Sept 2011 Mike Stewart
REBGV Stats for Sept 2011 Mike StewartREBGV Stats for Sept 2011 Mike Stewart
REBGV Stats for Sept 2011 Mike Stewart
 

Kürzlich hochgeladen

Call Girls In Mayur Vihar Delhi ☆↫8447779280 ❤Escorts Service In Delhi
Call Girls In Mayur Vihar Delhi ☆↫8447779280 ❤Escorts Service In DelhiCall Girls In Mayur Vihar Delhi ☆↫8447779280 ❤Escorts Service In Delhi
Call Girls In Mayur Vihar Delhi ☆↫8447779280 ❤Escorts Service In Delhiasmaqueen5
 
9990771857 Call Girls in Dwarka Sector 1 Delhi (Call Girls) Delhi
9990771857 Call Girls in Dwarka Sector 1 Delhi (Call Girls) Delhi9990771857 Call Girls in Dwarka Sector 1 Delhi (Call Girls) Delhi
9990771857 Call Girls in Dwarka Sector 1 Delhi (Call Girls) Delhidelhimodel235
 
Shapoorji Pallonji Joyville Vista Pune | Spend Your Family Time Together
Shapoorji Pallonji Joyville Vista Pune | Spend Your Family Time TogetherShapoorji Pallonji Joyville Vista Pune | Spend Your Family Time Together
Shapoorji Pallonji Joyville Vista Pune | Spend Your Family Time Togetheraidasheikh47
 
2k Shot Call girls Karol Bagh Delhi 9205541914
2k Shot Call girls Karol Bagh Delhi 92055419142k Shot Call girls Karol Bagh Delhi 9205541914
2k Shot Call girls Karol Bagh Delhi 9205541914Delhi Call girls
 
3D Architectural Rendering Company by Panoram CGI
3D Architectural Rendering Company by Panoram CGI3D Architectural Rendering Company by Panoram CGI
3D Architectural Rendering Company by Panoram CGIPanoram CGI
 
M3M The Line Brochure - Premium Investment Opportunity for Commercial Ventures
M3M The Line Brochure - Premium Investment Opportunity for Commercial VenturesM3M The Line Brochure - Premium Investment Opportunity for Commercial Ventures
M3M The Line Brochure - Premium Investment Opportunity for Commercial Venturessheltercareglobal
 
9990771857 Call Girls in Dwarka Sector 137 Noida (Call Girls) Delhi
9990771857 Call Girls in Dwarka Sector 137 Noida (Call Girls) Delhi9990771857 Call Girls in Dwarka Sector 137 Noida (Call Girls) Delhi
9990771857 Call Girls in Dwarka Sector 137 Noida (Call Girls) Delhidelhimodel235
 
2k Shot Call girls Aiims Delhi 9205541914
2k Shot Call girls Aiims Delhi 92055419142k Shot Call girls Aiims Delhi 9205541914
2k Shot Call girls Aiims Delhi 9205541914Delhi Call girls
 
9990771857 Call Girls in Dwarka Sector 2 Delhi (Call Girls) Delhi
9990771857 Call Girls in Dwarka Sector 2 Delhi (Call Girls) Delhi9990771857 Call Girls in Dwarka Sector 2 Delhi (Call Girls) Delhi
9990771857 Call Girls in Dwarka Sector 2 Delhi (Call Girls) Delhidelhimodel235
 
BDSM⚡Call Girls in Sector 57 Noida Escorts >༒8448380779 Escort Service
BDSM⚡Call Girls in Sector 57 Noida Escorts >༒8448380779 Escort ServiceBDSM⚡Call Girls in Sector 57 Noida Escorts >༒8448380779 Escort Service
BDSM⚡Call Girls in Sector 57 Noida Escorts >༒8448380779 Escort ServiceDelhi Call girls
 
Call Girls in shastri nagar Delhi 8264348440 ✅ call girls ❤️
Call Girls in shastri nagar Delhi 8264348440 ✅ call girls ❤️Call Girls in shastri nagar Delhi 8264348440 ✅ call girls ❤️
Call Girls in shastri nagar Delhi 8264348440 ✅ call girls ❤️soniya singh
 
Maha Mauka Squarefeet Brochure |Maha Mauka Squarefeet PDF Brochure|
Maha Mauka Squarefeet Brochure |Maha Mauka Squarefeet PDF Brochure|Maha Mauka Squarefeet Brochure |Maha Mauka Squarefeet PDF Brochure|
Maha Mauka Squarefeet Brochure |Maha Mauka Squarefeet PDF Brochure|AkshayJoshi575980
 
M3M 129 E Brochure Noida Expressway, Sector 129, Noida
M3M 129 E Brochure Noida Expressway, Sector 129, NoidaM3M 129 E Brochure Noida Expressway, Sector 129, Noida
M3M 129 E Brochure Noida Expressway, Sector 129, Noidasarak0han45400
 
Kohinoor Flats In Hinjewadi Phase 2 | Homes Built To Suit Your Needs
Kohinoor Flats In Hinjewadi Phase 2 | Homes Built To Suit Your NeedsKohinoor Flats In Hinjewadi Phase 2 | Homes Built To Suit Your Needs
Kohinoor Flats In Hinjewadi Phase 2 | Homes Built To Suit Your Needsaidasheikh47
 
call girls in ganesh nagar Delhi 8264348440 ✅ call girls ❤️
call girls in ganesh nagar Delhi 8264348440 ✅ call girls ❤️call girls in ganesh nagar Delhi 8264348440 ✅ call girls ❤️
call girls in ganesh nagar Delhi 8264348440 ✅ call girls ❤️soniya singh
 
Call Girls In Laxmi Nagar Delhi +91-8447779280! !Best Woman Seeking Man Escor...
Call Girls In Laxmi Nagar Delhi +91-8447779280! !Best Woman Seeking Man Escor...Call Girls In Laxmi Nagar Delhi +91-8447779280! !Best Woman Seeking Man Escor...
Call Girls In Laxmi Nagar Delhi +91-8447779280! !Best Woman Seeking Man Escor...asmaqueen5
 
Call girls in new Ashok NagarDelhi꧁ 8447779280꧂ Escort Service Women Seeking ...
Call girls in new Ashok NagarDelhi꧁ 8447779280꧂ Escort Service Women Seeking ...Call girls in new Ashok NagarDelhi꧁ 8447779280꧂ Escort Service Women Seeking ...
Call girls in new Ashok NagarDelhi꧁ 8447779280꧂ Escort Service Women Seeking ...asmaqueen5
 
Properties for Sale in Istanbul with Schools and Parks | Antalya Development
Properties for Sale in Istanbul with Schools and Parks | Antalya DevelopmentProperties for Sale in Istanbul with Schools and Parks | Antalya Development
Properties for Sale in Istanbul with Schools and Parks | Antalya DevelopmentAntalya Development
 
Kohinoor Hinjewadi Phase 2 Pune E-Brochure.pdf
Kohinoor Hinjewadi Phase 2 Pune  E-Brochure.pdfKohinoor Hinjewadi Phase 2 Pune  E-Brochure.pdf
Kohinoor Hinjewadi Phase 2 Pune E-Brochure.pdfManishSaxena95
 
SVN Live 5.6.24 Weekly Property Broadcast
SVN Live 5.6.24 Weekly Property BroadcastSVN Live 5.6.24 Weekly Property Broadcast
SVN Live 5.6.24 Weekly Property BroadcastSVN International Corp.
 

Kürzlich hochgeladen (20)

Call Girls In Mayur Vihar Delhi ☆↫8447779280 ❤Escorts Service In Delhi
Call Girls In Mayur Vihar Delhi ☆↫8447779280 ❤Escorts Service In DelhiCall Girls In Mayur Vihar Delhi ☆↫8447779280 ❤Escorts Service In Delhi
Call Girls In Mayur Vihar Delhi ☆↫8447779280 ❤Escorts Service In Delhi
 
9990771857 Call Girls in Dwarka Sector 1 Delhi (Call Girls) Delhi
9990771857 Call Girls in Dwarka Sector 1 Delhi (Call Girls) Delhi9990771857 Call Girls in Dwarka Sector 1 Delhi (Call Girls) Delhi
9990771857 Call Girls in Dwarka Sector 1 Delhi (Call Girls) Delhi
 
Shapoorji Pallonji Joyville Vista Pune | Spend Your Family Time Together
Shapoorji Pallonji Joyville Vista Pune | Spend Your Family Time TogetherShapoorji Pallonji Joyville Vista Pune | Spend Your Family Time Together
Shapoorji Pallonji Joyville Vista Pune | Spend Your Family Time Together
 
2k Shot Call girls Karol Bagh Delhi 9205541914
2k Shot Call girls Karol Bagh Delhi 92055419142k Shot Call girls Karol Bagh Delhi 9205541914
2k Shot Call girls Karol Bagh Delhi 9205541914
 
3D Architectural Rendering Company by Panoram CGI
3D Architectural Rendering Company by Panoram CGI3D Architectural Rendering Company by Panoram CGI
3D Architectural Rendering Company by Panoram CGI
 
M3M The Line Brochure - Premium Investment Opportunity for Commercial Ventures
M3M The Line Brochure - Premium Investment Opportunity for Commercial VenturesM3M The Line Brochure - Premium Investment Opportunity for Commercial Ventures
M3M The Line Brochure - Premium Investment Opportunity for Commercial Ventures
 
9990771857 Call Girls in Dwarka Sector 137 Noida (Call Girls) Delhi
9990771857 Call Girls in Dwarka Sector 137 Noida (Call Girls) Delhi9990771857 Call Girls in Dwarka Sector 137 Noida (Call Girls) Delhi
9990771857 Call Girls in Dwarka Sector 137 Noida (Call Girls) Delhi
 
2k Shot Call girls Aiims Delhi 9205541914
2k Shot Call girls Aiims Delhi 92055419142k Shot Call girls Aiims Delhi 9205541914
2k Shot Call girls Aiims Delhi 9205541914
 
9990771857 Call Girls in Dwarka Sector 2 Delhi (Call Girls) Delhi
9990771857 Call Girls in Dwarka Sector 2 Delhi (Call Girls) Delhi9990771857 Call Girls in Dwarka Sector 2 Delhi (Call Girls) Delhi
9990771857 Call Girls in Dwarka Sector 2 Delhi (Call Girls) Delhi
 
BDSM⚡Call Girls in Sector 57 Noida Escorts >༒8448380779 Escort Service
BDSM⚡Call Girls in Sector 57 Noida Escorts >༒8448380779 Escort ServiceBDSM⚡Call Girls in Sector 57 Noida Escorts >༒8448380779 Escort Service
BDSM⚡Call Girls in Sector 57 Noida Escorts >༒8448380779 Escort Service
 
Call Girls in shastri nagar Delhi 8264348440 ✅ call girls ❤️
Call Girls in shastri nagar Delhi 8264348440 ✅ call girls ❤️Call Girls in shastri nagar Delhi 8264348440 ✅ call girls ❤️
Call Girls in shastri nagar Delhi 8264348440 ✅ call girls ❤️
 
Maha Mauka Squarefeet Brochure |Maha Mauka Squarefeet PDF Brochure|
Maha Mauka Squarefeet Brochure |Maha Mauka Squarefeet PDF Brochure|Maha Mauka Squarefeet Brochure |Maha Mauka Squarefeet PDF Brochure|
Maha Mauka Squarefeet Brochure |Maha Mauka Squarefeet PDF Brochure|
 
M3M 129 E Brochure Noida Expressway, Sector 129, Noida
M3M 129 E Brochure Noida Expressway, Sector 129, NoidaM3M 129 E Brochure Noida Expressway, Sector 129, Noida
M3M 129 E Brochure Noida Expressway, Sector 129, Noida
 
Kohinoor Flats In Hinjewadi Phase 2 | Homes Built To Suit Your Needs
Kohinoor Flats In Hinjewadi Phase 2 | Homes Built To Suit Your NeedsKohinoor Flats In Hinjewadi Phase 2 | Homes Built To Suit Your Needs
Kohinoor Flats In Hinjewadi Phase 2 | Homes Built To Suit Your Needs
 
call girls in ganesh nagar Delhi 8264348440 ✅ call girls ❤️
call girls in ganesh nagar Delhi 8264348440 ✅ call girls ❤️call girls in ganesh nagar Delhi 8264348440 ✅ call girls ❤️
call girls in ganesh nagar Delhi 8264348440 ✅ call girls ❤️
 
Call Girls In Laxmi Nagar Delhi +91-8447779280! !Best Woman Seeking Man Escor...
Call Girls In Laxmi Nagar Delhi +91-8447779280! !Best Woman Seeking Man Escor...Call Girls In Laxmi Nagar Delhi +91-8447779280! !Best Woman Seeking Man Escor...
Call Girls In Laxmi Nagar Delhi +91-8447779280! !Best Woman Seeking Man Escor...
 
Call girls in new Ashok NagarDelhi꧁ 8447779280꧂ Escort Service Women Seeking ...
Call girls in new Ashok NagarDelhi꧁ 8447779280꧂ Escort Service Women Seeking ...Call girls in new Ashok NagarDelhi꧁ 8447779280꧂ Escort Service Women Seeking ...
Call girls in new Ashok NagarDelhi꧁ 8447779280꧂ Escort Service Women Seeking ...
 
Properties for Sale in Istanbul with Schools and Parks | Antalya Development
Properties for Sale in Istanbul with Schools and Parks | Antalya DevelopmentProperties for Sale in Istanbul with Schools and Parks | Antalya Development
Properties for Sale in Istanbul with Schools and Parks | Antalya Development
 
Kohinoor Hinjewadi Phase 2 Pune E-Brochure.pdf
Kohinoor Hinjewadi Phase 2 Pune  E-Brochure.pdfKohinoor Hinjewadi Phase 2 Pune  E-Brochure.pdf
Kohinoor Hinjewadi Phase 2 Pune E-Brochure.pdf
 
SVN Live 5.6.24 Weekly Property Broadcast
SVN Live 5.6.24 Weekly Property BroadcastSVN Live 5.6.24 Weekly Property Broadcast
SVN Live 5.6.24 Weekly Property Broadcast
 

REBGV November 2015 Statistics Package Mike Stewart Realtor