October 2016 REBGV Statistics Package Vancouver BC Mike Stewart Realtor
•
0 gefällt mir•3,708 views

http://www.mikestewart.ca/real-estate-board-of-greater-vancouver-rebgv-monthly-sales-statistics/

Empfohlen
Empfohlen
Weitere ähnliche Inhalte
Was ist angesagt?
Was ist angesagt? (20)
Ähnlich wie October 2016 REBGV Statistics Package Vancouver BC Mike Stewart Realtor
Ähnlich wie October 2016 REBGV Statistics Package Vancouver BC Mike Stewart Realtor (20)
Mehr von Mike Stewart
Mehr von Mike Stewart (8)
Kürzlich hochgeladen
Kürzlich hochgeladen (20)
October 2016 REBGV Statistics Package Vancouver BC Mike Stewart Realtor
- 1. News Release FOR IMMEDIATE RELEASE: Home sale and listing activity dip below historical averages in October VANCOUVER, BC – November 2, 2016 – Reduced home sale and listing activity are changing market dynamics in communities across Metro Vancouver*. Residential property sales in the region totalled 2,233 in October 2016, a 38.8 per cent decrease from the 3,646 sales recorded in October 2015 and a 0.9 per cent decrease compared to September 2016 when 2,253 homes sold. Last month’s sales were 15 per cent below the 10-year October sales average. “Changing market conditions compounded by a series of government interventions this year have put home buyers and sellers in a holding pattern,” Dan Morrison, Real Estate Board of Greater Vancouver (REBGV) president said. “Potential buyers and sellers are taking a wait-and- see approach to try and better understand what these changes mean for them.” New listings for detached, attached and apartment properties in Metro Vancouver totalled 3,981 in October 2016. This represents a decrease of 3.5 per cent compared to the 4,126 units listed in October 2015 and a 17 per cent decrease compared to September 2016 when 4,799 properties were listed. Last month’s new listing count was 9.5 per cent below the region’s 10-year new listing average for the month. The total number of properties currently listed for sale on the MLS® system in Metro Vancouver is 9,143, a 4.5 per cent decrease compared to October 2015 (9,569) and a 2.3 per cent decrease compared to September 2016 (9,354). The sales-to-active listings ratio for October 2016 is 24.4 per cent. Generally, analysts say that downward pressure on home prices occurs when the ratio dips below the 12 per cent mark for a sustained period, while home prices often experience upward pressure when it surpasses 20 per cent over several months. “While sales are down across the different property types, it’s the detached market that’s seen the largest reduction in home buyer demand in recent months,” Morrison said. “It’s important to work with your local REALTOR® to help you navigate today’s changing trends.”
- 2. The MLS® Home Price Index composite benchmark price for all residential properties in Metro Vancouver is currently $919,300. This represents a 24.8 per cent increase compared to October 2015 and a 0.8 per cent decline compared to September 2016. Sales of detached properties in October 2016 reached 652, a decrease of 54.6 per cent from the 1,437 detached sales recorded in October 2015. The benchmark price for detached properties is $1,545,800. This represents a 28.9 per cent increase compared to October 2015 and a 1.4 per cent decrease compared to September 2016. Sales of apartment properties reached 1,178 in October 2016, a decrease of 23.7 per cent compared to the 1,543 sales in October 2015.The benchmark price of an apartment property is $512,300. This represents a 20.5 per cent increase compared to October 2015 and a 0.3 per cent increase compared to September 2016. Attached property sales in October 2016 totalled 403, a decrease of 39.5 per cent compared to the 666 sales in October 2015. The benchmark price of an attached unit is $669,200. This represents a 25.7 per cent increase compared to October 2015 and a 1.1 per cent decrease compared to September 2016. Correction Notice: Altus Group, the provider of the national MLS® Home Price Index (MLS® HPI), discovered a calculation error in their September 2016 reporting. This error resulted in variances of between 0.1 and 5 per cent in the benchmark prices the REBGV released for September 2016. Corrected September MLS® HPI numbers can be found at www.rebgv.org. -30- *Editor’s Note: Areas covered by Real Estate Board of Greater Vancouver include: Whistler, Sunshine Coast, Squamish, West Vancouver, North Vancouver, Vancouver, Burnaby, New Westminster, Richmond, Port Moody, Port Coquitlam, Coquitlam, New Westminster, Pitt Meadows, Maple Ridge, and South Delta. The real estate industry is a key economic driver in British Columbia. In 2015, 42,326 homes changed ownership in the Board’s area, generating $2.7 billion in economic spin-off activity and an estimated 19,000 jobs. The total dollar value of residential sales transacted through the MLS® system in Greater Vancouver totalled $39 billion in 2015. The Real Estate Board of Greater Vancouver is an association representing more than 13,000 REALTORS® and their companies. The Board provides a variety of member services, including the Multiple Listing Service®. For more information on real estate, statistics, and buying or selling a home, contact a local Realtor or visit www.rebgv.org. For more information please contact: Craig Munn Manager, Communication Real Estate Board of Greater Vancouver 604.730.3146 cmunn@rebgv.org
- 3. Property Type Area Benchmark Price Price Index 1 Month Change % 3 Month Change % 6 Month Change % 1 Year Change % 3 Year Change % 5 Year Change % 10 Year Change % Residential / Composite Lower Mainland $820,900 231.5 -0.6% -0.8% 10.0% 26.7% 51.6% 50.9% 79.7% Greater Vancouver $919,300 240.6 -0.8% -1.2% 8.8% 24.8% 52.7% 51.1% 87.5% Bowen Island $792,800 171.9 -0.5% 0.0% 16.8% 23.0% 38.1% 32.8% 36.3% Burnaby East $842,300 232.5 -1.3% -1.9% 6.3% 21.7% 48.0% 54.1% 79.3% Burnaby North $769,900 231.4 -0.7% -1.2% 9.0% 24.7% 48.2% 49.3% 79.8% Burnaby South $855,100 241.7 -1.2% -1.6% 11.4% 23.7% 50.0% 47.6% 88.5% Coquitlam $766,300 227.4 -1.0% -1.6% 8.1% 23.3% 53.6% 54.3% 78.4% Ladner $830,800 230.9 -2.8% -0.9% 6.5% 26.3% 57.6% 53.4% 87.7% Maple Ridge $575,100 194.3 0.1% 1.6% 14.8% 32.7% 48.9% 46.1% 54.8% New Westminster $526,700 224.3 -2.5% -0.5% 9.0% 23.1% 43.1% 43.4% 67.4% North Vancouver $995,000 224.5 -1.0% -2.2% 9.9% 27.4% 53.2% 58.5% 83.6% Pitt Meadows $559,600 204.7 0.0% 3.2% 15.3% 30.5% 45.3% 48.0% 57.8% Port Coquitlam $590,900 209.4 -0.7% -1.4% 7.3% 25.4% 49.0% 47.5% 61.9% Port Moody $769,000 212.6 -1.3% -0.2% 6.8% 23.0% 50.0% 57.7% 67.3% Richmond $875,500 253.7 0.0% -0.9% 9.4% 25.9% 53.8% 48.5% 97.3% Squamish $617,600 201.3 -1.4% 1.6% 10.7% 26.6% 58.9% 64.2% 73.7% Sunshine Coast $486,000 170.3 0.9% 3.6% 15.0% 27.2% 41.0% 31.4% 34.6% Tsawwassen $977,600 244.9 -1.2% -1.3% 8.7% 29.5% 65.8% 62.7% 97.8% Vancouver East $990,400 290.1 0.5% 0.4% 11.7% 28.2% 62.6% 65.9% 120.3% Vancouver West $1,232,300 259.7 -0.7% -1.9% 6.5% 22.7% 54.0% 51.7% 99.9% West Vancouver $2,654,700 284.9 -4.1% -4.4% 8.5% 28.6% 66.8% 73.1% 122.1% Whistler $703,700 163.5 -2.3% 2.3% 8.5% 23.4% 53.8% 48.2% 44.9% Single Family Detached Lower Mainland $1,238,700 263.1 -1.1% -1.8% 10.6% 30.4% 63.5% 63.2% 107.8% Greater Vancouver $1,545,800 285.1 -1.4% -2.1% 10.2% 28.9% 67.2% 64.0% 126.4% Bowen Island $792,800 171.9 -0.5% 0.0% 16.8% 23.0% 38.1% 32.8% 36.3% Burnaby East $1,181,100 264.1 -3.9% -5.5% 5.1% 22.7% 55.8% 65.0% 107.6% Burnaby North $1,549,200 299.6 -1.0% -3.4% 8.2% 25.4% 66.7% 71.7% 137.2% Burnaby South $1,657,100 317.2 -1.9% -3.1% 11.1% 31.6% 71.0% 71.3% 149.8% Coquitlam $1,197,100 265.6 -1.1% -2.4% 10.3% 29.8% 68.8% 73.8% 111.6% Ladner $1,035,800 249.7 -2.7% 0.2% 6.6% 30.1% 68.6% 64.5% 104.8% Maple Ridge $714,600 203.6 -0.4% 1.2% 13.9% 34.6% 55.1% 55.9% 66.9% New Westminster $1,046,000 259.5 -3.7% -4.8% 6.3% 24.5% 57.0% 59.3% 104.8% North Vancouver $1,658,400 264.0 -0.3% -2.4% 11.5% 34.7% 74.1% 78.9% 121.5% Pitt Meadows $792,500 223.3 -0.1% 3.3% 17.2% 33.9% 57.3% 58.0% 75.8% Port Coquitlam $879,500 234.6 -1.0% -4.4% 3.9% 23.9% 59.5% 61.6% 85.9% Port Moody $1,378,100 254.5 -0.3% -1.4% 9.7% 27.6% 60.4% 72.1% 104.1% Richmond $1,673,300 335.6 -0.7% -2.6% 11.3% 34.8% 80.3% 65.8% 161.6% Squamish $770,300 204.8 -2.3% -1.2% 12.1% 25.3% 51.5% 54.6% 72.2% Sunshine Coast $483,800 169.5 0.8% 3.5% 14.8% 27.3% 41.1% 30.8% 34.1% Tsawwassen $1,253,400 269.9 -1.3% -1.3% 7.4% 31.3% 76.1% 76.5% 118.9% Vancouver East $1,516,900 335.3 -1.3% -0.7% 12.7% 29.1% 78.5% 83.7% 163.0% Vancouver West $3,569,700 366.5 -1.5% -0.6% 11.6% 28.7% 70.9% 59.7% 181.9% West Vancouver $3,210,100 305.2 -4.5% -4.6% 9.6% 29.6% 70.2% 79.3% 138.8% Whistler $1,311,200 181.5 0.7% 2.4% 11.1% 21.6% 45.5% 40.0% 57.4% HOW TO READ THE TABLE: • Benchmark Price: Estimated sale price of a benchmark property. Benchmarks represent a typical property within each market. • Price Index: Index numbers estimate the percentage change in price on typical and constant quality properties over time. All figures are based on past sales. • x Month/Year Change %: Percentage change of index over a period of x month(s)/year(s) * In January 2005, the indexes are set to 100. Townhome properties are similar to Attached properties, a category that was used in the previous MLSLink HPI, but do not included duplexes. The above info is deemed reliable, but is not guaranteed. All dollar amounts in CDN. October 2016* * MLS®, Multiple Listing Service®, and all related graphics are trademarks of The Canadian Real Estate Association 1 of 14
- 4. Property Type Area Benchmark Price Price Index 1 Month Change % 3 Month Change % 6 Month Change % 1 Year Change % 3 Year Change % 5 Year Change % 10 Year Change % October 2016* Townhouse Lower Mainland $560,300 202.8 -0.4% 1.2% 13.2% 28.4% 43.4% 40.1% 59.6% Greater Vancouver $669,200 216.3 -1.1% 0.0% 10.0% 25.7% 45.5% 43.0% 70.6% Burnaby East $530,300 190.2 2.6% 7.0% 14.3% 20.5% 25.6% 31.4% 48.9% Burnaby North $519,500 193.7 -3.3% -1.1% 7.3% 18.6% 27.5% 22.1% 50.3% Burnaby South $568,800 204.1 -2.9% 1.7% 17.6% 24.5% 37.6% 33.5% 61.1% Coquitlam $508,700 186.9 -3.0% -2.2% -0.3% 14.2% 35.1% 32.5% 48.2% Ladner $598,200 198.2 -6.3% -5.7% 1.8% 16.3% 34.9% 36.9% 58.2% Maple Ridge $405,000 196.7 1.8% 1.7% 23.2% 33.3% 50.8% 41.1% 50.4% New Westminster $517,200 194.3 -3.5% -5.1% 2.2% 17.5% 31.2% 34.9% 51.9% North Vancouver $842,300 201.6 -4.2% -3.0% 11.8% 25.7% 46.3% 43.0% 65.4% Pitt Meadows $474,400 205.3 -0.1% 1.4% 17.0% 30.1% 50.0% 49.7% 59.5% Port Coquitlam $547,400 207.6 0.8% 1.5% 11.9% 31.4% 46.4% 47.1% 61.1% Port Moody $524,000 177.1 -4.0% -3.3% -1.8% 9.5% 30.5% 28.6% 37.1% Richmond $714,500 231.0 -1.0% -1.3% 8.8% 24.5% 44.4% 39.0% 82.0% Squamish $625,200 227.1 0.5% 3.1% 8.9% 33.6% 82.1% 94.6% 102.0% Tsawwassen $599,800 198.2 -6.0% -3.9% 3.4% 18.8% 40.1% 32.2% 58.2% Vancouver East $771,000 254.2 -0.7% 0.2% 7.0% 27.9% 51.9% 50.3% 88.4% Vancouver West $1,123,800 254.2 0.7% 3.2% 16.3% 35.4% 58.5% 66.6% 105.0% Whistler $769,700 205.8 -0.2% 1.9% 6.5% 29.1% 63.9% 74.9% 89.7% Apartment Lower Mainland $462,100 201.8 0.5% 1.0% 8.7% 20.9% 37.6% 37.6% 52.0% Greater Vancouver $512,300 206.0 0.3% 0.3% 7.9% 20.5% 39.4% 39.2% 57.0% Burnaby East $526,300 199.8 -0.9% -4.2% -3.0% 11.7% 39.2% 47.9% 44.2% Burnaby North $467,600 197.7 0.4% 1.3% 11.5% 26.2% 38.5% 40.1% 51.6% Burnaby South $530,300 212.9 -0.2% -0.9% 11.7% 19.6% 40.2% 36.2% 64.3% Coquitlam $344,100 189.4 0.1% 1.2% 8.8% 17.9% 38.6% 33.9% 43.9% Ladner $413,600 196.0 1.1% 0.5% 14.6% 22.7% 40.8% 29.9% 56.8% Maple Ridge $205,500 148.4 0.8% 6.2% 11.1% 24.8% 16.2% 9.5% 9.0% New Westminster $376,800 214.6 -1.9% 2.2% 11.4% 23.0% 38.6% 38.0% 56.6% North Vancouver $451,600 183.8 -0.5% -1.0% 8.1% 18.4% 29.4% 37.0% 46.1% Pitt Meadows $305,900 180.8 0.2% 5.2% 11.7% 26.4% 26.8% 34.9% 32.7% Port Coquitlam $308,000 182.6 -1.2% 2.4% 11.6% 25.8% 40.7% 31.7% 36.5% Port Moody $477,100 198.8 -0.6% 3.7% 10.1% 27.4% 49.1% 60.8% 56.2% Richmond $451,300 190.6 2.1% 4.4% 11.0% 18.3% 28.7% 31.6% 46.6% Squamish $357,500 172.1 -2.8% 4.9% 10.4% 21.9% 62.7% 65.6% 51.1% Tsawwassen $427,400 180.2 0.4% -0.4% 15.7% 24.4% 39.0% 26.2% 44.2% Vancouver East $450,000 248.2 3.6% 3.3% 12.4% 28.4% 46.6% 49.7% 80.5% Vancouver West $680,100 220.1 -0.2% -2.6% 3.5% 19.2% 45.8% 45.8% 68.4% West Vancouver $899,800 196.6 -0.4% 0.6% 5.4% 24.3% 47.5% 40.8% 51.1% Whistler $368,700 120.9 -6.4% 4.4% 12.0% 25.9% 78.3% 61.0% 5.0% HOW TO READ THE TABLE: • Benchmark Price: Estimated sale price of a benchmark property. Benchmarks represent a typical property within each market. • Price Index: Index numbers estimate the percentage change in price on typical and constant quality properties over time. All figures are based on past sales. • x Month/Year Change %: Percentage change of index over a period of x month(s)/year(s) In January 2005, the indexes are set to 100. * Townhome properties are similar to attached properties, a category that was used in the previous MLSLink HPI, but do not included duplexes. Lower Mainland includes areas serviced by both Real Estate Board of Greater Vancouver & Fraser Valley Real Estate Board. The above info is deemed reliable, but is not guaranteed. All dollar amounts in CDN. * MLS®, Multiple Listing Service®, and all related graphics are trademarks of The Canadian Real Estate Association 2 of 14
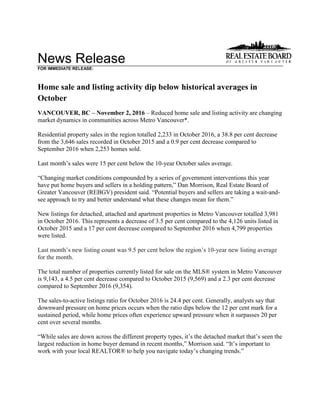
- 5. C:DATAMonthEndHpiexporthi_resgv-hpi2.tifGreaterVancouver 5YearTrend 60 110 160 210 260 310 Oct 2011 Dec 2011 Feb 2012 Apr 2012 Jun 2012 Aug 2012 Oct 2012 Dec 2012 Feb 2013 Apr 2013 Jun 2013 Aug 2013 Oct 2013 Dec 2013 Feb 2014 Apr 2014 Jun 2014 Aug 2014 Oct 2014 Dec 2014 Feb 2015 Apr 2015 Jun 2015 Aug 2015 Oct 2015 Dec 2015 Feb 2016 Apr 2016 Jun 2016 Aug 2016 Oct 2016 Price Index ResidentialDetachedTownhouseApartment Jan2005HPI=100
- 8. Listing & Sales Activity Summary Listings Sales 1 2 3 Col. 2 & 3 5 6 7 Col. 6 & 7 9 10 Col. 9 & 10 Oct Sep Oct Percentage Oct Sep Oct Percentage Aug 2015 - Aug 2016 - Percentage 2015 2016 2016 Variance 2015 2016 2016 Variance Oct 2015 Oct 2016 Variance BURNABY % % % DETACHED 159 183 160 -12.6 128 58 44 -24.1 338 146 -56.8 ATTACHED 104 89 60 -32.6 94 32 52 62.5 246 129 -47.6 APARTMENTS 298 225 204 -9.3 223 165 150 -9.1 659 498 -24.4 COQUITLAM DETACHED 115 188 123 -34.6 113 63 59 -6.3 343 179 -47.8 ATTACHED 35 52 57 9.6 54 23 29 26.1 160 89 -44.4 APARTMENTS 136 126 122 -3.2 104 79 95 20.3 310 277 -10.6 DELTA DETACHED 49 78 67 -14.1 58 21 21 0.0 159 65 -59.1 ATTACHED 8 18 29 61.1 9 19 14 -26.3 30 36 20.0 APARTMENTS 24 22 21 -4.5 33 9 16 77.8 77 42 -45.5 MAPLE RIDGE/PITT MEADOWS DETACHED 151 219 166 -24.2 159 92 110 19.6 464 337 -27.4 ATTACHED 65 68 74 8.8 81 45 42 -6.7 213 162 -23.9 APARTMENTS 34 54 59 9.3 20 44 32 -27.3 84 135 60.7 NORTH VANCOUVER DETACHED 102 215 156 -27.4 130 53 61 15.1 332 176 -47.0 ATTACHED 56 59 43 -27.1 36 31 32 3.2 101 84 -16.8 APARTMENTS 128 165 112 -32.1 123 97 74 -23.7 330 248 -24.8 NEW WESTMINSTER DETACHED 40 35 34 -2.9 25 17 14 -17.6 87 44 -49.4 ATTACHED 17 11 14 27.3 11 6 6 0.0 41 19 -53.7 APARTMENTS 126 127 101 -20.5 117 91 86 -5.5 282 277 -1.8 PORT MOODY/BELCARRA DETACHED 27 40 26 -35.0 42 8 15 87.5 90 35 -61.1 ATTACHED 27 22 21 -4.5 17 20 15 -25.0 44 51 15.9 APARTMENTS 27 47 38 -19.1 36 31 34 9.7 103 101 -1.9 PORT COQUITLAM DETACHED 42 74 57 -23.0 46 27 29 7.4 141 78 -44.7 ATTACHED 32 41 30 -26.8 32 18 17 -5.6 105 51 -51.4 APARTMENTS 63 74 58 -21.6 42 53 46 -13.2 120 151 25.8 RICHMOND DETACHED 194 244 191 -21.7 194 79 61 -22.8 551 201 -63.5 ATTACHED 138 103 118 14.6 132 60 68 13.3 310 199 -35.8 APARTMENTS 248 198 199 0.5 161 130 161 23.8 533 482 -9.6 SUNSHINE COAST DETACHED 62 90 51 -43.3 61 56 43 -23.2 200 170 -15.0 ATTACHED 11 8 7 -12.5 8 10 12 20.0 16 34 112.5 APARTMENTS 12 14 9 -35.7 5 10 5 -50.0 20 22 10.0 SQUAMISH DETACHED 34 46 32 -30.4 27 19 11 -42.1 84 53 -36.9 ATTACHED 35 36 22 -38.9 28 10 14 40.0 59 37 -37.3 APARTMENTS 15 25 22 -12.0 19 13 10 -23.1 47 34 -27.7 VANCOUVER EAST DETACHED 179 296 233 -21.3 149 62 65 4.8 431 205 -52.4 ATTACHED 62 68 54 -20.6 52 26 28 7.7 137 78 -43.1 APARTMENTS 160 187 210 12.3 154 112 109 -2.7 438 336 -23.3 VANCOUVER WEST DETACHED 215 250 163 -34.8 163 60 78 30.0 436 199 -54.4 ATTACHED 93 86 91 5.8 78 37 30 -18.9 205 116 -43.4 APARTMENTS 523 609 495 -18.7 457 329 299 -9.1 1416 970 -31.5 WHISTLER/PEMBERTON DETACHED 18 19 18 -5.3 22 24 15 -37.5 64 52 -18.8 ATTACHED 26 22 43 95.5 25 30 42 40.0 100 110 10.0 APARTMENTS 36 46 43 -6.5 29 40 50 25.0 89 122 37.1 WEST VANCOUVER/HOWE SOUND DETACHED 153 170 119 -30.0 116 22 22 0.0 266 75 -71.8 ATTACHED 9 5 5 0.0 9 2 2 0.0 21 8 -61.9 APARTMENTS 29 31 17 -45.2 20 15 11 -26.7 58 44 -24.1 GRAND TOTALS DETACHED 1540 2147 1596 -25.7 1433 661 648 -2.0 3986 2015 -49.4 ATTACHED 718 688 668 -2.9 666 369 403 9.2 1788 1203 -32.7 APARTMENTS 1859 1950 1710 -12.3 1543 1218 1178 -3.3 4566 3739 -18.1