![Sustainable Investment Initiative Green Building Financing Program San Diego Pilot ,[object Object],[object Object],[object Object],[object Object],[object Object],[object Object],[object Object],[object Object],[object Object],[object Object],[object Object],[object Object],[object Object],[object Object],[object Object],[object Object],[object Object]](data:image/gif;base64,R0lGODlhAQABAIAAAAAAAP///yH5BAEAAAAALAAAAAABAAEAAAIBRAA7)
Empfohlen
Weitere ähnliche Inhalte
Was ist angesagt?
Was ist angesagt? (12)
Ähnlich wie Capital Markets Partnership 1 10 09
Ähnlich wie Capital Markets Partnership 1 10 09 (20)
Kürzlich hochgeladen
Kürzlich hochgeladen (20)
Capital Markets Partnership 1 10 09
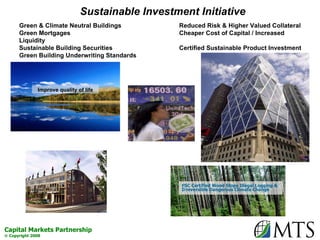
- 1. FSC Certified Wood Stops Illegal Logging & Irreversible Dangerous Climate Change Sustainable Investment Initiative Green & Climate Neutral Buildings Reduced Risk & Higher Valued Collateral Green Mortgages Cheaper Cost of Capital / Increased Liquidity Sustainable Building Securities Certified Sustainable Product Investment Green Building Underwriting Standards Improve quality of life
- 4. Capital Markets Partnership – Partial List City of San Francisco City of Chicago City of Dallas City of Denver City of Miami City of New York City of Oakland City of San Jose City of Santa Monica City of Seattle
- 6. Capital Markets Partnership CMP Officers Green Building Underwriting Standards Committee EMERGENCY Consensus Standards Launched in April 2008 by JPMorgan Chase, Wells Fargo Wachovia Unanimously Approved September 2, 2008 Officers Wade Crowfoot , Director, Climate Change Initiatives, San Francisco Mayor Gavin Newsom Steve Hoffmann , President, Hoffmann & Associates Rich Pietrafesa , Managing Director, Destiny USA Tomek Rondio , President, Mortgage Green Michael Schneider , Vice President, Marxa Kubo Mario Silvestri , Vice President, Wells Fargo Ken Willis , Vice President & Director, Federal Home Loan Bank of Boston Dan Winters , Managing Principal, Evolution Partners
- 7. Develop / Finance / Occupy Green Buildings
- 11. Economic Benefits Projected* 70% US Commercial Green Building Market Penetration * Energy Savings & Daylighting: $36 Billion/yr Construction Waste Reduction: $6.7 B/yr Water Pollution Savings from Water Conservation: $20 B/yr Energy Savings from appliances & Lighting: $24 B/yr Added Value from Increased Occupant Productivity (5%), IAQ & Reduced Absenteeism: $632 B/yr Health Care Savings $75 B/yr Emission Reductions’ Market Value: $ 1.1 B/yr Total $795 Billion/yr. value added * 1. Leonardo Academy / MTS Projections 2003, Surgeon General 2006 (certified bdgs). 2. Green retail buildings will also accrue increased retail sales. 3. Excludes overwhelming benefits from avoided climate damages, & originator profits. 4. Dollar benefits are $200B/yr. for UK, $200B/yr. for rest of Western Europe, $87B/yr. for Canada & $80B/yr. for Australia. MBS is $4 trillion global industry (SEC 2003).
- 13. Before it’s too late Capital Markets Partnership
- 14. US Conference of Mayors Support Resolution June 2008
- 16. Electricity Transportation Heating Allocation of 6.2 GtC/yr Electricity: 40% Fuels used directly: 60% Underwriting Standards & SBS Global Carbon Reduction in 5-10 yrs Enhances Energy Security & Stops Imminent Irreversible Dangerous Climate Change Fossil fuel use in 2000 (IEA) Allocation of 6.2 GtC/yr. (Princeton) Buildings generate most of world’s climate pollution from electricity and heating. On average, certified buildings have 50% less conventional energy & climate pollution.
- 17. LEED EB CERTIFIED National Geographic Society Headquarters, Wash., DC The Society added $16M in value from this LEED certification from a higher appraised value, raising tenant rents, lower operating costs, increased credit rating from Moody’s, & lower interest rates on large loans secured to the building. Presentation at 2003 Congressional Green Building Luncheon by Chris Liedel, CFO, National Geographic Society.
- 25. Implementation Example Capital Markets Partnership GreenValue Score Formula Energy Star Score = 75 LEED Silver Certified Near Mass-Transit Energy / Water LEED Credits Various IEQ LEED Credits 75 68 30 24 5 0 59 = 59 C M P GREEN SCORE
- 30. Applicability – CMP GreenValue Score Reporting Tool (Optional) Reporting Portfolio Management Lending Asset Management Appraisal Finance Decision Tool
- 31. Applicability – CMP GreenValue Score Leasing / Market Position TI’s – Value Focus Capital Budgeting Reporting Portfolio Management Lending Asset Management Appraisal Finance Decision Tool
- 32. Applicability – CMP GreenValue Score Leasing / Market Position TI’s – Value Focus Capital Budgeting Relative Value Indicator Focused Risk Analysis Obsolescence Signal Reporting Portfolio Management Lending Asset Management Appraisal Finance Decision Tool
- 33. Applicability – CMP GreenValue Score Leasing / Market Position TI’s – Value Focus Capital Budgeting Relative Value Indicator Focused Risk Analysis Obsolescence Signal Buy / Hold / Sell Capital Raising Reporting Portfolio Management Lending Asset Management Appraisal Finance Decision Tool
- 34. Applicability – CMP GreenValue Score Leasing / Market Position TI’s – Value Focus Capital Budgeting Relative Value Indicator Focused Risk Analysis Obsolescence Signal Buy / Hold / Sell Capital Raising Consultants Investors Analysts Reporting Tool (Optional) Reporting Portfolio Management Lending Asset Management Appraisal Finance Decision Tool
- 35. CMP GreenValue Score Leasing / Market Position TI’s – Value Focus Capital Budgeting Reporting Tool (Optional) Relative Value Indicator Focused Risk Analysis Obsolescence Signal Buy / Hold / Sell Capital Raising Consultants Investors Analysts Reporting Portfolio Management Lending Asset Management Appraisal Finance Decision Tool
- 43. Implement Full LEED Scorecard Analysis SS-1 – Site Selection SS-2 – Density/Connectivity SS-4.1 – Public Transportation Access WE-3.1/3.2 – Water Use Reduction EA-1 – Energy Efficiency / ENERGYSTAR Score EA-2 –On-Site Renewable Energy EQ-1 – Outdoor Air Monitoring EQ-2 – Ventilation Effectiveness EQ-3.2 – IAQ Management Plan EQ-4.1 – Adhesives / Sealants EQ-4.2 – Paints and Coatings EQ-4.4 – Composite Wood / Agrifiber EQ-5 – Indoor Chemical / Pollutants EQ-8.1/8.2 – Daylight / Views FEATURE – Green Roof FEATURE – Under Floor Air Distribution INNOVATION – Integrated Design XXX XXX XXXXXXXXXX XXXXXXXXXXXXXXX XX XXXX XXXXXXXXXXXXXXXXXXX XXXXXXXXXX X XXXX X XXXX X XXXX X XXXXXXXXXX X XXXXXXXXXX X XXXXXXXXXX X XXXXXXXXXX XXXXXXXXXXXXXXX XXXXXXXXXX XXXXXXXXXX XXXXXXXXXX These LEED points are linked when performing an assessment of value Income Analysis Summary (Note: Up to 10 LEED Points) SS-6.1 – Stormwater SS-7.2 – Heat Island Effect WE-1.1/1.2 – Water Efficient Landscaping EA-Prerequisite – Commissioning WE-3.1/3.2 – Water Use Reduction EA-1 – Energy Efficiency / ENERGYSTAR Score EA-2 –On-Site Renewable Energy EA-3 – Enhanced Commissioning EA-5 – Measurement and Verification MR-Prerequisite – Recycling FEATURE – Green Roof XXX XX XX XXX X XXXXXXXXXX XX XXXX XXXXXXXXXXXXXXXXXXX XXXXXXXXXX XXXXXXXXXXXXXXX XXXXXXXXXXXXXXX XXXXXX XXXXXXXX XX (Note: Up to 10 LEED-NC Points) EXPENSE Analysis Summary Note: DO NOT DOUBLE COUNT THESE AREAS -5 -4 -3 -2 -1 0 1 2 3 4 5 LOW MEDIUM MEDIUM HIGH HIGH
- 44. Compile Score – Straightforward Analysis
- 47. Crude Oil – Actual (Jan 1997 thru September 24, 2008) World oil production flat since 2004 / China and India’s consumption surging / domestic consumption in oil producing countries increasing Energy traders / OPEC publicly refer to the ‘proper’ price of $85 / barrel at which point OPEC reduces production to support prices
- 48. US Electricity Prices (1982 – 2006) Source: US Department of Energy http://www.eia.doe.gov/fuelelectric.html ₵ / kwh
- 49. US Electric Power Generation Sources (2007)
- 50. DOE Coal Prices June 2003 to July 2006 Source: http://www.eia.doe.gov/cneaf/coal/page/coalnews/coalmar.html Central Appalachia +88% Northern Appalachia +41% Illinois Basin 38% Uinta Basin 114% Powder River Basin 100%
- 51. DOE Coal Prices June 2003 to July 2008 July Price = $149 / ton July Price = $140 / ton Source: http://www.eia.doe.gov/cneaf/coal/page/coalnews/coalmar.html +312% - Central Appalachia +452% - Northern Appalachia +200% - Illinois Basin +254% - Uinta Basin +127% - Powder River Basin
- 53. Natural Gas Spot Prices (Oct ’83 – Apr ‘08) http://www.eia.doe.gov/oil_gas/natural_gas/info_glance/natural_gas.html
- 54. Conventional Energy Costs Expected to Continue Increasing at 20% / yr. for 10 yrs.