
Empfohlen
Weitere ähnliche Inhalte
Was ist angesagt?
Was ist angesagt? (17)
Andere mochten auch
Andere mochten auch (14)
Ähnlich wie ISN Student Reflection Assignments From Roland At Striving Readers
Ähnlich wie ISN Student Reflection Assignments From Roland At Striving Readers (20)
Kürzlich hochgeladen
Kürzlich hochgeladen (20)
ISN Student Reflection Assignments From Roland At Striving Readers
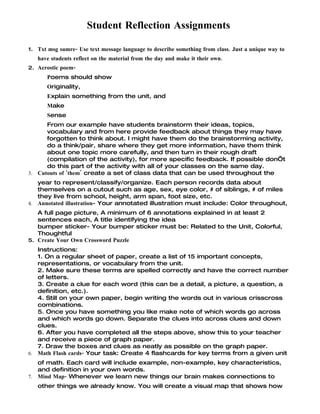
- 1. Student Reflection Assignments 1. Txt msg sumre- Use text message language to describe something from class. Just a unique way to have students reflect on the material from the day and make it their own. 2. Acrostic poem- Poems should show Originality, Explain something from the unit, and Make Sense From our example have students brainstorm their ideas, topics, vocabulary and from here provide feedback about things they may have forgotten to think about. I might have them do the brainstorming activity, do a think/pair, share where they get more information, have them think about one topic more carefully, and then turn in their rough draft (compilation of the activity), for more specific feedback. If possible don’t do this part of the activity with all of your classes on the same day. 3. Cutouts of ‘them’ create a set of class data that can be used throughout the year to represent/classify/organize. Each person records data about themselves on a cutout such as age, sex, eye color, # of siblings, # of miles they live from school, height, arm span, foot size, etc. 4. Annotated illustration- Your annotated illustration must include: Color throughout, A full page picture, A minimum of 6 annotations explained in at least 2 sentences each, A title identifying the idea bumper sticker- Your bumper sticker must be: Related to the Unit, Colorful, Thoughtful 5. Create Your Own Crossword Puzzle Instructions: 1. On a regular sheet of paper, create a list of 15 important concepts, representations, or vocabulary from the unit. 2. Make sure these terms are spelled correctly and have the correct number of letters. 3. Create a clue for each word (this can be a detail, a picture, a question, a definition, etc.). 4. Still on your own paper, begin writing the words out in various crisscross combinations. 5. Once you have something you like make note of which words go across and which words go down. Separate the clues into across clues and down clues. 6. After you have completed all the steps above, show this to your teacher and receive a piece of graph paper. 7. Draw the boxes and clues as neatly as possible on the graph paper. 6. Math Flash cards- Your task: Create 4 flashcards for key terms from a given unit of math. Each card will include example, non-example, key characteristics, and definition in your own words. 7. Mind Map- Whenever we learn new things our brain makes connections to other things we already know. You will create a visual map that shows how
- 2. your brain connects the terms from a given unit. You end result will be something like a web. Make your map look unique and artistic. 8. Picture Analysis- Answer the following questions in complete sentences on your own sheet of paper. Your teacher will assign the graph or diagram to analyze. 9. Venn Diagram Instructions: 1. Copy the venn diagram onto your own paper. 2. Write the name of one concept/topic on one side and the name of the other on the other side. 3. In the first circle list 4 unique characteristics of concept 1. 4. In the second circle list 4 unique characteristics of concept 2. 5. In the middle section listed shared characteristics of the two concepts. 10. Card Sort- Create cards the form a series, for instance small to large objects Sort cards into the correct sequence of steps used to set up and solve a problem Create cards of options/steps to solve problems and have students rank them from least to most desirable. 11. Card Matching- Create cards to review content, for instance matching a term with its definition, example, or a picture/diagram/graph. Create cards for students to classify objects or ideas, for instance number properties, geometric relationships, equivalency. Create cards to practice skills, for instance equations to solve on one set and solutions on the other set. 12. Behavior over time graph- I love this idea to represent information that the students are concerned about and use a graph to do it. It’s not a huge thing but whenever I can do it, I love to have students represent salient topics. Description: Behavior over time graphs can be used for many purposes besides mathematical functions. You can have students predict what a graph will look like before they actually make the graph; you can ask them to analyze a story and graph the suspense or happiness of a character; you can ask them to graph their own behavior compared to some agreed-upon norm. A quick glance can tell you a lot about what the students are thinking. Graphs that are not what you (the teacher) would expect can reveal misconceptions or particularly creative mental models. Graphs can be qualitative or quantitative. The only absolute is that time increases on the x-axis. Remind students that not all graphs are linear. 13. Annotated Classroom Maps – create annotated classroom maps after Experiential Exercises to show how classroom experiences relate to graphical representations. 14. Annotated Illustrations – make annotated illustrations to show how math can be seen in everyday situations. 15. Annotated Slides – use simple sketches of powerful images, accompanied by annotations, to help students understand difficult content. 16. Flow Charts – create flow charts to show causal relationships or to show steps in a sequence. 17. Forms of Poetry – write various forms of poetry to describe a connection between topics/things, to represent a sequence of activities (acrostic).
- 3. 18. Illustrated Dictionary Entries – explain key terms by created illustrated dictionary entries. Write a definition, provide an example and non-example, and draw an illustration to represent each term. 19. Illustrated Outlines – use simple drawings and symbols to graphically highlight or organize class notes. 20.Illustrated Timelines – create illustrated timelines to sequence a series of events in chronological order. 21. Making Connections Outside the Classroom – after completing an activity, find examples outside of class of the topic or concept studied. 22.Metaphorical Representations – create metaphorical representations to explain difficult or abstract mathematical concept. 23.Mosaics – synthesize information from a broad content area by creating mosaics. Use visuals and words to represent similarities, differences, and important concepts. 24.Pictowords – create pictowords (symbolic representations of words or phrases that show their meaning) to help define difficult concepts. 25.Comic Strips –comic strips to provide sequence or commentary on problem solving strategies 26.Posters – draw posters to emphasize key points about important processes or problem solving strategies 27. Spectrums – place information on spectrums to show multiple perspectives on a topic or to express an opinion about an issue. 28.Spoke Diagrams – create spoke diagrams as a visual alternative to outlining. 29.T-Charts – create T-charts to compare classroom experiences with real-life details, to look at advantages and disadvantages of a topic, or to compare and contrast two different items. 30.Venn Diagrams – create Venn diagrams to compare and contrast concepts, representations, or examples.