Private Equity Performance Moved Into Positive Territory in Third Quarter 2003
1. Jeanne Metzger, NVCA, 703-524-2549 ext. 116, jmetzger@nvca.org
Joshua Radler, Thomson Venture Economics, 973-353-7139, joshua.radler@thomson.com
Private Equity Performance Moved Into Positive Territory in Third Quarter 2003
Opening Exit Markets and Increasing Valuations Eased Negative Slide
February 4, 2004 – Newark, NJ – In a sign that the worst may be over after a three year decline in
venture capital performance, the private equity industry posted positive one-year returns for the
first time since the end of 2000, according to the latest performance statistics released by
Thomson Venture Economics and the National Venture Capital Association. Private equity had a
1.3% return for the twelve months ending September 30, 2003 compared to -6.2% for the 12
months ending June 30, 2003. Furthermore, both the venture capital and buyout sectors saw
positive improved performance in the three month period ending September 30, 2003.
“While this latest performance analysis may indicate a small short term improvement, the
movement into positive territory after a three year hiatus has to be a welcome sign for general
partners and institutional investors alike,” according the Jesse Reyes, Vice President and Director
of Private Equity Research at Thomson.
“We are now beginning to see the IPO and acquisition markets improve and company valuations
stabilize,” said Mark Heesen, President of the National Venture Capital Association. “These
trends will positively impact performance over time, but not overnight. We continue to focus on
longer term returns as the true measure of private equity performance.”
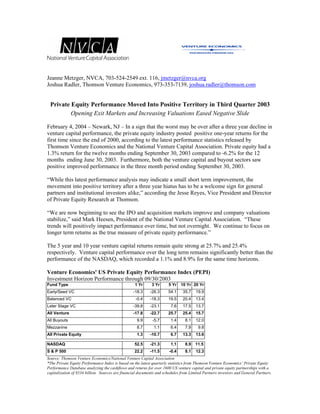
The 5 year and 10 year venture capital returns remain quite strong at 25.7% and 25.4%
respectively. Venture capital performance over the long term remains significantly better than the
performance of the NASDAQ, which recorded a 1.1% and 8.9% for the same time horizons.
Venture Economics' US Private Equity Performance Index (PEPI)
Investment Horizon Performance through 09/30/2003
Fund Type 1 Yr 3 Yr 5 Yr 10 Yr 20 Yr
Early/Seed VC -18.3 -26.3 54.1 35.7 19.9
Balanced VC -0.4 -18.3 19.5 20.4 13.4
Later Stage VC -39.8 -23.1 7.6 17.5 13.7
All Venture -17.8 -22.7 25.7 25.4 15.7
All Buyouts 9.9 -5.7 1.4 8.1 12.0
Mezzanine 8.7 1.1 6.4 7.9 9.8
All Private Equity 1.3 -10.7 6.7 13.3 13.6
NASDAQ 52.5 -21.3 1.1 8.9 11.5
S & P 500 22.2 -11.5 -0.4 8.1 12.3
Source: Thomson Venture Economics/National Venture Capital Association
*The Private Equity Performance Index is based on the latest quarterly statistics from Thomson Venture Economics’ Private Equity
Performance Database analyzing the cashflows and returns for over 1600 US venture capital and private equity partnerships with a
capitalization of $534 billion. Sources are financial documents and schedules from Limited Partners investors and General Partners.
2. All returns are calculated by Thomson Venture Economics from the underlying financial cashflows. Returns are net to investors after
management fees and carried interest.
When asked what has attributed to the increase in performance, Reyes adds, “the short-term
quarterly improvement in performance has been driven by an increase in distributions to limited
partners as a result of exits through acquisitions and a few IPOs. However, distributions alone do
not tell the whole story. Improved valuations on companies left in portfolios has mirrored the
overall improvement in equity values overall as evidenced by the boom in the technology market.
Distributions had fallen dramatically in recent years, but have been steadily improving over the
last few quarters. The industry’s biggest challenge regarding fund performance is that many
technology company valuations remain at significantly lower levels than they were at the time of
original investment.”
Venture Economics’ US Private Equity Performance Index (PEPI) – 3 Month Returns
All Venture All Buyouts All Private Equity
09/30/2000 11.7 -2.0 3.4
12/31/2000 -15.9 -6.4 -9.7
03/31/2001 -11.9 -2.9 -6.0
06/30/2001 -3.8 0.5 -0.8
09/30/2001 -13.8 -8.0 -9.6
12/31/2001 -6.2 -1.9 -3.0
03/31/2002 -6.0 -0.3 -2.3
06/30/2002 -8.6 0.0 -2.6
09/30/2002 -11.0 -8.2 -8.4
12/31/2002 -8.2 2.6 -1.1
03/31/2003 -3.2 -0.1 -1.1
06/30/2003 -7.3 8.2 3.7
09/30/2003 1.6 0.9 1.5
Source: Thomson Venture Economics & National Venture Capital Association
Investment Benchmark Series:
In addition to these publicly reported quarterly results, a more comprehensive analysis on fund
performance can be found in Thomson Venture Economic’s Investment Benchmark Series, The
2003 Investment Benchmarks Report: Venture Capital and 2003 Investment Benchmarks Report:
Buyouts and Other Private Equity. The IBR:VC has over 1,000 partnerships formed from 1969 to
2002 representing over 400 firms while the IBR:Buyouts has 550 partnerships formed from 1976
to 2002 representing over 270 firms. Performance statistics are provided by vintage year (year of
fund formation), by composite portfolio (multiple vintage years) and by time horizons (1,3,5,
years...) analyzed by stage, fund size and sequence. Also, both publications provide correlation
analysis to indicate how the private equity asset classes interact with other types of equity and
debt investments. For more information, please contact Rob Mills at 646-822-3045.
Thomson Venture Economics, a Thomson Financial company, is the foremost information
provider for equity professionals worldwide. Venture Economics offers an unparalleled range of
products from directories to conferences, journals, newsletters, research reports, and the Venture
Expert™ database. For over 35 years, Venture Economics has been tracking the venture capital
and buyouts industry. Since 1961, it has been a recognized source for comprehensive analysis of
3. investment activity and performance of the private equity industry. Venture Economics maintains
a long-standing relationship within the private equity investment community, in-depth industry
knowledge, and proprietary research techniques. Private equity managers and institutional
investors alike consider Venture Economics information to be the industry standard. For more
information about Venture Economics, please visit www.ventureeconomics.com.
Thomson Financial
Thomson Financial (www.thomsonfinancial.com), is a US$2 billion provider of information and
technology solutions to the worldwide financial community. Through the widest range of
products and services in the industry, Thomson Financial helps clients in more than 70 countries
make better decisions, be more productive and achieve superior results. Thomson Financial is
part of The Thomson Corporation (www.thomson.com), a leading provider of integrated
information solutions to business and professional markets worldwide. The Corporation reported
2002revenues of US$7.8 billion and its common shares are listed on the New York and Toronto
stock exchanges (NYSE: TOC; TSX: TOC).
The National Venture Capital Association (NVCA) represents approximately 450 venture
capital and private equity organizations. NVCA's mission is to foster the understanding of the
importance of venture capital to the vitality of the U.S. and global economies, to stimulate the
flow of equity capital to emerging growth companies by representing the public policy interests
of the venture capital and private equity communities at all levels of government, to maintain
high professional standards, facilitate networking opportunities and to provide research data and
professional development for its members. For more information visit www.nvca.org.