SlideShare ist ein Scribd-Unternehmen logo
1 von 10
The Universal Transverse Mercator System
Steven Dutch, Natural and Applied Sciences, University of Wisconsin - Green Bay
First-time Visitors: Please visit Site Map and Disclaimer. Use "Back" to return here.

The Transverse Mercator Projection
The familiar Mercator projection used on so many world maps is a cylindrical projection,
meaning the globe is encircled by an imaginary cylinder touching at the equator, and the earth is
projected onto the cylinder. Contrary to a lot of geography texts, the projection is not what would
result from placing a light at the center of the earth and projecting the surface onto the cylinder.
(That projection, called the cylindrical gnomonic, results in extreme distortion in polar areas and
has virtually no practical uses.) The term "map projection" actually means any mathematical
transformation of the globe onto some other surface, including many that can't be physically
realized by any actual optical projection system.

The Mercator projection is a conformal projection, meaning that angles and small shapes on the
globe project as the same angles or shapes on the map. The price paid by all conformal
projections is great variation in scale away from the central portions of the map. Greenland on a
Mercator map looks as big as South America, though it has actually only 1/8 the area. However,
a small portion of the Greenland coast (or any small region, in fact) has the same shape on the
map as it does on the ground.
Within ten degrees or so of the equator, the scale error on a
Mercator map is only a percent or so, so in that region a
Mercator map is about as accurate as a map can get. There's
no reason the cylinder has to touch at the equator, though. To
map Argentina and Chile, which are long and oriented northsouth, a good choice would be a Mercator projection whose
cylinder touches the earth along a meridian of longitude (65
degrees west will do nicely). Such a projection is called a
Transverse Mercator projection (shown at left).
The cylinder might also be oblique; for example to map the
plate margins around the north Pacific, you might use a
cylinder touching along the great circle from San Francisco to
Tokyo. This would be an Oblique Mercator projection.

•

Left: cylinder for a normal Mercator
projection

•

Right: cylinder for a Transverse Mercator
projection.

Because the Transverse Mercator projection is very accurate in narrow zones, it has become the
basis for a global coordinate system called the Universal Transverse Mercator System or UTM
System. The globe is subdivided into narrow longitude zones, which are projected onto a
Transverse Mercator projection. A grid is constructed on the projection, and used to locate
points. The upside of the grid system is that, since the grid is rectangular and decimal, it is far
easier to use than latitude and longitude. The downside is that, unlike latitude and longitude,
there is no way to determine grid locations independently.
•

a. A cylinder touching the globe at the
central meridian of a longitude zone
lies entirely outside the earth, and areas
away from the central meridian project
larger than on the globe.

•

b. A cylinder that touches the outer
edges of the zone lies entirely inside
the earth within the zone, and areas
within the zone project smaller than
their true size on the globe.

•

c. The scale is actually set to be the
best overall compromise. We not only
want the grid to be useful for
specifying location, but we want
distances measured on the grid to be as
close as possible to distances on the
ground.

The scale along the central meridian of each zone is 0.9996 of true scale. True scale occurs about
180 kilometers east and west of the central meridian.

Grids and Geoids
Latitude can be determined by astronomical observations. So can longitude provided you also
have an accurate timekeeping standard. Drop an explorer in a completely unknown - even
unexplored - place with the appropriate instruments, and he can determine his location exactly in
terms of latitude and longitude. That's how Amundsen and Scott knew they were at the South
Pole (Scott also knew because he could see Amundsen's Norwegian flag). But a UTM grid is a
completely artificial construct; the only way to plot a UTM grid on a map is to calculate how the
grid relates to latitude and longitude, then superimpose the grid on the map. The calculation is
going to depend somewhat on the assumptions you make about the shape of the earth, because
on an ellipsoidal earth, degrees of latitude vary slightly in length (a bit longer at the poles). In
theory, NATO and the former Warsaw Pact both used UTM grids and therefore their grids
should have been identical. In reality, grid coordinates on maps made by the two sides could
differ by up to several hundred meters because the maps were made using slightly different
models for the shape of the earth (called geoids). Several hundred meters over the 10,000
kilometers from equator to pole isn't much, except if you're trying to locate, say, a minefield.

How Grid Systems Are Organized
All UTM grid systems divide the globe into narrow longitude zones. Both NATO or Warsaw
Pact systems use zones six degrees wide. Along the central meridian of each zone, the grid
coincides with the meridian. East and west of the central meridian the grid and meridians do not
coincide because meridians converge.
The Metric System was defined so that the distance from equator to pole should be exactly 10
million meters or 10,000 kilometers. It isn't exactly, because the model for the shape of the earth
in those days wasn't perfectly accurate, but it's quite close (actually about 10,002 kilometers). So
all UTM grid systems, NATO or Warsaw Pact, begin counting from zero at the equator.
The beauty of using longitude zones six degrees wide is that, at the equator, a zone is about
40,000/60 or 667 kilometers wide. Thus it is possible to create numbering systems so that
distances on the grid in kilometers have at most three digits.

The NATO System
Like so many things in cartography, the UTM system was inspired by the military. Some
scientists object to using it for that reason. My philosophy is that if you refuse to use a useful tool
because of its origins, you probably have other problems that will keep you from being an
effective scientist.
Maps in the U.S., Canada, and many western European countries use a grid system common to
NATO, the North Atlantic Treaty Organization.

Grid Zones
The map above shows how the NATO UTM system divides the earth into 60 longitude zones,
each six degrees wide. The numbering begins at Zone 1 at 180 degrees west and proceeds
eastward. To find the grid zone for any longitude:
Treat west longitude as negative and east as positive.
Add 180 degrees; this converts the longitude to a number between zero and 360 degrees.
•

•

•

Divide by 6 and round up to the next higher number.

For example, Green Bay, Wisconsin is at 88 degrees west, or -88 degrees. Adding 180, we get 92
degrees (Green Bay is 92 degrees east of the International Date Line). 92/6 = 15.33, which we
round up to 16. So Green Bay is in Zone 16. This information will usually be somewhere on just
about every topographic map.
Latitude is also divided into zones, but less regularly. Zones are lettered from A at the South Pole
to Z at the North. The circle south of 80 degrees is divided into two zones, A and B. Thereafter
zones are 8 degrees wide. Zone M is just south of the equator and N is north. Zone T, between 40
and 48 degrees north, includes Green Bay. Zone X, from 72 to 84 degrees north, is 12 degrees
wide and zones Y and Z cover the north polar region north of 84 degrees. I and O are not used
because they can be too easily confused with numbers.
In the unlikely event you ever have to use the UTM grid on a map of the polar regions, those
areas are covered by a different conformal projection called the Polar Stereographic. Since
compass directions have little meaning at the poles, one direction on the grid is arbitrarily
designated "north-south" and the other "east-west" regardless of the actual compass direction.
The UTM coordinates are called "false northing" and "false easting."
In response to innumerable e-mails, you cannot use UTM grid coordinates without
knowing your zone. There are sixty points on the earth's surface that have the same
numerical UTM coordinates.

Grid North
Since meridians converge, the UTM grid coincides exactly with compass directions only along
the central meridian of each zone. For Green Bay, in zone 16, that meridian is 87 degrees west.
Elsewhere, the grid makes an angle to the meridians, and at the edges of the zone it's pretty
noticeable. It's important to note whether azimuths are being plotted with respect to true north
(meridians) or grid north (the north-south lines of the grid). This information, along with the
direction of magnetic north, is plotted on most topographic maps. Military people, who work
with UTM grids all the time, tend to rely on grid north. Scientists in the field, who are more
likely to use the UTM grid only for recording locations, might opt to use whatever is most
convenient.
Exercise: What is the largest possible difference between grid north and true north (except in the
polar zones)? Answer below.
100-kilometer Digraphs
NATO maps subdivide grid zones into 100-kilometer squares, which are labeled with two-letter
designations called digraphs. The actual lettering scheme is complex, but is designed so that the
same digraph is not repeated within 15 degrees in any direction.
The longitude zones in the UTM system are extremely important because the whole map
projection changes at the boundary. The latitude zones are comparatively unimportant because
the projection cylinder used in any zone circles the entire globe. They are used principally to
give a rough idea of latitude. So digraph letters change at the boundaries of grid zones, but not at
latitude zones.

Determining Grid Coordinates
On NATO-style maps, the
fundamental unit is the 100-km
square. Imagine that Point X lies .
72417 of the way across the square
from west to east, and .43762 of the
way up from south to north. The
digraph identifier for this square is
DQ.
On many maps, one-kilometer grid
squares are printed. The onekilometer grid square containing
Point X is shown at lower right. It's
.417 of the way across the square
from west to east and .762 of the
way from south to north.
We could give the locations of point X accurate to the nearest meter by saying it is at .72417
east, and .43762 north, just like reading Cartesian coordinates. The decimal point is cumbersome
and unnecessary, so we omit it. We give the coordinate as 72417 43762, understanding that the
first five digits are the fraction of the way across and the second is the fraction of the way up.
To specify the location accurate to only ten meters, we would say 7241 4376, understanding that
the point is somewhere between .7241 and .7242 of the way across, and somewhere between .
4376 and .4377 of the way up. A location accurate to 100 meters would be 724 437, and a
location accurate to a kilometer would be 72 43.
Do you round? Depends on the application. If you want the best estimate for a given level of
accuracy and you don't expect to have to refine it, then probably. If your project supervisor says
don't round, then don't (not rounding is the norm in the military). If you want to specify
something as being within a box of a certain size, then no. Especially with one-kilometer
squares, don't round. One kilometer squares are printed on many maps. Point X above is between
72 and 73 kilometers from the west edge of the grid square, and 43 and 44 kilometers from the
bottom. It is in grid square 72 43. Rounding the value 43762 to 44 would put you in the next
grid square north.
Grid coordinates always have an even number of digits. The first half is the easting or
fraction of the way east across the 100-km square, the second is the northing or fraction
of the distance north across the square.
• The number of digits indicates the level of accuracy. Take the number of digits in each
portion of the coordinate. Raise 10 to that power and divide 100 km (100,000 meters) by
the result to find the level of accuracy. Example: 3 digits. 103=1000. 100,000/1000 = 100.
Hence 3 digits for each portion (6 digits overall) means 100-meter accuracy.
•

•

To remove ambiguity, always include the digraph. Point X, to 100-meter accuracy, is at
DQ 724 437

•

In cases where information is being reported to someone far away, it may be necessary to
include the zone designators as well

•

Often coordinates are run together, like DQ724437. No problem; simply count the digits
and split them in half.

•

Never round 1-kilometer grid locations because the identifier refers to a specific grid box
on the map.

The Global UTM System
The NATO system relies on labels for 100-kilometer grid squares. If your map doesn't have the
labels, then what? The system used in many scientific reports (and was used by the former
Warsaw Pact) divides the earth into longitude zones but relies on purely numerical coordinates
within each zone.
Distances are simply measured northward, starting at zero at the equator. Modern U.S.
topographic maps include tick marks along the margin for plotting a UTM grid, and the northsouth tick marks might look like this: 4873. The large 73 is the distance in kilometers north from
the bottom of the local 100-kilometer grid square, and the small 48 is hundreds of kilometers
from the equator. So that tick mark is 4873 kilometers north of the equator (strictly true only
along the central meridian).
East-west distances are measured from the central meridian. The central meridian is designated
500 kilometers. Since six-degree longitude zones are at most 667 kilometers wide, the kilometer
value east-west can never be lower than 166 or greater than 834 - in other words, always three
digits.
In this system, the coordinates are of unequal length. Also, the order is reversed: the north-south
value comes first, then the east-west. NATO coordinates are read in the same order as Cartesian
coordinates, global UTM coordinates are read in the same order as latitude and longitude.
For measurements to better than one-kilometer precision, add extra digits:
Precision

North-South
Digits

East-West
Digits

1 kilometer

4

3

100 meters

5

4

10 meters

6

5

1 meter

7

6

What Happens at the Equator?
The metric system was set up so that the distance from equator to pole would be exactly 10,000
kilometers. So ideally, you could start measuring kilometers beginning with zero at the South
Pole, hitting 10,000 at the equator, and 20,000 at the North Pole. To avoid using five digits, we
allow the figures to "roll over" like an automobile odometer. The South Pole would be 0000, one
kilometer south of the equator would be 9999, the equator is 0000, one kilometer north is 0001
and so on. One kilometer from the North Pole would be 9999 and the North Pole itself would be
0000.
And that's just how it's done, except that we define the equator as 0000, number north and south
from there, and don't worry about any minor discrepancies at the poles. You do, of course, have
to distinguish a coordinate in the northern hemisphere from an identical one in the southern, but
that's almost never a problem in practice.
The actual distance from equator to pole is about 10,002 kilometers, but because the scale along
the central meridian is smaller than true scale, the northing value at the north pole would be only
9998 if the grid continues all the way from equator to pole. Counting would begin at 0002 at the
south pole. In reality, I don't know how the polar grids are reconciled. The northernmost
topographic sheet for Greenland stops at 84 north, and none of the maps I found for Antarctica
had UTM grids. I suspect that, since the polar stereographic grids would line up with UTM grids
only at the four meridians 0, 90, 180 and 270, the count starts (or ends) at zero at the poles and
simply breaks off like any other zone boundary at 84 degrees.

Appendix: The Digraph Lettering System
I and O are omitted since they can be confused with numbers, and for north-south designations
W-Z are omitted as well. Thus there are 480 possible letter combinations rather than the 676 if
all letters were used.
The first letter of a digraph denotes its east-west position in its longitude zone. Since zones
extend at most 333 kilometers east and west of the central meridian, we need at most 4 letters for
each side or eight total. Thus we can use the 24 letters in blocks of eight. One zone will have
digraphs beginning with A-H, the next with J-R and the last with S-Z. Then the cycle repeats.
For north-south designations (the second letter), lettering begins at the equator with A and F in
alternate zones. Since north-south letters alternate in a cycle of two but east-west letters in a
cycle of three, the same lettering repeats only after six zones. The grid square (actually part of a
grid square) whose lower left corner is at the equator and 180 degrees west is AA.
Exercise: What is the digraph for Green Bay, Wisconsin (44.5N, 88W)?
Answer: Green Bay is in Zone 16 ( (180-88)/6 = 15.33, rounded up to 16). That means we have
gone through five cycles of east-west lettering and are starting on a sixth. Hence the first letters
of the digraph are A-H, with A-D west of the central meridian and E-H east of it. Green Bay is
only a degree west of the central meridian of 87 degrees, and the formula for a degree of
longitude is 111 kilometers times the cosine of latitude. In this case that degree translates to only
79 kilometers from the meridian. This is less than one grid square, so the first letter of the
digraph is D.
A degree is about 111 kilometers (40,000/360) so 44.5 degrees equals 4940 km. Since Zone 16
is an even number, the second letter of the digraph will begin with F at the equator. 4940
kilometers is two complete cycles of lettering, plus 940 kilometers, or the tenth 100-km grid
square starting with F. That's Q, so the correct digraph is DQ.
Warning! There's an older system printed on many U.S. maps, in which the digraph for the same
100-km square is DE. Be careful to ascertain which system is used on your maps!
Exercise: What is the digraph for Berlin, Germany (52.5N, 13.5E)?
Answer: The zone is (180+13.5)/6 = 32.25, or 33. That's the end of 11 north-south lettering
cycles, so the digraphs in this grid zone begin with letters S-Z. S-V are west of the central
meridian, W-Z east of it. The zone extends from 12-18 degrees east, so the central meridian is 15
east. Berlin is 1.5 degrees west of the meridian, giving it a digraph letter U or V. It's a close call
(it's actually U).
52.5 degrees is about 5830 km. Zone 33 is an odd number, so the second letter of the digraph
starts with A at the equator. We are only 170 kilometers shy of 6000 kilometers or three
complete lettering cycles, putting us in the second grid square before the end, meaning the
second digraph letter is also U. Thus the digraph for Berlin is UU.

Warning!
Older maps have a variety of grid systems and lettering schemes. Be very cautious about grid
references on maps over 10-15 years old!

Answer to Question:
Consider what happens to Zone 30 at the North pole. We'll ignore the way NATO maps handle
the poles for this purpose. The zone is bounded by meridians 0 and 6W. The central meridian is
3W. Since all the north-south grid lines are parallel to 3W, they will make an angle of 3 degrees
with the bounding meridians. As we go toward the equator, the angle gets less. Thus, the
maximum difference between grid north and true north is 3 degrees.
Convert Between Geographic and UTM Coordinates
Help! My Data Doesn't Look Like A UTM Grid!
Go to Field Methods Page
Return to Professor Dutch's home page
Created January 11, 2000, Last Update 30 Dec 2010
Not an Official UW-Green Bay Site

Weitere ähnliche Inhalte

Was ist angesagt?

Map Projections ―concepts, classes and usage
Map Projections ―concepts, classes and usage Map Projections ―concepts, classes and usage
Map Projections ―concepts, classes and usage Prof Ashis Sarkar
 
Digitization in ArcGIS
Digitization in ArcGISDigitization in ArcGIS
Digitization in ArcGISKU Leuven
 
Coordinate systems
Coordinate systemsCoordinate systems
Coordinate systemsSaad Raja
 
Geographic Phenomena and their Representations
Geographic Phenomena and their RepresentationsGeographic Phenomena and their Representations
Geographic Phenomena and their RepresentationsNAXA-Developers
 
Georeferencing Image
Georeferencing ImageGeoreferencing Image
Georeferencing ImageSimran Vats
 
Understanding Coordinate Systems and Projections for ArcGIS
Understanding Coordinate Systems and Projections for ArcGISUnderstanding Coordinate Systems and Projections for ArcGIS
Understanding Coordinate Systems and Projections for ArcGISJohn Schaeffer
 
Errors and biases in gps
Errors and biases in gpsErrors and biases in gps
Errors and biases in gpsmaneeb
 
Remote Sensing Platforms and Its types
Remote Sensing Platforms and Its typesRemote Sensing Platforms and Its types
Remote Sensing Platforms and Its typesSenthamizhan M
 
Map projection
Map projectionMap projection
Map projectionkaslinsas
 
Surveying & prismatic compass survey
Surveying & prismatic compass surveySurveying & prismatic compass survey
Surveying & prismatic compass surveySuman Das
 
Principle of aerial photography and types.ppt
Principle of aerial photography and types.pptPrinciple of aerial photography and types.ppt
Principle of aerial photography and types.pptsrinivas2036
 
Application of gis & rs in urban planning
Application of gis & rs in urban planning Application of gis & rs in urban planning
Application of gis & rs in urban planning sathish1446
 
Aerial photography abraham thomas
Aerial photography abraham thomasAerial photography abraham thomas
Aerial photography abraham thomasSumant Diwakar
 

Was ist angesagt? (20)

Map Projections ―concepts, classes and usage
Map Projections ―concepts, classes and usage Map Projections ―concepts, classes and usage
Map Projections ―concepts, classes and usage
 
Digitization in ArcGIS
Digitization in ArcGISDigitization in ArcGIS
Digitization in ArcGIS
 
Digital terrain model
Digital terrain modelDigital terrain model
Digital terrain model
 
Coordinate systems
Coordinate systemsCoordinate systems
Coordinate systems
 
Geographic Phenomena and their Representations
Geographic Phenomena and their RepresentationsGeographic Phenomena and their Representations
Geographic Phenomena and their Representations
 
Georeferencing Image
Georeferencing ImageGeoreferencing Image
Georeferencing Image
 
Understanding Coordinate Systems and Projections for ArcGIS
Understanding Coordinate Systems and Projections for ArcGISUnderstanding Coordinate Systems and Projections for ArcGIS
Understanding Coordinate Systems and Projections for ArcGIS
 
Geographical Information System (GIS)
Geographical Information System (GIS)Geographical Information System (GIS)
Geographical Information System (GIS)
 
Errors and biases in gps
Errors and biases in gpsErrors and biases in gps
Errors and biases in gps
 
Scope of settlement geography
Scope of settlement geographyScope of settlement geography
Scope of settlement geography
 
Basic coordinate system
Basic coordinate systemBasic coordinate system
Basic coordinate system
 
Remote Sensing Platforms and Its types
Remote Sensing Platforms and Its typesRemote Sensing Platforms and Its types
Remote Sensing Platforms and Its types
 
Elements of a map
Elements of a mapElements of a map
Elements of a map
 
Map projection
Map projectionMap projection
Map projection
 
Surveying & prismatic compass survey
Surveying & prismatic compass surveySurveying & prismatic compass survey
Surveying & prismatic compass survey
 
georeference
georeferencegeoreference
georeference
 
Principle of aerial photography and types.ppt
Principle of aerial photography and types.pptPrinciple of aerial photography and types.ppt
Principle of aerial photography and types.ppt
 
GIS
GISGIS
GIS
 
Application of gis & rs in urban planning
Application of gis & rs in urban planning Application of gis & rs in urban planning
Application of gis & rs in urban planning
 
Aerial photography abraham thomas
Aerial photography abraham thomasAerial photography abraham thomas
Aerial photography abraham thomas
 

Andere mochten auch

INTRODUCTION TO REMOTE SENSING
 INTRODUCTION TO REMOTE SENSING INTRODUCTION TO REMOTE SENSING
INTRODUCTION TO REMOTE SENSINGGhassan Hadi
 
Introduction to remote sensing
Introduction to remote sensingIntroduction to remote sensing
Introduction to remote sensingMouna Guru
 
What is grid system
What is grid systemWhat is grid system
What is grid systemchetankane
 
Geographic query and analysis
Geographic query and analysisGeographic query and analysis
Geographic query and analysisMohsin Siddique
 
Global and Local Winds
Global and Local WindsGlobal and Local Winds
Global and Local Windsrebelbrindley
 
Geographic coordinate system & map projection
Geographic coordinate system & map projectionGeographic coordinate system & map projection
Geographic coordinate system & map projectionvishalkedia119
 
Remote Sensing fundamentals
Remote Sensing fundamentalsRemote Sensing fundamentals
Remote Sensing fundamentalsMohammed_82
 
Introduction to MAPS,Coordinate System and Projection System
Introduction to MAPS,Coordinate System and Projection SystemIntroduction to MAPS,Coordinate System and Projection System
Introduction to MAPS,Coordinate System and Projection SystemNAXA-Developers
 
Coordinate systems (Lecture 3)
Coordinate systems (Lecture 3)Coordinate systems (Lecture 3)
Coordinate systems (Lecture 3)Olexiy Pogurelskiy
 
Industrial Disaster Management
Industrial Disaster ManagementIndustrial Disaster Management
Industrial Disaster ManagementPsunita Rao
 
Remote Sensing PPT
Remote Sensing PPTRemote Sensing PPT
Remote Sensing PPTAmal Murali
 

Andere mochten auch (16)

Sofar channel
Sofar channelSofar channel
Sofar channel
 
Map grids
Map gridsMap grids
Map grids
 
Types Of Grid Maps
Types Of Grid MapsTypes Of Grid Maps
Types Of Grid Maps
 
INTRODUCTION TO REMOTE SENSING
 INTRODUCTION TO REMOTE SENSING INTRODUCTION TO REMOTE SENSING
INTRODUCTION TO REMOTE SENSING
 
Mineral Families
Mineral FamiliesMineral Families
Mineral Families
 
Introduction to remote sensing
Introduction to remote sensingIntroduction to remote sensing
Introduction to remote sensing
 
What is grid system
What is grid systemWhat is grid system
What is grid system
 
Geographic query and analysis
Geographic query and analysisGeographic query and analysis
Geographic query and analysis
 
Global and Local Winds
Global and Local WindsGlobal and Local Winds
Global and Local Winds
 
Geographic coordinate system & map projection
Geographic coordinate system & map projectionGeographic coordinate system & map projection
Geographic coordinate system & map projection
 
Remote Sensing fundamentals
Remote Sensing fundamentalsRemote Sensing fundamentals
Remote Sensing fundamentals
 
Introduction to MAPS,Coordinate System and Projection System
Introduction to MAPS,Coordinate System and Projection SystemIntroduction to MAPS,Coordinate System and Projection System
Introduction to MAPS,Coordinate System and Projection System
 
Coordinate systems (Lecture 3)
Coordinate systems (Lecture 3)Coordinate systems (Lecture 3)
Coordinate systems (Lecture 3)
 
remote sensing
remote sensingremote sensing
remote sensing
 
Industrial Disaster Management
Industrial Disaster ManagementIndustrial Disaster Management
Industrial Disaster Management
 
Remote Sensing PPT
Remote Sensing PPTRemote Sensing PPT
Remote Sensing PPT
 

Ähnlich wie The universal transverse mercator system

CEB 809 _L6_Map projection UTM Coordinates and Fiji.pptx
CEB 809 _L6_Map projection   UTM Coordinates and Fiji.pptxCEB 809 _L6_Map projection   UTM Coordinates and Fiji.pptx
CEB 809 _L6_Map projection UTM Coordinates and Fiji.pptxShindiyaLal
 
PROJECTIONS & COORDINATE SYSTEMS-1.pptx
PROJECTIONS & COORDINATE SYSTEMS-1.pptxPROJECTIONS & COORDINATE SYSTEMS-1.pptx
PROJECTIONS & COORDINATE SYSTEMS-1.pptxSaitarunKuna
 
how to present map along with global positioning system
how to present map along with global positioning systemhow to present map along with global positioning system
how to present map along with global positioning systemmrinmoy28
 
Cordinate system and map projection.pdf
Cordinate system and map projection.pdfCordinate system and map projection.pdf
Cordinate system and map projection.pdfsamuelzewdu3
 
Coordinate system Geographical coordinate system
Coordinate system Geographical coordinate systemCoordinate system Geographical coordinate system
Coordinate system Geographical coordinate systemNaresh Kumar
 
Maps as Models of Earth
Maps as Models of EarthMaps as Models of Earth
Maps as Models of Earthmlong24
 
00 charlton map_projections
00 charlton map_projections00 charlton map_projections
00 charlton map_projectionsDublinked .
 
Maps as Models of Earth
Maps as Models of EarthMaps as Models of Earth
Maps as Models of Earthmlong24
 
GPS Datum Conversion and Improvement in GPS Accuracy
GPS Datum Conversion and Improvement in GPS AccuracyGPS Datum Conversion and Improvement in GPS Accuracy
GPS Datum Conversion and Improvement in GPS Accuracyijsrd.com
 
Family of cylindrical map projection
Family of cylindrical map projectionFamily of cylindrical map projection
Family of cylindrical map projectionNasir Mughal
 
GIS_lec 2_Different_Spatial coordinate system.ppt
GIS_lec 2_Different_Spatial coordinate system.pptGIS_lec 2_Different_Spatial coordinate system.ppt
GIS_lec 2_Different_Spatial coordinate system.pptMahinMobarrat
 
7. GEODETIC SYRVEYING (SUR) 3140601 GTU
7. GEODETIC SYRVEYING (SUR) 3140601 GTU7. GEODETIC SYRVEYING (SUR) 3140601 GTU
7. GEODETIC SYRVEYING (SUR) 3140601 GTUVATSAL PATEL
 
A calibration technique for a two axis magnetic compass in telematics devices
A calibration technique for a two axis magnetic compass in telematics devicesA calibration technique for a two axis magnetic compass in telematics devices
A calibration technique for a two axis magnetic compass in telematics devicesPham van Tang
 

Ähnlich wie The universal transverse mercator system (20)

projections.docx
projections.docxprojections.docx
projections.docx
 
Seminar
SeminarSeminar
Seminar
 
CEB 809 _L6_Map projection UTM Coordinates and Fiji.pptx
CEB 809 _L6_Map projection   UTM Coordinates and Fiji.pptxCEB 809 _L6_Map projection   UTM Coordinates and Fiji.pptx
CEB 809 _L6_Map projection UTM Coordinates and Fiji.pptx
 
PROJECTIONS & COORDINATE SYSTEMS-1.pptx
PROJECTIONS & COORDINATE SYSTEMS-1.pptxPROJECTIONS & COORDINATE SYSTEMS-1.pptx
PROJECTIONS & COORDINATE SYSTEMS-1.pptx
 
how to present map along with global positioning system
how to present map along with global positioning systemhow to present map along with global positioning system
how to present map along with global positioning system
 
projection
projectionprojection
projection
 
Cordinate system and map projection.pdf
Cordinate system and map projection.pdfCordinate system and map projection.pdf
Cordinate system and map projection.pdf
 
Coordinate system Geographical coordinate system
Coordinate system Geographical coordinate systemCoordinate system Geographical coordinate system
Coordinate system Geographical coordinate system
 
Maps as Models of Earth
Maps as Models of EarthMaps as Models of Earth
Maps as Models of Earth
 
00 charlton map_projections
00 charlton map_projections00 charlton map_projections
00 charlton map_projections
 
Maps as Models of Earth
Maps as Models of EarthMaps as Models of Earth
Maps as Models of Earth
 
GPS Datum Conversion and Improvement in GPS Accuracy
GPS Datum Conversion and Improvement in GPS AccuracyGPS Datum Conversion and Improvement in GPS Accuracy
GPS Datum Conversion and Improvement in GPS Accuracy
 
Map Projection
Map ProjectionMap Projection
Map Projection
 
Family of cylindrical map projection
Family of cylindrical map projectionFamily of cylindrical map projection
Family of cylindrical map projection
 
GIS_lec 2_Different_Spatial coordinate system.ppt
GIS_lec 2_Different_Spatial coordinate system.pptGIS_lec 2_Different_Spatial coordinate system.ppt
GIS_lec 2_Different_Spatial coordinate system.ppt
 
Unit 1 wiki
Unit 1 wikiUnit 1 wiki
Unit 1 wiki
 
7. GEODETIC SYRVEYING (SUR) 3140601 GTU
7. GEODETIC SYRVEYING (SUR) 3140601 GTU7. GEODETIC SYRVEYING (SUR) 3140601 GTU
7. GEODETIC SYRVEYING (SUR) 3140601 GTU
 
Tema 1 La tierra
Tema 1 La tierraTema 1 La tierra
Tema 1 La tierra
 
Unit1 160131210057
Unit1 160131210057Unit1 160131210057
Unit1 160131210057
 
A calibration technique for a two axis magnetic compass in telematics devices
A calibration technique for a two axis magnetic compass in telematics devicesA calibration technique for a two axis magnetic compass in telematics devices
A calibration technique for a two axis magnetic compass in telematics devices
 

Kürzlich hochgeladen

IAC 2024 - IA Fast Track to Search Focused AI Solutions
IAC 2024 - IA Fast Track to Search Focused AI SolutionsIAC 2024 - IA Fast Track to Search Focused AI Solutions
IAC 2024 - IA Fast Track to Search Focused AI SolutionsEnterprise Knowledge
 
Presentation on how to chat with PDF using ChatGPT code interpreter
Presentation on how to chat with PDF using ChatGPT code interpreterPresentation on how to chat with PDF using ChatGPT code interpreter
Presentation on how to chat with PDF using ChatGPT code interpreternaman860154
 
Unblocking The Main Thread Solving ANRs and Frozen Frames
Unblocking The Main Thread Solving ANRs and Frozen FramesUnblocking The Main Thread Solving ANRs and Frozen Frames
Unblocking The Main Thread Solving ANRs and Frozen FramesSinan KOZAK
 
Mastering MySQL Database Architecture: Deep Dive into MySQL Shell and MySQL R...
Mastering MySQL Database Architecture: Deep Dive into MySQL Shell and MySQL R...Mastering MySQL Database Architecture: Deep Dive into MySQL Shell and MySQL R...
Mastering MySQL Database Architecture: Deep Dive into MySQL Shell and MySQL R...Miguel Araújo
 
Automating Business Process via MuleSoft Composer | Bangalore MuleSoft Meetup...
Automating Business Process via MuleSoft Composer | Bangalore MuleSoft Meetup...Automating Business Process via MuleSoft Composer | Bangalore MuleSoft Meetup...
Automating Business Process via MuleSoft Composer | Bangalore MuleSoft Meetup...shyamraj55
 
Breaking the Kubernetes Kill Chain: Host Path Mount
Breaking the Kubernetes Kill Chain: Host Path MountBreaking the Kubernetes Kill Chain: Host Path Mount
Breaking the Kubernetes Kill Chain: Host Path MountPuma Security, LLC
 
The Role of Taxonomy and Ontology in Semantic Layers - Heather Hedden.pdf
The Role of Taxonomy and Ontology in Semantic Layers - Heather Hedden.pdfThe Role of Taxonomy and Ontology in Semantic Layers - Heather Hedden.pdf
The Role of Taxonomy and Ontology in Semantic Layers - Heather Hedden.pdfEnterprise Knowledge
 
Swan(sea) Song – personal research during my six years at Swansea ... and bey...
Swan(sea) Song – personal research during my six years at Swansea ... and bey...Swan(sea) Song – personal research during my six years at Swansea ... and bey...
Swan(sea) Song – personal research during my six years at Swansea ... and bey...Alan Dix
 
Slack Application Development 101 Slides
Slack Application Development 101 SlidesSlack Application Development 101 Slides
Slack Application Development 101 Slidespraypatel2
 
Histor y of HAM Radio presentation slide
Histor y of HAM Radio presentation slideHistor y of HAM Radio presentation slide
Histor y of HAM Radio presentation slidevu2urc
 
08448380779 Call Girls In Diplomatic Enclave Women Seeking Men
08448380779 Call Girls In Diplomatic Enclave Women Seeking Men08448380779 Call Girls In Diplomatic Enclave Women Seeking Men
08448380779 Call Girls In Diplomatic Enclave Women Seeking MenDelhi Call girls
 
The 7 Things I Know About Cyber Security After 25 Years | April 2024
The 7 Things I Know About Cyber Security After 25 Years | April 2024The 7 Things I Know About Cyber Security After 25 Years | April 2024
The 7 Things I Know About Cyber Security After 25 Years | April 2024Rafal Los
 
[2024]Digital Global Overview Report 2024 Meltwater.pdf
[2024]Digital Global Overview Report 2024 Meltwater.pdf[2024]Digital Global Overview Report 2024 Meltwater.pdf
[2024]Digital Global Overview Report 2024 Meltwater.pdfhans926745
 
Google AI Hackathon: LLM based Evaluator for RAG
Google AI Hackathon: LLM based Evaluator for RAGGoogle AI Hackathon: LLM based Evaluator for RAG
Google AI Hackathon: LLM based Evaluator for RAGSujit Pal
 
From Event to Action: Accelerate Your Decision Making with Real-Time Automation
From Event to Action: Accelerate Your Decision Making with Real-Time AutomationFrom Event to Action: Accelerate Your Decision Making with Real-Time Automation
From Event to Action: Accelerate Your Decision Making with Real-Time AutomationSafe Software
 
Finology Group – Insurtech Innovation Award 2024
Finology Group – Insurtech Innovation Award 2024Finology Group – Insurtech Innovation Award 2024
Finology Group – Insurtech Innovation Award 2024The Digital Insurer
 
How to convert PDF to text with Nanonets
How to convert PDF to text with NanonetsHow to convert PDF to text with Nanonets
How to convert PDF to text with Nanonetsnaman860154
 
The Codex of Business Writing Software for Real-World Solutions 2.pptx
The Codex of Business Writing Software for Real-World Solutions 2.pptxThe Codex of Business Writing Software for Real-World Solutions 2.pptx
The Codex of Business Writing Software for Real-World Solutions 2.pptxMalak Abu Hammad
 
Salesforce Community Group Quito, Salesforce 101
Salesforce Community Group Quito, Salesforce 101Salesforce Community Group Quito, Salesforce 101
Salesforce Community Group Quito, Salesforce 101Paola De la Torre
 
Data Cloud, More than a CDP by Matt Robison
Data Cloud, More than a CDP by Matt RobisonData Cloud, More than a CDP by Matt Robison
Data Cloud, More than a CDP by Matt RobisonAnna Loughnan Colquhoun
 

Kürzlich hochgeladen (20)

IAC 2024 - IA Fast Track to Search Focused AI Solutions
IAC 2024 - IA Fast Track to Search Focused AI SolutionsIAC 2024 - IA Fast Track to Search Focused AI Solutions
IAC 2024 - IA Fast Track to Search Focused AI Solutions
 
Presentation on how to chat with PDF using ChatGPT code interpreter
Presentation on how to chat with PDF using ChatGPT code interpreterPresentation on how to chat with PDF using ChatGPT code interpreter
Presentation on how to chat with PDF using ChatGPT code interpreter
 
Unblocking The Main Thread Solving ANRs and Frozen Frames
Unblocking The Main Thread Solving ANRs and Frozen FramesUnblocking The Main Thread Solving ANRs and Frozen Frames
Unblocking The Main Thread Solving ANRs and Frozen Frames
 
Mastering MySQL Database Architecture: Deep Dive into MySQL Shell and MySQL R...
Mastering MySQL Database Architecture: Deep Dive into MySQL Shell and MySQL R...Mastering MySQL Database Architecture: Deep Dive into MySQL Shell and MySQL R...
Mastering MySQL Database Architecture: Deep Dive into MySQL Shell and MySQL R...
 
Automating Business Process via MuleSoft Composer | Bangalore MuleSoft Meetup...
Automating Business Process via MuleSoft Composer | Bangalore MuleSoft Meetup...Automating Business Process via MuleSoft Composer | Bangalore MuleSoft Meetup...
Automating Business Process via MuleSoft Composer | Bangalore MuleSoft Meetup...
 
Breaking the Kubernetes Kill Chain: Host Path Mount
Breaking the Kubernetes Kill Chain: Host Path MountBreaking the Kubernetes Kill Chain: Host Path Mount
Breaking the Kubernetes Kill Chain: Host Path Mount
 
The Role of Taxonomy and Ontology in Semantic Layers - Heather Hedden.pdf
The Role of Taxonomy and Ontology in Semantic Layers - Heather Hedden.pdfThe Role of Taxonomy and Ontology in Semantic Layers - Heather Hedden.pdf
The Role of Taxonomy and Ontology in Semantic Layers - Heather Hedden.pdf
 
Swan(sea) Song – personal research during my six years at Swansea ... and bey...
Swan(sea) Song – personal research during my six years at Swansea ... and bey...Swan(sea) Song – personal research during my six years at Swansea ... and bey...
Swan(sea) Song – personal research during my six years at Swansea ... and bey...
 
Slack Application Development 101 Slides
Slack Application Development 101 SlidesSlack Application Development 101 Slides
Slack Application Development 101 Slides
 
Histor y of HAM Radio presentation slide
Histor y of HAM Radio presentation slideHistor y of HAM Radio presentation slide
Histor y of HAM Radio presentation slide
 
08448380779 Call Girls In Diplomatic Enclave Women Seeking Men
08448380779 Call Girls In Diplomatic Enclave Women Seeking Men08448380779 Call Girls In Diplomatic Enclave Women Seeking Men
08448380779 Call Girls In Diplomatic Enclave Women Seeking Men
 
The 7 Things I Know About Cyber Security After 25 Years | April 2024
The 7 Things I Know About Cyber Security After 25 Years | April 2024The 7 Things I Know About Cyber Security After 25 Years | April 2024
The 7 Things I Know About Cyber Security After 25 Years | April 2024
 
[2024]Digital Global Overview Report 2024 Meltwater.pdf
[2024]Digital Global Overview Report 2024 Meltwater.pdf[2024]Digital Global Overview Report 2024 Meltwater.pdf
[2024]Digital Global Overview Report 2024 Meltwater.pdf
 
Google AI Hackathon: LLM based Evaluator for RAG
Google AI Hackathon: LLM based Evaluator for RAGGoogle AI Hackathon: LLM based Evaluator for RAG
Google AI Hackathon: LLM based Evaluator for RAG
 
From Event to Action: Accelerate Your Decision Making with Real-Time Automation
From Event to Action: Accelerate Your Decision Making with Real-Time AutomationFrom Event to Action: Accelerate Your Decision Making with Real-Time Automation
From Event to Action: Accelerate Your Decision Making with Real-Time Automation
 
Finology Group – Insurtech Innovation Award 2024
Finology Group – Insurtech Innovation Award 2024Finology Group – Insurtech Innovation Award 2024
Finology Group – Insurtech Innovation Award 2024
 
How to convert PDF to text with Nanonets
How to convert PDF to text with NanonetsHow to convert PDF to text with Nanonets
How to convert PDF to text with Nanonets
 
The Codex of Business Writing Software for Real-World Solutions 2.pptx
The Codex of Business Writing Software for Real-World Solutions 2.pptxThe Codex of Business Writing Software for Real-World Solutions 2.pptx
The Codex of Business Writing Software for Real-World Solutions 2.pptx
 
Salesforce Community Group Quito, Salesforce 101
Salesforce Community Group Quito, Salesforce 101Salesforce Community Group Quito, Salesforce 101
Salesforce Community Group Quito, Salesforce 101
 
Data Cloud, More than a CDP by Matt Robison
Data Cloud, More than a CDP by Matt RobisonData Cloud, More than a CDP by Matt Robison
Data Cloud, More than a CDP by Matt Robison
 

The universal transverse mercator system

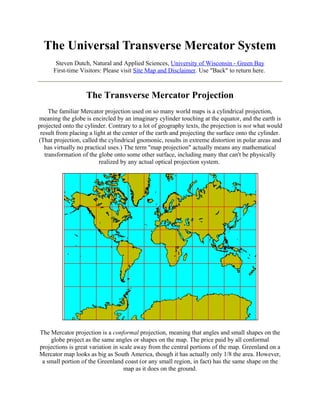
  • 1. The Universal Transverse Mercator System Steven Dutch, Natural and Applied Sciences, University of Wisconsin - Green Bay First-time Visitors: Please visit Site Map and Disclaimer. Use "Back" to return here. The Transverse Mercator Projection The familiar Mercator projection used on so many world maps is a cylindrical projection, meaning the globe is encircled by an imaginary cylinder touching at the equator, and the earth is projected onto the cylinder. Contrary to a lot of geography texts, the projection is not what would result from placing a light at the center of the earth and projecting the surface onto the cylinder. (That projection, called the cylindrical gnomonic, results in extreme distortion in polar areas and has virtually no practical uses.) The term "map projection" actually means any mathematical transformation of the globe onto some other surface, including many that can't be physically realized by any actual optical projection system. The Mercator projection is a conformal projection, meaning that angles and small shapes on the globe project as the same angles or shapes on the map. The price paid by all conformal projections is great variation in scale away from the central portions of the map. Greenland on a Mercator map looks as big as South America, though it has actually only 1/8 the area. However, a small portion of the Greenland coast (or any small region, in fact) has the same shape on the map as it does on the ground.
  • 2. Within ten degrees or so of the equator, the scale error on a Mercator map is only a percent or so, so in that region a Mercator map is about as accurate as a map can get. There's no reason the cylinder has to touch at the equator, though. To map Argentina and Chile, which are long and oriented northsouth, a good choice would be a Mercator projection whose cylinder touches the earth along a meridian of longitude (65 degrees west will do nicely). Such a projection is called a Transverse Mercator projection (shown at left). The cylinder might also be oblique; for example to map the plate margins around the north Pacific, you might use a cylinder touching along the great circle from San Francisco to Tokyo. This would be an Oblique Mercator projection. • Left: cylinder for a normal Mercator projection • Right: cylinder for a Transverse Mercator projection. Because the Transverse Mercator projection is very accurate in narrow zones, it has become the basis for a global coordinate system called the Universal Transverse Mercator System or UTM System. The globe is subdivided into narrow longitude zones, which are projected onto a Transverse Mercator projection. A grid is constructed on the projection, and used to locate points. The upside of the grid system is that, since the grid is rectangular and decimal, it is far easier to use than latitude and longitude. The downside is that, unlike latitude and longitude, there is no way to determine grid locations independently.
  • 3. • a. A cylinder touching the globe at the central meridian of a longitude zone lies entirely outside the earth, and areas away from the central meridian project larger than on the globe. • b. A cylinder that touches the outer edges of the zone lies entirely inside the earth within the zone, and areas within the zone project smaller than their true size on the globe. • c. The scale is actually set to be the best overall compromise. We not only want the grid to be useful for specifying location, but we want distances measured on the grid to be as close as possible to distances on the ground. The scale along the central meridian of each zone is 0.9996 of true scale. True scale occurs about 180 kilometers east and west of the central meridian. Grids and Geoids Latitude can be determined by astronomical observations. So can longitude provided you also have an accurate timekeeping standard. Drop an explorer in a completely unknown - even unexplored - place with the appropriate instruments, and he can determine his location exactly in terms of latitude and longitude. That's how Amundsen and Scott knew they were at the South Pole (Scott also knew because he could see Amundsen's Norwegian flag). But a UTM grid is a completely artificial construct; the only way to plot a UTM grid on a map is to calculate how the grid relates to latitude and longitude, then superimpose the grid on the map. The calculation is going to depend somewhat on the assumptions you make about the shape of the earth, because on an ellipsoidal earth, degrees of latitude vary slightly in length (a bit longer at the poles). In theory, NATO and the former Warsaw Pact both used UTM grids and therefore their grids should have been identical. In reality, grid coordinates on maps made by the two sides could differ by up to several hundred meters because the maps were made using slightly different models for the shape of the earth (called geoids). Several hundred meters over the 10,000 kilometers from equator to pole isn't much, except if you're trying to locate, say, a minefield. How Grid Systems Are Organized All UTM grid systems divide the globe into narrow longitude zones. Both NATO or Warsaw Pact systems use zones six degrees wide. Along the central meridian of each zone, the grid
  • 4. coincides with the meridian. East and west of the central meridian the grid and meridians do not coincide because meridians converge. The Metric System was defined so that the distance from equator to pole should be exactly 10 million meters or 10,000 kilometers. It isn't exactly, because the model for the shape of the earth in those days wasn't perfectly accurate, but it's quite close (actually about 10,002 kilometers). So all UTM grid systems, NATO or Warsaw Pact, begin counting from zero at the equator. The beauty of using longitude zones six degrees wide is that, at the equator, a zone is about 40,000/60 or 667 kilometers wide. Thus it is possible to create numbering systems so that distances on the grid in kilometers have at most three digits. The NATO System Like so many things in cartography, the UTM system was inspired by the military. Some scientists object to using it for that reason. My philosophy is that if you refuse to use a useful tool because of its origins, you probably have other problems that will keep you from being an effective scientist. Maps in the U.S., Canada, and many western European countries use a grid system common to NATO, the North Atlantic Treaty Organization. Grid Zones
  • 5. The map above shows how the NATO UTM system divides the earth into 60 longitude zones, each six degrees wide. The numbering begins at Zone 1 at 180 degrees west and proceeds eastward. To find the grid zone for any longitude: Treat west longitude as negative and east as positive. Add 180 degrees; this converts the longitude to a number between zero and 360 degrees. • • • Divide by 6 and round up to the next higher number. For example, Green Bay, Wisconsin is at 88 degrees west, or -88 degrees. Adding 180, we get 92 degrees (Green Bay is 92 degrees east of the International Date Line). 92/6 = 15.33, which we round up to 16. So Green Bay is in Zone 16. This information will usually be somewhere on just about every topographic map. Latitude is also divided into zones, but less regularly. Zones are lettered from A at the South Pole to Z at the North. The circle south of 80 degrees is divided into two zones, A and B. Thereafter zones are 8 degrees wide. Zone M is just south of the equator and N is north. Zone T, between 40 and 48 degrees north, includes Green Bay. Zone X, from 72 to 84 degrees north, is 12 degrees wide and zones Y and Z cover the north polar region north of 84 degrees. I and O are not used because they can be too easily confused with numbers. In the unlikely event you ever have to use the UTM grid on a map of the polar regions, those areas are covered by a different conformal projection called the Polar Stereographic. Since compass directions have little meaning at the poles, one direction on the grid is arbitrarily designated "north-south" and the other "east-west" regardless of the actual compass direction. The UTM coordinates are called "false northing" and "false easting." In response to innumerable e-mails, you cannot use UTM grid coordinates without knowing your zone. There are sixty points on the earth's surface that have the same numerical UTM coordinates. Grid North Since meridians converge, the UTM grid coincides exactly with compass directions only along the central meridian of each zone. For Green Bay, in zone 16, that meridian is 87 degrees west. Elsewhere, the grid makes an angle to the meridians, and at the edges of the zone it's pretty noticeable. It's important to note whether azimuths are being plotted with respect to true north (meridians) or grid north (the north-south lines of the grid). This information, along with the direction of magnetic north, is plotted on most topographic maps. Military people, who work with UTM grids all the time, tend to rely on grid north. Scientists in the field, who are more likely to use the UTM grid only for recording locations, might opt to use whatever is most convenient. Exercise: What is the largest possible difference between grid north and true north (except in the polar zones)? Answer below.
  • 6. 100-kilometer Digraphs NATO maps subdivide grid zones into 100-kilometer squares, which are labeled with two-letter designations called digraphs. The actual lettering scheme is complex, but is designed so that the same digraph is not repeated within 15 degrees in any direction. The longitude zones in the UTM system are extremely important because the whole map projection changes at the boundary. The latitude zones are comparatively unimportant because the projection cylinder used in any zone circles the entire globe. They are used principally to give a rough idea of latitude. So digraph letters change at the boundaries of grid zones, but not at latitude zones. Determining Grid Coordinates On NATO-style maps, the fundamental unit is the 100-km square. Imagine that Point X lies . 72417 of the way across the square from west to east, and .43762 of the way up from south to north. The digraph identifier for this square is DQ. On many maps, one-kilometer grid squares are printed. The onekilometer grid square containing Point X is shown at lower right. It's .417 of the way across the square from west to east and .762 of the way from south to north. We could give the locations of point X accurate to the nearest meter by saying it is at .72417 east, and .43762 north, just like reading Cartesian coordinates. The decimal point is cumbersome and unnecessary, so we omit it. We give the coordinate as 72417 43762, understanding that the first five digits are the fraction of the way across and the second is the fraction of the way up. To specify the location accurate to only ten meters, we would say 7241 4376, understanding that the point is somewhere between .7241 and .7242 of the way across, and somewhere between . 4376 and .4377 of the way up. A location accurate to 100 meters would be 724 437, and a location accurate to a kilometer would be 72 43. Do you round? Depends on the application. If you want the best estimate for a given level of accuracy and you don't expect to have to refine it, then probably. If your project supervisor says don't round, then don't (not rounding is the norm in the military). If you want to specify something as being within a box of a certain size, then no. Especially with one-kilometer
  • 7. squares, don't round. One kilometer squares are printed on many maps. Point X above is between 72 and 73 kilometers from the west edge of the grid square, and 43 and 44 kilometers from the bottom. It is in grid square 72 43. Rounding the value 43762 to 44 would put you in the next grid square north. Grid coordinates always have an even number of digits. The first half is the easting or fraction of the way east across the 100-km square, the second is the northing or fraction of the distance north across the square. • The number of digits indicates the level of accuracy. Take the number of digits in each portion of the coordinate. Raise 10 to that power and divide 100 km (100,000 meters) by the result to find the level of accuracy. Example: 3 digits. 103=1000. 100,000/1000 = 100. Hence 3 digits for each portion (6 digits overall) means 100-meter accuracy. • • To remove ambiguity, always include the digraph. Point X, to 100-meter accuracy, is at DQ 724 437 • In cases where information is being reported to someone far away, it may be necessary to include the zone designators as well • Often coordinates are run together, like DQ724437. No problem; simply count the digits and split them in half. • Never round 1-kilometer grid locations because the identifier refers to a specific grid box on the map. The Global UTM System The NATO system relies on labels for 100-kilometer grid squares. If your map doesn't have the labels, then what? The system used in many scientific reports (and was used by the former Warsaw Pact) divides the earth into longitude zones but relies on purely numerical coordinates within each zone. Distances are simply measured northward, starting at zero at the equator. Modern U.S. topographic maps include tick marks along the margin for plotting a UTM grid, and the northsouth tick marks might look like this: 4873. The large 73 is the distance in kilometers north from the bottom of the local 100-kilometer grid square, and the small 48 is hundreds of kilometers from the equator. So that tick mark is 4873 kilometers north of the equator (strictly true only along the central meridian). East-west distances are measured from the central meridian. The central meridian is designated 500 kilometers. Since six-degree longitude zones are at most 667 kilometers wide, the kilometer value east-west can never be lower than 166 or greater than 834 - in other words, always three digits. In this system, the coordinates are of unequal length. Also, the order is reversed: the north-south value comes first, then the east-west. NATO coordinates are read in the same order as Cartesian coordinates, global UTM coordinates are read in the same order as latitude and longitude.
  • 8. For measurements to better than one-kilometer precision, add extra digits: Precision North-South Digits East-West Digits 1 kilometer 4 3 100 meters 5 4 10 meters 6 5 1 meter 7 6 What Happens at the Equator? The metric system was set up so that the distance from equator to pole would be exactly 10,000 kilometers. So ideally, you could start measuring kilometers beginning with zero at the South Pole, hitting 10,000 at the equator, and 20,000 at the North Pole. To avoid using five digits, we allow the figures to "roll over" like an automobile odometer. The South Pole would be 0000, one kilometer south of the equator would be 9999, the equator is 0000, one kilometer north is 0001 and so on. One kilometer from the North Pole would be 9999 and the North Pole itself would be 0000. And that's just how it's done, except that we define the equator as 0000, number north and south from there, and don't worry about any minor discrepancies at the poles. You do, of course, have to distinguish a coordinate in the northern hemisphere from an identical one in the southern, but that's almost never a problem in practice. The actual distance from equator to pole is about 10,002 kilometers, but because the scale along the central meridian is smaller than true scale, the northing value at the north pole would be only 9998 if the grid continues all the way from equator to pole. Counting would begin at 0002 at the south pole. In reality, I don't know how the polar grids are reconciled. The northernmost topographic sheet for Greenland stops at 84 north, and none of the maps I found for Antarctica had UTM grids. I suspect that, since the polar stereographic grids would line up with UTM grids only at the four meridians 0, 90, 180 and 270, the count starts (or ends) at zero at the poles and simply breaks off like any other zone boundary at 84 degrees. Appendix: The Digraph Lettering System I and O are omitted since they can be confused with numbers, and for north-south designations W-Z are omitted as well. Thus there are 480 possible letter combinations rather than the 676 if all letters were used. The first letter of a digraph denotes its east-west position in its longitude zone. Since zones extend at most 333 kilometers east and west of the central meridian, we need at most 4 letters for each side or eight total. Thus we can use the 24 letters in blocks of eight. One zone will have digraphs beginning with A-H, the next with J-R and the last with S-Z. Then the cycle repeats.
  • 9. For north-south designations (the second letter), lettering begins at the equator with A and F in alternate zones. Since north-south letters alternate in a cycle of two but east-west letters in a cycle of three, the same lettering repeats only after six zones. The grid square (actually part of a grid square) whose lower left corner is at the equator and 180 degrees west is AA. Exercise: What is the digraph for Green Bay, Wisconsin (44.5N, 88W)? Answer: Green Bay is in Zone 16 ( (180-88)/6 = 15.33, rounded up to 16). That means we have gone through five cycles of east-west lettering and are starting on a sixth. Hence the first letters of the digraph are A-H, with A-D west of the central meridian and E-H east of it. Green Bay is only a degree west of the central meridian of 87 degrees, and the formula for a degree of longitude is 111 kilometers times the cosine of latitude. In this case that degree translates to only 79 kilometers from the meridian. This is less than one grid square, so the first letter of the digraph is D. A degree is about 111 kilometers (40,000/360) so 44.5 degrees equals 4940 km. Since Zone 16 is an even number, the second letter of the digraph will begin with F at the equator. 4940 kilometers is two complete cycles of lettering, plus 940 kilometers, or the tenth 100-km grid square starting with F. That's Q, so the correct digraph is DQ. Warning! There's an older system printed on many U.S. maps, in which the digraph for the same 100-km square is DE. Be careful to ascertain which system is used on your maps! Exercise: What is the digraph for Berlin, Germany (52.5N, 13.5E)? Answer: The zone is (180+13.5)/6 = 32.25, or 33. That's the end of 11 north-south lettering cycles, so the digraphs in this grid zone begin with letters S-Z. S-V are west of the central meridian, W-Z east of it. The zone extends from 12-18 degrees east, so the central meridian is 15 east. Berlin is 1.5 degrees west of the meridian, giving it a digraph letter U or V. It's a close call (it's actually U). 52.5 degrees is about 5830 km. Zone 33 is an odd number, so the second letter of the digraph starts with A at the equator. We are only 170 kilometers shy of 6000 kilometers or three complete lettering cycles, putting us in the second grid square before the end, meaning the second digraph letter is also U. Thus the digraph for Berlin is UU. Warning! Older maps have a variety of grid systems and lettering schemes. Be very cautious about grid references on maps over 10-15 years old! Answer to Question: Consider what happens to Zone 30 at the North pole. We'll ignore the way NATO maps handle the poles for this purpose. The zone is bounded by meridians 0 and 6W. The central meridian is 3W. Since all the north-south grid lines are parallel to 3W, they will make an angle of 3 degrees with the bounding meridians. As we go toward the equator, the angle gets less. Thus, the maximum difference between grid north and true north is 3 degrees.
  • 10. Convert Between Geographic and UTM Coordinates Help! My Data Doesn't Look Like A UTM Grid! Go to Field Methods Page Return to Professor Dutch's home page Created January 11, 2000, Last Update 30 Dec 2010 Not an Official UW-Green Bay Site